Session Governance - Bharal Lal access to ws by empowering communities india (pp-tminimizer)
•Transferir como PPT, PDF•
0 gostou•804 visualizações

![India – Rural water supply its all about scale ,[object Object],[object Object],[object Object],[object Object],[object Object],[object Object],[object Object],[object Object]](data:image/gif;base64,R0lGODlhAQABAIAAAAAAAP///yH5BAEAAAAALAAAAAABAAEAAAIBRAA7)
Recomendados
Mais conteúdo relacionado
Mais procurados
Mais procurados (20)
Semelhante a Session Governance - Bharal Lal access to ws by empowering communities india (pp-tminimizer)
Semelhante a Session Governance - Bharal Lal access to ws by empowering communities india (pp-tminimizer) (20)
Mais de IRC
Mais de IRC (20)
Session Governance - Bharal Lal access to ws by empowering communities india (pp-tminimizer)
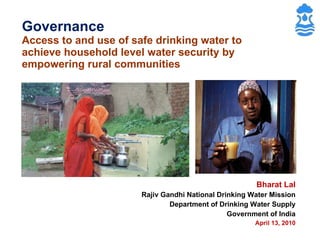
- 1. Governance Access to and use of safe drinking water to achieve household level water security by empowering rural communities Bharat Lal Rajiv Gandhi National Drinking Water Mission Department of Drinking Water Supply Government of India April 13, 2010
- 4. Investment in RWS water sector Rs. in crore
- 9. Scarcity of drinking water
- 10. Drought Prone Areas Supply Through Railways Supply Through Tankers Quality Problems – Fluorosis, Salinity, Nitrate Problem Areas
- 12. Drought prone areas Supply through railways Supply through tankers Quality Problems – Fluorosis,Salinity, Nitrate Problem Areas
- 14. Mitigation of drinking water scarcity (by State Government) Year Work done In the number of villages Expenditure (Indian Rs. in million) 1999-2000 6,423 1,379.60 2000-2001 6,601 1,186.00 2001-2002 5,914 1,011.30 2002-2003 4,847 1,233.50 2003-2004 797 292.40 2004-2005 527 238.30
- 15. Governance unbundling of the sector – institutional set up Bulk water transfer : infrastructure development and management State Government Water Supply Department Gujarat Water Infrastructure Ltd. (GWIL) Gujarat Water Supply & Sewerage Board (GWSSB) Water and Sanitation Management Organisation (WASMO) Water distribution up to village level To facilitate village people for community-managed water supply programmes
- 17. State-wide water supply Grid
- 18. Water supply coverage of villages through State-wide water supply grid Scheme Planned Implemented & water supply started Work under progress Sardar Sarovar Canal Based Drinking Water Supply Scheme 5,315 4,033 1,282 Sujalam Sufalam Yojana 4,904 3,770 1,204 Regional Rural Water Supply Schemes 4,772 4,330 442 Total 14,991 12,133 2,928
- 19. Drinking water infrastructure Bulk Pipeline 1,889 km Distribution network 1,06,000 km ESR 6,415 number 654.00 million litre Sumps 4,689 number 1,102.20 million litre Treatment plants 149 number 2,500 million litre per day
- 23. User participation for safe water Programme introduction and village level water quality team formation 14,216 WQ teams/ villages Village Level Trainings 17,456 training programmes held 125,167 persons trained for WQ testing Block Level Trainings 1,067 (43,234 participants) District Level Trainings 270 (5,117 participants) State Level Trainings 34 (1,377 participants) Water Quality Testing Kits distribution 13,904 Bacteriological Test Kits distribution 6,69,423 Sanitary Survey conducted 20,262
- 24. Improvement in water quality Coverage Pre- Monsoon Post-Monsoon After the campaign No. of districts 23 26 14 No. of Blocks 184 225 110 No. of Villages 7,973 12,135 6,499 No. of samples 17,961 32,074 21,612 Chemically fit samples 13,602 (75%) 23,943 (74%) 17,992 (83%) Bacteriologically fit samples 9,228 (51%) 22,936 (72.5%) 20,960 (97%)
- 25. Safe water - corrective actions
- 26. Corrective action - Sanitation drive
- 28. Rooftop Rain Water Harvesting
- 29. Scaling up
- 31. Year-wise water supply through tankers
- 32. Women’s opinions on problems in fetching water (pre and post implementation by Pani Samiti) Gujarat Vidyapeeth, 2008
- 33. Evaluation ORG – MARG, 2007 Project details & financial issues discussed in village meetings 88.5 % Display of project expenditure details in public place 77 % Gram Sabha convened more than 5 times during the project cycle 90 % Average collection of water tariff by Pani Samiti per person per annum Rs.114.27 Access to water at household level increased from 17.8 % to 75.6 % Satisfaction with improved water services 81.4 % Improvement in hygiene practices among school children – Cutting nails regularly 96 % Washing hands after toilets and before meals 63 % Grievance redressal as per set time schedule 99.6 % Users satisfied with the work of Pani Samiti 96.89 %
- 36. Thank you