Why Srts Matters
•
1 gostou•2,327 visualizações

Presentation by Molly Gable on Feb 2, 2010

Recomendados
Recomendados
Mais conteúdo relacionado
Destaque
Semelhante a Why Srts Matters
Semelhante a Why Srts Matters (20)
Mais de iowafoodandfitness
Mais de iowafoodandfitness (20)
Último
Último (20)
Why Srts Matters
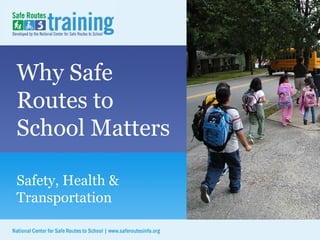
- 1. Why Safe Routes to School Matters Safety, Health & Transportation
- 2. The Good, the Bad, and the Ugly
- 3. Fewer kids are biking and walking More parents are driving 1969 2001 42% walked 16% walked 15% driven 50% driven (U.S. DOT, 2008)
- 4. Parents driving Parents driving their children to school account for 20%-25% of morning rush hour traffic. (Parisi Associates; Melbourne Department of Infrastructure)
- 5. The consequences of this…
- 6. … instead of this can be alarming.
- 7. Today’s children may be the first generation to have a shorter life expectancy than their parents have.
- 8. Promoting safe walking and bicycling is an ideal strategy to increase physical activity
- 12. The Ugly: Today’s barriers to walking and bicycling
- 16. School consolidation has lengthened the trip between home and school In 2001, 16% of students walked 50% were driven to school (U.S. DOT 2008)
- 17. It’s not just distance Private vehicles account for half of all school trips between ¼ and ½ mile. (FHWA, 2001)
- 19. Traffic danger
- 20. Community conditions make it hard to walk or bike
- 21. Adverse weather Is this barrier reflective of changed social norms?
- 23. Safety of Children's Community or Neighborhood Blue = Iowa Orange = Nationwide Never Safe Sometimes Safe Usually/Always Safe [Children ages 0 to 17]
- 26. 1996 Summer Olympic Games banned single occupant cars in downtown Atlanta
- 28. Measurably better around schools with more walkers and cyclists (EPA, 2003) Air quality
- 29. (*BMI ≥30, or ~ 30 lbs overweight for 5’ 4” woman) (Behavioral Risk Factor Surveillance System, CDC, 2007) Obesity trends among U.S. adults: 1985 No Data <10% 10%–14%
- 30. Obesity trends among U.S. adults: 1986 (*BMI ≥30, or ~ 30 lbs overweight for 5’ 4” woman) (*BMI ≥30, or ~ 30 lbs overweight for 5’ 4” woman) (Behavioral Risk Factor Surveillance System, CDC, 2007) No Data <10% 10%–14%
- 31. Obesity trends among U.S. adults: 1987 (*BMI ≥30, or ~ 30 lbs overweight for 5’ 4” woman) (Behavioral Risk Factor Surveillance System, CDC, 2007) No Data <10% 10%–14%
- 32. Obesity trends among U.S. adults: 1988 (*BMI ≥30, or ~ 30 lbs overweight for 5’ 4” woman) (Behavioral Risk Factor Surveillance System, CDC, 2007) No Data <10% 10%–14%
- 33. Obesity trends among U.S. adults: 1989 (*BMI ≥30, or ~ 30 lbs overweight for 5’ 4” woman) (Behavioral Risk Factor Surveillance System, CDC, 2007) No Data <10% 10%–14%
- 34. Obesity trends among U.S. adults: 1990 (*BMI ≥30, or ~ 30 lbs overweight for 5’ 4” woman) (Behavioral Risk Factor Surveillance System, CDC, 2007) No Data <10% 10%–14%
- 35. Obesity trends among U.S. adults: 1991 (*BMI ≥30, or ~ 30 lbs overweight for 5’ 4” woman) (Behavioral Risk Factor Surveillance System, CDC, 2007) No Data <10% 10%–14% 15%–19%
- 36. Obesity trends among U.S. adults: 1992 (*BMI ≥30, or ~ 30 lbs overweight for 5’ 4” woman) (Behavioral Risk Factor Surveillance System, CDC, 2007) No Data <10% 10%–14% 15%–19%
- 37. Obesity trends among U.S. adults: 1993 (*BMI ≥30, or ~ 30 lbs overweight for 5’ 4” woman) (Behavioral Risk Factor Surveillance System, CDC, 2007) No Data <10% 10%–14% 15%–19%
- 38. Obesity trends among U.S. adults: 1994 (*BMI ≥30, or ~ 30 lbs overweight for 5’ 4” woman) (Behavioral Risk Factor Surveillance System, CDC, 2007) No Data <10% 10%–14% 15%–19%
- 39. Obesity trends among U.S. adults: 1995 (*BMI ≥30, or ~ 30 lbs overweight for 5’ 4” woman) (Behavioral Risk Factor Surveillance System, CDC, 2007) No Data <10% 10%–14% 15%–19%
- 40. Obesity trends among U.S. adults: 1996 (*BMI ≥30, or ~ 30 lbs overweight for 5’ 4” woman) (Behavioral Risk Factor Surveillance System, CDC, 2007) No Data <10% 10%–14% 15%–19%
- 41. Obesity trends among U.S. adults: 1997 (*BMI ≥30, or ~ 30 lbs overweight for 5’ 4” woman) (Behavioral Risk Factor Surveillance System, CDC, 2007) No Data <10% 10%–14% 15%–19% ≥20
- 42. Obesity trends among U.S. adults: 1998 (*BMI ≥30, or ~ 30 lbs overweight for 5’ 4” woman) (Behavioral Risk Factor Surveillance System, CDC, 2007) No Data <10% 10%–14% 15%–19% ≥20
- 43. Obesity trends among U.S. adults: 1999 (*BMI ≥30, or ~ 30 lbs overweight for 5’ 4” woman) (Behavioral Risk Factor Surveillance System, CDC, 2007) No Data <10% 10%–14% 15%–19% ≥20
- 44. Obesity trends among U.S. adults: 2000 (*BMI ≥30, or ~ 30 lbs overweight for 5’ 4” woman) (Behavioral Risk Factor Surveillance System, CDC, 2007) No Data <10% 10%–14% 15%–19% ≥20
- 45. Obesity trends among U.S. adults: 2001 (*BMI ≥30, or ~ 30 lbs overweight for 5’ 4” woman) (Behavioral Risk Factor Surveillance System, CDC, 2007) No Data <10% 10%–14% 15%–19% 20%–24% ≥25%
- 46. No Data <10% 10%–14% 15%–19% 20%–24% ≥25% Obesity trends among U.S. adults: 2002 (*BMI ≥30, or ~ 30 lbs overweight for 5’ 4” woman) (Behavioral Risk Factor Surveillance System, CDC, 2007)
- 47. Obesity trends among U.S. adults: 2003 (*BMI ≥30, or ~ 30 lbs overweight for 5’ 4” woman) (Behavioral Risk Factor Surveillance System, CDC, 2007) No Data <10% 10%–14% 15%–19% 20%–24% ≥25%
- 48. Obesity trends among U.S. adults: 2004 (*BMI ≥30, or ~ 30 lbs overweight for 5’ 4” woman) (Behavioral Risk Factor Surveillance System, CDC, 2007) No Data <10% 10%–14% 15%–19% 20%–24% ≥25%
- 49. Obesity trends among U.S. adults: 2005 (*BMI ≥30, or ~ 30 lbs overweight for 5’ 4” woman) (Behavioral Risk Factor Surveillance System, CDC, 2007) < 10% 10%–14% 15%–19% 20%–24% 25%–29% ≥30%
- 50. < 10% 10%–14% 15%–19% 20%–24% 25%–29% ≥30% (*BMI ≥30, or ~ 30 lbs overweight for 5’ 4” woman) (Behavioral Risk Factor Surveillance System, CDC, 2007) Obesity trends among U.S. adults: 2006
- 51. (*BMI ≥30, or ~ 30 lbs overweight for 5’ 4” woman) < 10% 10%–14% 15%–19% 20%–24% 25%–29% ≥30% (Behavioral Risk Factor Surveillance System, CDC, 2007) Obesity trends among U.S. adults: 2007
- 52. Adult Obesity Trends 1995 vs. 2008 Obesity among Iowa adults 66% 35.7 37.6 26.7 44.8 37.7 17.5
- 54. U.S. youth overweight rates (National Center for Health Statistics)
- 55. Comparison of Youth Weights Blue = Iowa Orange = Nationwide Underweight Normal Weight At Risk of Overweight Overweight [Children ages 10 to 17]
- 57. Physical activity Most kids aren’t getting the physical activity they need.
- 58. Physical activity recommendation for children: At least 60 minutes of physical activity on most, preferably all, days of the week. (US Depts. of Health and Human Services and Agriculture, 2005)
- 59. The Good: Communities are taking action on behalf of their kids
- 60. Safe Routes to School programs are part of the solution… … to increase physical activity … to improve unsafe walking and biking conditions … to improve poor air quality by reducing vehicle emissions
- 61. Every school faces a different challenge
- 68. Evaluation Is the program making a difference?
- 82. The very good: Community success stories
- 83. Success story: Columbia, SC
- 84. Success story: Garfield, NJ
- 85. Success story: Farmington, NH
- 86. Success story: Manly, Iowa
Notas do Editor
- Message: Let’s start off with a presentation to set the context for the rest of the day. Let’s talk about Why Safe Routes to School Matters. Note to instructor: Instructor can read the Message section of each slide, beginning on the next slide, for continual dialogue. Extensive background information and citations are provided in the Background or Note to Instructor section of select slides. Background: Key Messages for this Module: This session provides a general overview of Safe Routes to School Programs and why they are important. There are many reasons why it’s beneficial for children to walk to school, but currently, there are barriers to walking to school. SRTS programs can help make it safe to walk and increase the number of children who do so. Learning Objectives: Upon completion of this portion of the training, participants will: Be able to explain why fewer children are walking and bicycling to school and what caused this shift from several decades ago. Be able to describe the consequences of fewer children walking and bicycling to school. Be able to provide examples of communities which are using SRTS programs to increase the level of walking and bicycling by children to school. Image: Latham Elementary School, Winston-Salem, NC provided by Mike Cynecki.
- Message: This is really a story of the Good, the Bad, and the Ugly, but we’re not going to talk about it in that order. We’re going to reverse it, and get the Ugly and the Bad out of the way first, before talking about the very Good solutions that are being undertaken to make things better all across the country The Ugly: A built and social environment that discourages kids from walking and cycling to school The Bad: We have a lot of serious health problems in our country today, largely due to inactivity and poor nutrition, not to mention air quality issues. (Time Magazine cover Dec 2008). The Good: Communities are using Safe Routes to School Programs to build settings and programs where parents and children want to walk and bicycle to school. In many cases, the positive effects are reaching well beyond the schools, and improving the settings for everyone in the community. Images: (l) Time Magazine, Dec 2008; (rt) Anchorage, AK, provided by Bob Laurie; (rb) Atlantic Elementary, Atlantic, IA provided by www.iwalktoschool.org
- Message: First let’s look at the facts. Today, fewer children are walking and biking and more parents are driving. Only a generation ago, children routinely traveled around their neighborhoods either on foot or on bike. Walking and bicycling were common ways to get to school. Today, few children (ages 5 to 18 yr. old) walk or bike. This is a major shift since when most of us were in school.* And as traffic increases, parents become even more convinced that it is unsafe for their children to walk. They begin driving their children to school, thereby adding even more cars to the morning chaos. Note to Instructor: Here’s a simple demonstration: ask all of the adults in the room who walked or bicycled regularly to school to raise their hands. Now ask how many have children in their lives (sons, daughters, grandchildren, neighbors) who walk or bike to school. There’s likely a large difference. Background: *Federal Highway Administration. (2008). NHTS Brief on Travel to School. Washington, D.C.: U.S. Department of Transportation . Image: Chamberlin Elementary School, Burlington, VT provided by Mike Cynecki.
- Message: Traffic congestion around schools is part of the ugly. For most communities, this picture is the norm. Parents driving their children to school make up 20-25 percent of the morning commute.* Background: *Parisi Associates. (2003). Transportation Tools to Improve Children’s Health and Mobility. Available at http://www.lgc.org/freepub/PDF/Land_Use/fact_sheets/sr2s_transportation_tools.pdf . Accessed on July 22, 2008. *Peddie, B. & Somerville, C. Travel Behavior Change Through School Travel Planning: Mode Shift and Community Engagement- Results from 33 Schools in Victoria. Melbourne: Department of Infrastructure. Available at http://www.travelsmart.vic.gov.au/. Accessed July 22, 2008. Image: Provided by Dan Burden.
- Message: Parents may believe it is safest to drive their kids to school, but this decision has may consequences. Children are transported from the house to the car to the school with little interaction with their neighborhoods. A researcher in the UK* asks if children spend all their transportation time in a car, how will they master fundamental pedestrian and bicycling skills and what kinds of drivers will they become? And when it comes to our children’s health, the costs of choosing the transportation option pictured here...(move to next slide) Background: *Hillman M. The Impact of Transport Policy on Children’s Development. Presentation at the Canterbury Safe Routes to Schools Project Seminar, London U.K. May 29, 1999. Available at http://www.spokeseastkent.org.uk/mayer.htm. Accessed January 17, 2006. Image: Chapel Hill, NC provided by PBIC.
- Message: . . .instead of this can be alarming. Image: Monarch Elementary School, Louisville, CO provided by www.iwalktoschool.org.
- Message: Sedentary lifestyles and poor eating habits are major contributors to the current obesity epidemic and increase in related diseases.* The obesity epidemic is just a warning sign of deeper problems to come. Other chronic disease rates are expected to climb, as further results of the American epidemic of physical inactivity. First among these is Type II diabetes which, until recently, was considered “adult onset diabetes.” Public health researchers have begun to speculate that this generation may be the first to not live as long as their parents.** Background: *Serdula M, Ivery D, Coates R, Freedman D, Williamson D, Byers T. (1993). Do obese children become obese adults? A review of the literature. Preventive Medicine, 22(2), 167-77. *American Academy of Pediatrics, Committee on Nutrition. (2003, reaffirmed 2006). Prevention of Pediatric Overweight and Obesity Pediatrics, 112(2), 424-430. Available at http://aappolicy.aappublications.org/cgi/content/full/pediatrics;112/2/424 . Accessed August 11, 2008. *Daniels, S.R., Arnett, D.K., Eckel, R.H., Gidding, S.S., Hayman, L.L., Kumanyika, S. et al. (2005). Overweight in Children and Adolescents: Pathophysiology, Consequences, Prevention, and Treatment. Circulation, 111, 1999-2012. **Stated by: Dr. Kenneth Cooper, The Cooper Institute; Dr. Risa Lavizzo-Mourey, president and CEO of The Robert Wood Johnson Foundation; American Heart Association; Dr. William Klish, professor of pediatrics and head of pediatric gastroenterology at Baylor College of Medicine; Dr. Philip Schauer, an obesity specialist at Magee Women's Hospital in Pittsburgh. Image: Provided by Katy Jones.
- Message: Promoting walking and biking to school is an ideal strategy to increase physical activity and health among children, but we only want to do it if it is safe. And that’s where Safe Routes to School programs come in. Image: Monarch Elementary School, Louisville, CO, provided by www.iwalktoschool.org.
- Message: Safe Routes to School programs can be a way to help: To make walking and bicycling safe ways to get to school. To encourage more children to walk or bike to school. Image: McAuliffe Elementary, Lenexa, KS provided by Mike Cynecki.
- Message: Let’s talk about the history of SRTS. “In the mid-1970s, Denmark was cited as having Europe’s highest child pedestrian accident rate. This prompted the City of Odense to start a pilot program in which all 45 of its schools identified specific road dangers. The city created a network of pedestrian and bicycle paths, narrowed roads, and established traffic islands.” For the past 25 years, approx. 80% of all children in Odense have walked or bicycled to school and in the past 2 decades the number of injured school children in Odense has decreased 30 to 40%*, ** After Denmark's program caught on, other programs began in Great Britain and Canada in the 1990s. The Bronx, a borough of NY City, started the first SRTS project in the U.S. in 1997 and in that same year, the State of Florida implemented a pilot program. Background: *European Union Target. Odense - Safe routes for children. Available at http://www.eu-target.net/WorkAreas/MobilityEducation/OdenseSaferoutesforchildren.htm Accessed on August 12, 2008. **Troels, A. Safe routes give healthy cycling children. Available at http://www.cykelby.dk/eng_safe%20routes.asp. Accessed August 12, 2008. Image(s): (t) Odense, Denmark provided by http://www.cyclecity.dk/eng_safe%20routes.asp; (b) Bronx, New York provided by http://www.transalt.org/campaigns/school/
- Message: While making it safer to walk or bike was the original goal in Denmark, there are many other benefits of SRTS programs. Other benefits include: Reducing congestion around schools. Improving children’s health—physical activity is needed for proper growth and development. Reducing air pollution—this is important since air pollutants have been shown to exacerbate asthma. Saving money for schools (reduce need for hazard busing in which bus service is provided for children who live close to school because the routes are not safe for walking). Other benefits include: Increasing children’s sense of freedom, helping establish lifetime habits, teaching pedestrian skills
- Message: Let’s revisit what I called the ugly—the barriers we’ve created to safe walking and bicycling. Image: Clatskanie, OR provided by PBIC Designing for Pedestrians Course.
- Message: How did we get here? Let’s go back to this earlier photo and take a few moments to understand how we got here. How have schools changed? Have parents and students changed? And what are the community issues involved? Image: Provided by Dan Burden.
- Message: School have changed a lot in recent years. A generation or more ago, schools were small and located in the centers of communities. The close proximity of schools to residential neighborhoods encouraged walking and biking.* Background: Roughly 42 percent of students (from all grades) walked or biked to school in 1969. Breakdown of percentages: 49.3% of elementary; 41.6% of intermediate grades; 26.4% of senior high grades** *Travel and Environmental Implications of School Siting (2003). Washington DC: Environmental Protection Agency, Report No. 231-R-03-004 Available at http://www.smartgrowth.umd.edu/pdf/SchoolLocationReport.pdf. Accessed August 12, 2008. **USDOT. (1972). 1969 Nationwide Personal Transportation Survey Image: Barnes Elementary School, Burlington, VT provided by Mike Cynecki. (Note: this image was taken in 2008 near a centrally located school site.)
- Message: Today, schools are built to accommodate a far larger number of students. In 2005-2006 school year, the average school attendance for elementary and secondary schools was 538 students and 44% of secondary schools had attendance of more than 1500 students.* Schools are increasingly being built on fringe land on the periphery of towns and cities, on parcels anywhere from 10 to 30 acres or more in size. This means that neighborhoods often aren’t connected to schools, making it increasingly difficult for children to walk and bike to school. The high school pictured here is so large that some students are bused to different parts of the campus during the school day.** Background: The reasons for the change in school siting include current land use patterns, school siting standards, and lack of coordination between planners and school officials. *Divided total elementary and regular secondary school enrollment by total number of elementary and regular secondary schools. *National Center for Education Statistics. Average enrollment and percentage distribution of public elementary and secondary schools, by type and size: Selected years, 1982-83 through 2005-06. Available at http://nces.ed.gov/programs/digest/d07/tables/dto7_091.asp and http://nces.ed.gov/programs/digest/d07/tables/dt07_092.asp. Accessed October 6, 2008. **The high school is 292 acres with approx 2700 students. Image: Dorman High School, Roebuck SC (near Spartanburg) provided by Mark Fenton.
- Message: By increasing the distance between home and school, these larger, more distant schools often remove the option of physically active trips to school and encourage higher levels of auto use and pollution. In 2001, 16 percent of students between the ages of five and 15 walked or biked to or from school, and half of all children were driven to school.* Background: *Federal Highway Administration. (2008). NHTS Brief on Travel to School. Washington, D.C.: U.S. Department of Transportation. Image: McAuliffe Elementary School, Lenexa, KS provided by Mike Cynecki.
- Message: But it’s not just distance – private vehicles still account for half of all school trips between ¼ and ½ mile* – that’s less than a 10 minute walk. Background: *Federal Highway Administration. (2008). NHTS Brief on Travel to School. Washington, D.C.: U.S. Department of Transportation. Image: Destin Elementary School, Destin, FL provided by Dan Burden.
- Message: The Centers for Disease Control and Prevention studied how many children walk and bike to school, and what barriers parents report that keeps them from allowing their children to walk or bicycle. Parents say that distance, which we’ve already discussed, traffic dangers, and adverse weather are the main reasons why their children don’t bike or walk to school. Background: In the 2004 survey conducted by the CDC, 1,588 adults answered questions about barriers to walking to school for their youngest child aged 5 to 18 years. Parents cited one or more of the following six reasons.* long distances (61.5%), traffic danger (30.4%), adverse weather conditions (18.6%), and crime danger (11.7%). Note: Survey respondents could identify more than one barrier. The other two items were opposing school policy (6%) and other reasons (11.7%). * U.S. Centers for Disease Control and Prevention. (2005). Barriers to Children Walking to or from School United States. Morbidity and Mortality Weekly Report. Available at www.cdc.gov/mmwr/preview/mmwrhtml/mm5438a2.htm . Accessed August 12, 2008.
- Message: The second barrier given for walking and bicycling to school was traffic – parents feeling it is not safe for their children to walk or bike. Ironically, parents concerned about safety sometimes respond by putting their child in the car and driving them, which may not be a safer alternative, and more parents driving their children to school results in more cars on the road, often making it even less safe for others to walk and bike. But we also need to acknowledge that many of pedestrian and bicyclist injuries and fatalities could likely be avoided if streets were made safer for walking and biking. Background: It is important to acknowledge the statistics – Motor vehicle collisions ARE the leading cause of death for children aged 14 and under*. However, in 2007, only 18% of motor vehicle fatalities for that age group were pedestrians.** *National Highway Traffic Safety Administration. Traffic Safety Facts 2005 Data, Research Note HS 810 936, “Motor Vehicle Traffic Crashes as Leading Cause of Death in the United States, 2005”, Published April 2008. Available at http://www-nrd.nhtsa.dot.gov/Pubs/810936.PDF. Accessed December 1, 2008. **National Highway Traffic Safety Administration. Traffic Safety Facts 2007 Data, Children HS 810-987. Available at http://www.nhtsa.dot.gov/portal/site/nhtsa/menuitem.dfedd570f698cabbbf30811060008a0c/. Accessed December 1, 2008. Image: Browning Elementary, Milwaukee, WI provided by Mark Fenton.
- Message: The reality is that community conditions often make it hard to walk and bicycle. To avoid traffic, people need sidewalks. However, in many places where there are sidewalks, they are often in disrepair or are blocked. Images: (l) Merrimack Valley School District Middle and High School Complex, Penacook, NH provided by John Corrigan. (r) Provided by Michael Ronkin.
- Message: Adverse weather was the third most cited reason parents gave for their children not walking or bicycling to school. However, the weather hasn’t changed much since a generation ago when so many children walked or biked. It’s possible that “weather” as a barrier is really just reflective of changed social norms in contemporary America, where people are accustomed to driving an automobile for almost every trip. That makes it very easy to forego walking and to jump in the car at the first sign of cold or rain or heat. And consider that Safe Routes to School efforts have been very successful in climates with all kinds of weather, from cities across Canada to Chicago, IL and Minneapolis, MN and Arlington, MA. Image: Walking school bus to Fenn Elementary School, Gorham, NH.
- Message: 12% of parents surveyed listed crime danger as a barrier to allowing their children to walk or bike to school. This primarily includes child kidnapping and assault. While crime statistics* tell us that the likelihood of some of these crimes happening is very small, it is important to acknowledge both the realities and the perceptions of these dangers, and find ways to address both. However, communities are finding ways to safeguard against these fears while addressing the other issues. Safe Routes to School in most communities begin with supervised walking efforts, like Walking School Buses, and over time work to ensure more eyes on the street. Background: * U.S. Department of Justice, 2000 and 2002
- Message A State wide and National survey taken by the National Survey of Children's Health in 2007 shows the parents perception of safety in their children's community and/or neighborhood. The Iowa statistics show a lower number of parents percieve their neighbohood as unsafe and more say their neighborhood is usually or always safe. Here we can see that parents believe mostly their neighborhoods are safe, but safety and crime danger is still an issue despite these findings and should be addressed. Reference Child and Adolescent Health Measurement Initiative. 2007 National Survey of Children's Health, Data Resource Center for Child and Adolescent Health website. Retrieved [mm/dd/yy] from www.nschdata.org
- Message: Each community has its own issues that inhibit the ability to walk and bike to school. Communities have cited issues like abandoned buildings, graffitti and stray dogs as disincentives to walking and biking to school. In Cleveland, OH, community members and organizers with the Slavic Village Development Corporation initiated the Mr Blue Project where they spend one day painting abandoned buildings and trimming vegetation in order to make the street feel safer for walking. The image here shows before and after – notice the blue painted “curtains” in the lower photo. Image: Cleveland, OH provided by Emily Miller/Slavic Village Development Corporation.
- Message: Now let’s take a look at the bad, the unintended environmental and health consequences of less walking and bicycling. Image(s): (l) Provided by http://www.ksl.com/index.php?nid=148&sid=1333891; (r) Time Magazine, Dec. 8, 2003.
- Message: The 1996 Olympics in Atlanta was a wonderful opportunity to examine the relationship of traffic, air quality and health. During the 1996 Summer Olympic Games in Atlanta, the city virtually banned single occupant cars in downtown Atlanta in order to prevent gridlock. The Journal of the American Medical Association (JAMA) published a study of the ban and its effects, which show a clear relationship between traffic reduction and reduced incidents of asthma.* Background: *Michael S. Friedman et al. (2001). Impact of Changes in Transportation and Commuting Behaviors During the 1996 Summer Olympic Games in Atlanta on Air Quality and Childhood Asthma. JAMA 285, 897 - 905. Image: Provided by http://olympics.ballparks.com/1996Atlanta/index.htm
- Message: The results of the study showed: Morning rush hour traffic volumes decreased by more than 23%. This decreased the peak amount of ozone by 28% during the 17 days of the Olympics. The researchers compared respiratory acute care events, hospitalizations, and emergency room visits during the Olympics to the four weeks before and after the games. They found that asthma-related acute care events for kids decreased by 41.6% during the games. In short, reducing auto emissions by encouraging alternative forms of transportation, such as walking and biking can help improve the health of children and adults. Background: *Michael S. Friedman et al, “Impact of Changes in Transportation and Commuting Behaviors During the 1996 Summer Olympic Games in Atlanta on Air Quality and Childhood Asthma,” JAMA, Vol. 285, Feb 2001, pp. 897 - 905.
- Message: One of the benefits of SRTS programs is that they help to reduce auto emissions by encouraging alternative forms of transportation, such as walking and biking. A recent EPA report used data from schools in Florida to compare travel choices and air quality implications. Findings included: Schools placed in neighborhoods near residential areas with a good street and sidewalk network have more students arriving by bicycle and on foot. Air quality is measurably better at such locations.* Background: *Travel and Environmental Implications of School Siting. (2003). Washington, D.C.: Environmental Protection Agency, Report No. 231-R-03-004. Available at http://www.smartgrowth.umd.edu/pdf/SchoolLocationReport.pdf. Image: Swansfield Elementary School, Columbia, MD provided by www.iwalktoschool.org.
- Message: The growing obesity trend among adults is a frightening prediction of what will happen to today’s children. I am going to quickly run through a series of slides that shows a portrait of the growth of the obesity epidemic among adults in the US in the last 28 years. This data was collected by the Centers for Disease Control and Prevention through their Behavioral Risk Factor Surveillance System. People self-report height and weight measurements, which are then used to calculate their Body Mass Index (BMI). A BMI of 30 is equivalent to a 5’ 4” tall woman being about 30 pounds overweight, and is the definition of obesity commonly used by health officials. In looking at the maps, the white-colored states have no data to report as they had not yet begun participating in the Behavioral Risk Factor Surveillance System. The palest blue represents less than 10 percent of the population; the slightly darker blue 10 to 15 percent. Let’s watch what happens to these statistics over the years as surveys are collected for all states. Note to Instructor: Quickly run through obesity slides to show obesity trends up to most recent data year. Explain new colors/percentages as they appear. Image: Center for Disease Control and Prevention. U.S. Obesity Trends, 1985-2007. Available at http://www.cdc.gov/nccdphp/dnpa/obesity/trend/maps/index.htm
- Image: Center for Disease Control and Prevention. U.S. Obesity Trends, 1985-2007. Available at http://www.cdc.gov/nccdphp/dnpa/obesity/trend/maps/index.htm
- Image: Center for Disease Control and Prevention. U.S. Obesity Trends, 1985-2007. Available at http://www.cdc.gov/nccdphp/dnpa/obesity/trend/maps/index.htm
- Image: Center for Disease Control and Prevention. U.S. Obesity Trends, 1985-2007. Available at http://www.cdc.gov/nccdphp/dnpa/obesity/trend/maps/index.htm
- Image: Center for Disease Control and Prevention. U.S. Obesity Trends, 1985-2007. Available at http://www.cdc.gov/nccdphp/dnpa/obesity/trend/maps/index.htm
- Image: Center for Disease Control and Prevention. U.S. Obesity Trends, 1985-2007. Available at http://www.cdc.gov/nccdphp/dnpa/obesity/trend/maps/index.htm
- Image: Center for Disease Control and Prevention. U.S. Obesity Trends, 1985-2007. Available at http://www.cdc.gov/nccdphp/dnpa/obesity/trend/maps/index.htm
- Image: Center for Disease Control and Prevention. U.S. Obesity Trends, 1985-2007. Available at http://www.cdc.gov/nccdphp/dnpa/obesity/trend/maps/index.htm
- Image: Center for Disease Control and Prevention. U.S. Obesity Trends, 1985-2007. Available at http://www.cdc.gov/nccdphp/dnpa/obesity/trend/maps/index.htm
- Image: Center for Disease Control and Prevention. U.S. Obesity Trends, 1985-2007. Available at http://www.cdc.gov/nccdphp/dnpa/obesity/trend/maps/index.htm
- Image: Center for Disease Control and Prevention. U.S. Obesity Trends, 1985-2007. Available at http://www.cdc.gov/nccdphp/dnpa/obesity/trend/maps/index.htm
- Image: Center for Disease Control and Prevention. U.S. Obesity Trends, 1985-2007. Available at http://www.cdc.gov/nccdphp/dnpa/obesity/trend/maps/index.htm
- Image: Center for Disease Control and Prevention. U.S. Obesity Trends, 1985-2007. Available at http://www.cdc.gov/nccdphp/dnpa/obesity/trend/maps/index.htm
- Image: Center for Disease Control and Prevention. U.S. Obesity Trends, 1985-2007. Available at http://www.cdc.gov/nccdphp/dnpa/obesity/trend/maps/index.htm
- Image: Center for Disease Control and Prevention. U.S. Obesity Trends, 1985-2007. Available at http://www.cdc.gov/nccdphp/dnpa/obesity/trend/maps/index.htm
- Image: Center for Disease Control and Prevention. U.S. Obesity Trends, 1985-2007. Available at http://www.cdc.gov/nccdphp/dnpa/obesity/trend/maps/index.htm
- Image: Center for Disease Control and Prevention. U.S. Obesity Trends, 1985-2007. Available at http://www.cdc.gov/nccdphp/dnpa/obesity/trend/maps/index.htm
- Image: Center for Disease Control and Prevention. U.S. Obesity Trends, 1985-2007. Available at http://www.cdc.gov/nccdphp/dnpa/obesity/trend/maps/index.htm
- Image: Center for Disease Control and Prevention. U.S. Obesity Trends, 1985-2007. Available at http://www.cdc.gov/nccdphp/dnpa/obesity/trend/maps/index.htm
- Image: Center for Disease Control and Prevention. U.S. Obesity Trends, 1985-2007. Available at http://www.cdc.gov/nccdphp/dnpa/obesity/trend/maps/index.htm
- Image: Center for Disease Control and Prevention. U.S. Obesity Trends, 1985-2007. Available at http://www.cdc.gov/nccdphp/dnpa/obesity/trend/maps/index.htm
- Image: Center for Disease Control and Prevention. U.S. Obesity Trends, 1985-2007. Available at http://www.cdc.gov/nccdphp/dnpa/obesity/trend/maps/index.htm
- Message: We have never had an epidemic like this that we have been able to track so thoroughly and see. About 60 million adults, or 30 percent of the adult population, are now obese, which represents a doubling of the rate since 1980. Image: Center for Disease Control and Prevention. U.S. Obesity Trends, 1985-2007. Available at http://www.cdc.gov/nccdphp/dnpa/obesity/trend/maps/index.htm
- Message: While the data is harder to come by, we’ve seen similar trends in youth overweight rates. Lack of physical activity is a major contributor to the dramatic increase in overweight among children. Less active children are more likely to be overweight.* The percentages of 6-11 and 12-19 year-old kids considered severely overweight have tripled in the last 30 years.** In 2006, over 17 percent of children aged 6 to 11 years old were overweight.*** Diet is certainly a factor as well, and many schools have adopted wellness policies that incorporate Safe Routes to School and healthy eating campaigns. Background: These data show the number of American children in two age groups whose weight is higher than the 95 th percentile of the recommended weight for their height. The medical community doesn’t yet define “obesity” for children (such as a BMI over 30, as it does for adults). *American Academy of Pediatrics (2003). Policy statement on the prevention of pediatric overweight and obesity. Available at http://aappolicy.aappublications.org/cgi/content/full/pediatrics;112/2/424 **Hedley AA, Ogden CL, Johnson CL, Carroll MD, Curtin LR, & Flegal KM. (2004). Prevalence of overweight and obesity among US children, adolescents, and adults, 1999-2002. JAMA, 291(23):2847-50. ***Ogdon, C. L., Carroll, M. D., & Flegal, K. M. High Body Mass Index for Age Among US Children and Adolescents, 2003-6. Journal of the American Medical Association, 299(20), 2401-2405. Overweight is measured as at or above the 95th percentile of the CDC BMI-for-age growth charts. Image: U.S. Centers for Disease Control and Prevention. National Center for Health Statistics. Prevalence of Overweight Among Children and Adolescents: United States, 1999-2002. Available at http://www.cdc.gov/nchs/products/pubs/pubd/hestats/overwght99.htm#Table%201. Accessed January 31, 2006.
- Message Reference Child and Adolescent Health Measurement Initiative. 2003 National Survey of Children's Health, Data Resource Center for Child and Adolescent Health website. Retrieved [mm/dd/yy] from www.nschdata.org . Retrieved October 21st, 2009.
- Message: And research shows that obese children suffer immediate social, emotional and physical health effects and are more likely to be obese adults.* Background: *Institute of Medicine (2005). Preventing childhood obesity: Health in the balance. Available at http://www.nap.edu/books/0309091969/html/. Accessed January 3, 2005 *Centers for Disease Control and Prevention. The Importance of Regular Physical Activity for Children. Available at http://www.cdc.gov/nccdphp/dnpa/kidswalk/health_benefits.htm. Accessed August 11, 2008. *Baker, J.L., Olsen, L.W., & Sorensen, T.I.A. (2007). Childhood Body-Mass Index and the Risk of Coronary Heart Disease in Adulthood. The New England Journal of Medicine, 357(23), 2329-2337. *Freedman, D.S., Khan, L.K., Serdula, M.K., Dietz, W.H., Srinivasan, S.R. & Berenson, G.S. (2005). The Relation of Childhood BMI to Adult Adiposity: The Bogalusa Heart Study. Pediatrics, 115(1), 22-27.
- Message: The fact is that many kids today are not getting the physical activity that they need. Kids today are less active due to many factors, some of which include: they are driven more often to school they are offered less PE or recess during the day* Background: Only 8% of elementary schools and 6% of middle/junior high schools provide daily PE classes, and several schools no longer provide recess for elementary students.* *Brener N, Burstein G, DuShaw M, Vernon M, Wheeler L, Robinson J. (2001). Health services: results from the School Health Policies and Programs Study 2000. Journal of School Health, 71(7), 294-304. Image: Provided by PBIC.
- Message: Children need at least one hour of moderate activity a day, and ideally more.* This recommendation is formally for adolescents; experts in the field simply don’t believe there is enough research available to make specific time recommendations for younger children. However all agree that plentiful regular physical activity is critical to healthy growth and development of children, and physical inactivity has a very adverse affect on children’s long term health and well-being. Background: *US Department of Health and Human Services and Agriculture, 2005. *Strong, W.B., Malina, R.M., Blimke, C.J.R., Daniels, S.R., Dishman, R.K., Gutin, B., Hergenroeder, A.C., Must, A., Nixon, P.A., Pivarnick, J.M., Rowland, T., Tost, S., & Trudeau, F. (2005). Evidence Based Physcial Activity for School-Age Youth. The Journal of Pediatrics, 1(55), 732-737. *National Association for Sport and Physical Education. (2004) Physical Activity for Children: A Statement of Guidelines for Children Ages 5-12. Available at http://www.aahperd.org/naspe/template.cfm?template=pr_123103.html . Accessed July 21, 2008. *Harvard School of Public Health Prevention Research Center. (2006) Youth Nutrition and Physical Activity Guidelines for Out-of-School Time (OST) Programs. Available at http://www.hsph.harvard.edu/prc/proj_YMCA_guidelines_jun06.pdf Accessed July 14, 2008. Image: Fenn Elementary, Gorham, NH provided by John Corrigan
- Message: It is time to focus on the good. Communities are taking action on behalf of their kids. Images: (l) Latham Elementary School, Winston-Salem, NC provided by Mike Cynecki; (r) Century Elementary School, Century, FL provided through www.iwalktoschool.org
- Message: Walk to school programs can be part of the solution to making and walking and biking safer, which can in turn be an ideal strategy to increase physical activity among children and improve air quality. Background: Children who use active transport to school are more physically active and more physically fit than those children who traveled to school by car.* *Cooper, A.R., Wedderkopp, N., Wang, H., Anderson, L.B., Froberg, K., Page, A.S. (2006). Active Travel to School and Cardiovascular Fitness in Danish Children and Adolescents. Medicine and Science in Sports & Exercise, 38(10), 1724-1731. *Cooper, A.R., Anderson, L.B., Wedderkopp, N., Page, A.S., Froberg, K. (2005). Physical Activity Levels of Children Who Walk, Cycle, or Are Driven to School. American Journal of Preventive Medicine, 29(3), 179-184. Image: McAuliffe Elementary, Lenexa, KS provided by Mike Cynecki.
- Message: Each school starts from different conditions: Some schools have great places for walking and bicycling but few students taking advantage of it, as is the case in the left photo. Other communities, like the one on the right, have children walking and biking to school in unsafe conditions or along poorly maintained facilities. Each program involves the whole community. Parents and neighborhood groups, law enforcement officers, community leaders, and transportation and public health professionals help identify the issues. Images: (l) Puente de Hozho Elementary, Flagstaff, AZ provided by Mike Cynecki; (r) Alaska provided by Steve Soenkson.
- Message: While there is no one “right way” to create a SRTS program, let’s look at a process communities have followed for increasing opportunities for safe walking and bicycling to school. This process involves : getting the right people at the table from the beginning gathering information and identifying issues finding solutions developing a plan getting the plan funded then putting it in action an important last step is evaluating and making improvements We will be doing a mini version of this process today.
- Message: Safe Routes to School Programs employ the E’s – engineering, education, enforcement, and encouragement – to help achieve their goals. Evaluation is another element of the SRTS program and is used to identify which strategies are working well and which are not going as planned and why. Image: Kilby Elementary, Woodbridge, VA provided by www.iwalktoschool.org.
- Message: Education programs can have long lasting effects. They teach students how to walk and bicycle safely and inform parents and other drivers how to drive more safely around pedestrians and bicyclists. Image: Champaign Elementary, Champaign, IL provided by www.iwalktoschool.org.
- Message: Encouragement programs are an essential part of most Safe Routes to School programs. Through contests and rewards, programs are making walking and bicycling a popular way to go to school. Image: Dunham Elementary School, Tucson, AZ provided by www.iwalktoschool.org.
- Message: The primary goals of enforcement programs are to increase awareness of laws protecting children walking and bicycling and improve driver behavior (slower speeds, increased yielding to pedestrians). The role of the police officer in the SRTS programs goes beyond enforcement and is often included in all phases of the program. Others are involved in enforcement, too, like parents, schools, crossing guards and student safety patrols. Image: Barnes Elementary, Burlington, VT provided by Mike Cynecki.
- Message: Engineering deals with the built environment and projects that work to create safe places to walk or bike. Image(s): Century Middle School, Thornton, CO provided by Mike Cynecki.
- Message: Evaluation allows programs to track progress over time. The examples shown here are tools used across the country to collect data about SRTS programs. They are available at www.saferoutesinfo.org/resources Images: Provided by National Center for Safe Routes to School, www.saferoutesinfo.org
- Message: Now is the time to make good decisions because many schools will be built or renovated in the next ten years. Student enrollment is growing.* Existing facilities are aging.** With the growing demand for new and renovated facilities, it is important that we make informed decisions to do things correctly the first time and retain schools in neighborhoods where appropriate. Background: *The US Department of Education estimates that the US student enrollment will grow by over 1.7 million between 2000 and 2006. U.S. Department of Education, National Center for Education Statistics. Digest of Education Statistics, 2002 (NCES 2003-060). Available at http://nces.ed.gov/programs/digest/d02/index.asp. **Over half our school facilities are at least 40 years old and the EPA is expecting that $100 to $300 billion will be spent in the next few years to bring these facilities into good teaching condition. U.S. Department of Education, Office of Educational Research and Improvement. (1999). Condition of America’s Public School Facilities. Image: East Chapel Hill High School, Carrboro, NC provided by Austin Brown.
- Message: Congress has established a federal SRTS program that provides $612 million to states for community SRTS projects. $612 million for SRTS over five fiscal years (until 2009). The funds go to State DOTs, who then can decide how to spend them. Eligible activities include infrastructure changes (ie, sidewalks, crosswalks, signs, signals, etc.) and non-infrastructure activities (ie. Education, encouragement, enforcement) for Kindergarten – 8th grade. Each state has a SRTS coordinator whose name can be found at www.saferoutesinfo.org The federal program also calls for a National Clearinghouse, which is called the National Center for Safe Routes to School (which provided this course material). See the National Center web site at www.saferoutesinfo.org for more information. Background : More information available at saferoutesinfo.org In August 2005, federal legislation established a national Safe Routes to School program that dedicates a total of $612 million towards SRTS from 2005 to 2009. Specifically, the federal SRTS program provides funds that can be used for “Planning, design, and construction of infrastructure-related projects that will substantially improve the ability of students to walk and bicycle to school, on any public road or any bicycle or pedestrian pathway or trail within approximately 2 miles of a primary or middle school;” and “non infrastructure-related activities to encourage walking and bicycling to school, including public awareness campaigns and outreach to press and community leaders, traffic education and enforcement, student training, and funding for training, volunteers, and managers of SRTS programs.” The federal SRTS program allows state, regional, and local agencies, as well as nonprofit organizations, to receive funds for SRTS activities. This type of agency will need to be the official applicant for any infrastructure funding requests. Matching funds are not necessary for activities using federal SRTS funds. Image: Provided by Allen Matheson © Photohome.com
- Note to instructor: Iowa's State DOT Safe Routes to School Coordinator is Kathy Ridnour. She was unable to make it today to talk about the State Program, but she has given us some great information to me to tell you all. Her office is in Ames, Iowa and her contact information is on the slide.
- Beginning with the round of projects awarded in January 2009, the funding will not be available until the following October, so that means projects cannot incur any costs for which they want federal reimbursement until after the Federal Highway Administration authorization in October. Construction work would not begin until the following spring. So basically, when an application is submitted in october, it will be about a year and a half before actual construction could begin. Many applicants would probably want to start their project the spring following the fuding award, but that is not possible with the way the federal funding process works.
- These are the projects that have been funded in Iowa with the Safe Routes to School Grants.
- For the next round of funding: - Application deadline is October 1, 2009. - We are hopeful that funding will be available through the new Federal Transportation Bill, but it is not guarenteed. - Application forms are currently under revision but should be back on the web site by March 1, 2009. - The Iowa DOT SRTS web site is www.iowadot.gov/saferoutes
- Iowa Safe Routes to School has published a few items this past year. First the “Iowa Kids on the Move: Bicycle and Pedestrian Safety Curriculum”, available since August 2009. and Second the “Iowa Safe Routes to School Encouragement Guide”, which is finished just not yet published. The curriculum is available to download individual lesson programs individually or as an enitre document in PDF or Microsoft Office format on our website: - www.iowasaferoutes.org It is also available for ordering a published copy at the Iowa DOT's website, along with other safety education items (spoke sliders, stickers, bookmarks, magnets, safety cards, videos,...) at -www.iowadot.gov/iowabikes/freebies.htm
- The Curriculum has lesson programs that hit on all the benefits and safety education of walking and bicycling including Environmentaland Health Benefits and Where and How to walk and bike safely. They are easy to use and each lesson is specific to grade, subject, and time.
- Iowa Safe Routes to School program uses the National Center for Safe Routes to School Workshops. The Iowa Bicycle Coalition has been hired by the Iowa DOT SRTS program to do the Encouragement and Education portion. Under that umbrella we (Mark and I) perform these workshops for the State of Iowa for FREE! We offer the Full Day, Half Day, and 1-Hour Customizable workshops. Both Mark and I are trained in the National Center's Course.
- The Full Day Workshops entail: Picture-rich presentation regarding the five E’s Hands-on sessions to ID problems & solutions. Walk-about assessment Observation of a school dismissal. Create an Action Plan
- The Half Day Workshops include -: Picture-rich presentation regarding the five E’s -Hands-on sessions -Create an Action Plan for the local SRTS task force With no observation of school dismissal and grounds. The One Hour Customizable Workshop -Customize any part of the full workshop with information about any of the five E’s to best fit your school or community needs.
- Contact myself (Molly Gable) for questions or to schedule a workshop. On the slide is my contact info, the Iowa Bicycle Coalition Safe Routes to School Website and the Education and Encouragement Freebies order website.
- Message: Communities are starting to turn it around. You will hear many success stories as we go through the course, but let’s go ahead take a look at a few here. Images: (lt) Liberty City Elementary, Miami, FL provided by www.iwalktoschool.org, (r) MacKinnon Middle and Duffy Elementary Schools, Wharton Borough, NJ provided by www.saferoutesinfo.org.
- Message: At Rosewood Elementary School in Columbia, SC, a parent (who was also a teacher at the school) noticed on her morning walks to school with her daughter that cars were driving too fast in front of the school. Almost weekly, the teacher saw cars running the red light at one of the school’s main intersections. Wanting to slow down traffic, the parent sent out a request for ideas to parents and faculty members. She learned of the South Carolina SRTS program, applied and received funding from the SC Department of Transportation. She then formed a committee including parents, teachers, school administration and the school nurse to form a plan and conduct activities. Currently, Rosewood offers: pedestrian and bicycle safety messages to both parents and students via take home flyers and PA announcements encouragement programs such as Walk to school day and a Walking Fridays (a Walking School Bus program) stepped up law enforcement during school arrival and dismissal With support from a DOT traffic engineer, the committee also developed a plan to improve sidewalks, crosswalks, and signage, and researched ways to improve conflicts during school pick up and drop off. RESULTS: Based on parent reports, the law enforcement patrols and the media attention surrounding the program has resulted in slowed traffic around the school. Parents also report that while driving, they are more aware of pedestrians and bicyclists. Background: For more information, visit http://www.saferoutesinfo.org/online_library/details.cfm?id=4114 Images: Rosewood Elementary School, Columbia, SC provided by Rob Thompson/SCDOT.
- Message: After learning about safe routes to school through the Mayor’s Wellness Campaign, the Garfield Health Department in Garfield, NJ established a comprehensive SRTS program that improved the quality of life for both students and community members. A SRTS committee was formed, and included employees of the Garfield Health Department, Active Living Resource Center, community residents, teachers, principals and law enforcement officers. They help implement SRTS at eight elementary and middle schools. The program includes: a SRTS curriculum focusing on pedestrian and bicycle safety and encouraging physical activity student feedback on neighborhood walking conditions. Children were given digital cameras to document the conditions on their walk to and from school. These pictures were then given to city engineers to help them understand and prioritize infrastructure improvements. Based on information the students provided, the city created route maps and distributed them to all students. Walk to School Day on Halloween. Students are encouraged to walk in their costumes. RESULTS: As a result of their program, safety education has been integrated into the classroom, children are excited about walking and bicycling to school, and the process inspired the community to pursue funding to build a new family exercise path. In 2007, Garfield received funding from the NY Giants football team and United Way’s Hometown Huddle to construct the path. Background: For more details, visit http://www.saferoutesinfo.org/online_library/results.cfm?k=garfield&=Search Image: PS #7, Garfield, NJ provided by Leigh Ann Von Hagen. ALRC City SRTS Walk Audit with PS #7 students, teachers and the Vice Mayor (black shirt).
- Message: Farmington, NH is a close-kit rural community with almost 7,000 residents. Two schools in town, Valley View Community School and Henry Wilson Memorial School serve approximately 975 students in kindergarten through eighth grade. Some of the parents expressed concern that many of the neighborhoods did not have the necessary sidewalks and crosswalks to provide children with safe walking and bicycling routes to school. In response to these concerns, law enforcement officers and school personnel designed a SRTS program. They received a grant from the State of New Hampshire in 2004 and constructed the “Tiger Trail,” a path marked with paw prints and signs that connects the neighborhoods to elementary schools. Additional program features include a school resource officer who provides safety education at school assemblies, a walking school bus, and annual student travel tallies and parent surveys. RESULTS: Since the construction of the Tiger Trail, program leaders have noticed increasing numbers of children walking to school. Parents enjoy the trail because it addresses many of their safety concerns while allowing the children the opportunity to be outside. Background: For more information, visit http://www.saferoutesinfo.org/online_library/details.cfm?id=4061 Images: Farmington, NH provided by John Corrigan
- Message: Manly, Iowa has an after-school park and walk program twice a week. Local community members meet the children outside after school and walk the children to a local church. At the church, parents can come and pick up their child and they provide a short daycare service.
- Message: The goal of SRTS programs are to get more kids walking and bicycling where it is safe and to fix conditions where it is not safe. The opportunity to bike and walk to school offers a solution to an array of concerns about traffic safety, traffic congestion, transportation costs, air pollution and lack of physical activity. At the same time, walking and bicycling to school provides an opportunity for children to build independence. Our goals are based on making that solution into a reality. Images: (t) Scituate, MA provided by Mark Fenton; (b) Metz Elementary, Austin, TX provided by Mike Cynecki.
- Message: The National Center for Safe Routes to School, which maintains this course material, has a web page with tools to help communities plan and implement SRTS programs. You will find much of the data that we will cover today as well as current news, new program strategies, and contacts in your area. Image: Provided by www.saferoutesinfo.org
- Message: In addition, there are many downloadable, ready-to-use resources, such as draft press releases, fliers, talking points, and tools like data collection forms. Thank you for taking the time to get the big picture on Safe Routes to School. Now let’s talk about the specific strategies. (lead in to other course modules) Image: Provided by www.saferoutesinfo.org/