SlideShare uma empresa Scribd logo
1 de 14
Is there a clear relationship between credit growth and market growth?
The fastest growing cities out of 112
Growth rates
(CAGR)
Market Size
Growth
Rate
Deposit
Growth Rate
Credit Growth
Rate
Silvassa 23 14 71
Gandhinagar 22 10 54
Bokaro 19 7 -4
Surat 17 11 18
Thiruvallur 17 11 28
Agartala 16 13 32
Chandigarh 16 13 7
Thanjavur 16 5 20
Kohima 15 9 26
Noida 15 28 43
The slowest growing cities out of 112
Growth rates
(CAGR)
Market Size
Growth
Rate
Deposit
Growth Rate
Credit Growth
Rate
Guntur 8 7 16
Gwalior 8 6 9
Jabalpur 8 3 0
Nellore 8 7 22
Varanasi 8 6 13
Kanpur 7 7 13
Kavaratti 7
Vijayawada 7 7 24
Dhanbad 6 12 15
Kancheepuram 2 16 22
With the exception of Bokaro, and to a certain extent Chandigarh, the 10 fastest growing cities grew
on the back of high credit growth. However, this is not a general rule as a look at the slower growing
cities reveal. Cities such as Vijaywada, Kancheepuram, Nellore and Guntur did not display a robust
growth in spite of high credit growth. Deposit growth, on the other hand is an effect of market growth
and in general grows in the wake of market growth. This is generally borne out by the facts, though a
few notable exceptions exist – Thanjavur, Kohima, Bokaro (among the fast growing cities) and
Dhanbad and Kancheepuram (slow growing cities)
Insights into the Financial landscape of the country
Indian Financial Scape provides insights into the financial landscape of the country. It
presents nearly 250 different variables at district level. The product helps enhance a
professional’s understanding of the markets. A few samples of unusual insights are
presented below. There are many more interesting ones available in the product.
Fastest growing districts in terms of Personal Loans (Personal loans, as defined by
RBI includes all loans taken by individuals – secured and unsecured)
Unit %
Year
2001-02 to
2007-08
Personal loans
- growth rate of
SCB`s credit
State District
Karnataka Bangalore Rural 77
Meghalaya West Garo Hills 74
Arunachal Pradesh Changlang 72
Arunachal Pradesh East Siang 72
Arunachal Pradesh Papum Pare 72
Arunachal Pradesh West Kameng 72
Bihar Katihar 72
Uttar Pradesh Sant Kabir Nagar 71
Haryana Jhajjar 70
Assam Hailakandi 69
Gujarat Narmada 69
Haryana Panipat 68
Haryana Rohtak 67
Haryana Sonipat 67
Haryana Faridabad 62
Jammu & Kashmir Pulwama 62
Mizoram Champhai 60
Bihar Araria 57
Chhattisgarh Rajnandgaon 57
Uttar Pradesh Baghpat 56
Arunachal Pradesh is an unusual place. Not much is known about it and it has a small
base. Yet, on a sustained basis, over a 6 year period, four of its districts have figured
among the top 6 districts in India in terms of growth in personal credit. Haryana is
another place which has seen a boom with four of its districts figuring in the top 15.
Fastest growing districts in terms of Professional and other Services credit
Unit % %
Year
2001-02 to
2007-08
2001-02 to
2007-08
Professional &
other Services -
growth rate of
SCB`s credit
Personal
loans -
growth rate of
SCB`s credit
State District
Gujarat Rajkot 51 26
Chhattisgarh Korba 47 34
Punjab Bathinda 47 50
Andhra Pradesh Krishna 46 18
Rajasthan Ajmer 46 31
Rajasthan Kota 44 25
Madhya Pradesh Katni 44 12
Chhattisgarh Kanker 44 34
Rajasthan Ganganagar 43 31
Sikkim South Sikkim 42 26
Sikkim North Sikkim 42 53
Arunachal Pradesh Lohit 42 -16
Rajasthan Jodhpur 42 36
West Bengal Haora 42 17
Sikkim East Sikkim 42 16
Rajasthan Sikar 41 51
Orissa Sambalpur 41 34
Haryana Rewari 40 -11
Andhra Pradesh Nalgonda 40 21
Haryana Mahendragarh 40 33
The growth in credit in this category has been much lower than in the personal credit
category. The districts that have grown fastest are those that are not in the top pecking
order, yet they are not very small either. Lohit, in Arunachal Pradesh is unusual
because it shows a negative growth in personal credit. Its possible that personal credit
were routed through Professional credit in reality. Rewari is another standout – high
growth in Professional combining with a negative growth in personal credit.
Fastest growing districts in terms of Trade Credit
Unit %
Year
2001-02 to
2007-08
Trade Credit -
growth rate of
SCB`s credit
State District
Tamil nadu Nagapattinam 49
Chhattisgarh Rajnandgaon 47
Meghalaya Jaintia Hills 44
Haryana Jhajjar 40
Karnataka Bangalore Rural 40
Uttar Pradesh Mahoba 40
Gujarat Kheda 39
Orissa Ganjam 39
Haryana Gurgaon 38
Himachal Pradesh Kinnaur 38
Uttar Pradesh
Gautam Buddha
Nagar 38
Sikkim East Sikkim 37
Jammu & Kashmir Leh (Ladakh) 37
Bihar Madhubani 37
Arunachal Pradesh West Kameng 36
Uttaranchal Rudraprayag 35
West Bengal Medinipur 35
Andhra Pradesh Medak 35
Haryana Panchkula 34
Nagaland Mon 34
Economic Risk
The Economic Risk Index is an important variable to consider while doing business. In case of
financial products, it is important for marketers to consider the risks involved in addition to
market size, growth and demography. Indian Financial Scape is a product which has
introduced an Economic Risk index and rated districts based on variables such as
economic offences, credit penetration, and credit overdue per credit of district central
cooperative banks, Gross domestic product, GDP Growth, No. of Industrial Disputes (All
strikes & Lockouts) and Maydays Lost Due to Industrial, Disputes per worker..
The top ranking districts in terms of economic risk
State District
Dadra & Nagar Haveli Dadra & Nagar Haveli
Daman & Diu Daman
Daman & Diu Diu
Lakshadweep Lakshadweep
Madhya Pradesh Neemuch
Madhya Pradesh Jhabua
Rajasthan Ganganagar
Himachal Pradesh Kinnaur
Madhya Pradesh Shajapur
Madhya Pradesh Satna
The worst districts in terms of economic risk
State District
Pondicherry Mahe
Pondicherry Yanam
Pondicherry Pondicherry
West Bengal Kolkata
West Bengal Koch Bihar
West Bengal North 24 Parganas
West Bengal South 24 Parganas
Jharkhand Dumka
Arunachal Pradesh Tirap
West Bengal Puruliya
How are some of the top business centres ranked (out of nearly 600 districts of India)?
District Rank
Hyderabad 177
Delhi 104
Ahmadabad 35
Surat 33
Bangalore 110
Mumbai 72
Mumbai (Suburban) 70
Pune 74
Chennai 111
Coimbatore 112
Kolkata 581
Most of the major centres are ranked within the top 30%. However, there are wide
differences. The Western region (Mumbai, Ahmadabad, etc.) are clearly the safest. Kolkata
stands out with a very poor ranking.
Demand for Housing
The Housing Skyline of India estimates the demand for housing units in the top 30 cities to
grow by 6.36 million units during the next 7 years leading up to 2015. The current stock of
housing units in these 30 cities is estimated to be 25 million units, which implies a growth in
housing stock of over 25% within 7 years.
Demand between 2008 and 2015
Total Demand
for Housing
Demand for
Plinth Area Less
than 500 Sq ft
Demand for
Plinth Area
Between 500-
1000 Sq ft
Demand for
Plinth Area More
than 1000 Sq ft
Top 10 cities
(alpha) 3,548,000 1,212,000
1,151,00
0
1,186,0
00
Next 20 cities
(beta) 2,815,000 930,000
921,00
0
965,0
00
Top 30 cities
(alpha + beta) 6,363,000 2,142,000
2,072,00
0
2,151,0
00
Current Stock
Current Housing
Stock
Current Housing
Stock - Plinth
Area Less than
500 Sq ft
Current Housing
Stock - Plinth
Area Between
500-1000 Sq ft
Current Housing
Stock - Plinth
Area More than
1000 Sq ft
Top 10 14,624,000 5,829,000
4,337,00
0
4,458,0
00
Next 20 10,413,000 4,179,000
3,145,00
0
3,089,0
00
Top 30 25,037,000 10,008,000 7,482,000 7,547,000
Whereas most of the attention of the building industry is on the upper segment, it is middle
and lower middle India which is driving demand -
• The demand for housing of size less than 1000 sq ft is 4.2 million units over 7 years,
which is 2/3rd
of the demand
• The anticipated growth in percentage terms in the lower segments (24% combined)
is only marginally lower than the upper segment (28.5%)
• The pattern is similar for the alpha (top 10) and beta (the next 20) cities, implying a
uniform demand for affordable housing.
The above pattern indicates that a renewed focus on affordable housing is in order. There is
plenty of demand out there; supply is more likely to be the constraint.
Alpha cities are - Hyderabad, Delhi, Ahmadabad, Surat, Bangalore, Mumbai, Pune, Chennai,
Coimbatore, Kolkata
Beta cities are – Asansol, Bhopal, Faridabad, Indore, Jaipur, Jamshedpur, Kancheepuram,
Kanniyakumari, Kanpur, Kochi, Lucknow, Ludhiana, Madurai, Nagpur, Patna, Salem,
Thiruvallur, Urban Areas in North 24 Parganas, Urban Areas in Thane, Vadodara
The estimation process involved the following steps:
• Demographic parameters such as population across age-groups, change in
household sizes, and family structures were estimated using data from census and
various large scale data surveys.
• This data was used with large scale survey data on housing conditions (NSSO 49th
and 58th rounds) to establish the relationship between housing demand and
demographic parameters.
• Independently the relationship between ownership and income was established.
Estimates of current income and growth from “The Market Skyline of India” were used
to estimate households across income levels for the two time periods.
• One of the major drivers of housing demand is the current and future rental markets.
This in turn is driven by growth in economy, employment and migration trends.
Estimates of GDP, employment growth and migration were used from “The District
Level GDP 2006-07” to define the relationship with housing demand.
• Another relationship established was the ease and extent of availability of finance and
housing demand. Data from RBI on housing loans for the last ten years were used to
determine the function.
• All these aspects were then combined to estimate the net demand in housing during
the period 2008-15. They were also used to determine the demand for housing
across various segments including income categories, plinth area, room size, etc.
• The entire exercise was validated at various stages using a primary survey of
households on income, demography, financial habits and housing conditions
conducted in July 2008. Secondary data such as housing stock estimates from NHB,
proposed construction data from various housing boards, etc. were also used to cross
check estimates at various intermediate steps.
Financial Asset Penetration
On an average, only 16% of Indian households have taken loans from institutional agencies.
On the other hand, 22% of the households have taken loans from non institutional agencies.
There are two clear indications here – a) the bulk of the population is financially underserved
and rely on informal lending and b) the non institutional agencies have together achieved a
much higher penetration than the institutional agencies.
If we look at another indicator of financial inclusion, namely percentage of households who
hold stocks and debentures, we find that the penetration is just 5%.
There is no doubt that financial inclusion is extremely poor and financial institutions need to
focus more on expanding the market rather than flog the existing markets.
Here are the top districts in terms of penetration of institutional loans. These districts have
penetrations ranging from 37% to 68%. As many as 14 of these 20 are from Kerala. The
districts are Kottayam, Kannur, Idukki, Ernakulam, Pathanamthitta, Kasaragod, Wayanad,
Palakkad, Kollam, Thrissur, Kozhikode, Malappuram, Alappuzha and Thiruvananthapuram
from Kerala and Mahe, Udupi, Satara, Kolhapur, Wardha, Shajapur (MP).
The bottom twenty districts (all less than 1% penetration) are mainly from the hill districts
(Arunachal Pradesh, Manipur, Mehghalaya and J&K - Changlang, East Kameng, Lohit,
Lower Subansiri, Tirap, Dhubri, Kupwara, Bishnupur, Chandel, Churachandpur, Senapati,
Tamenglong, Thoubal, Ukhrul, East Garo Hills, Jaintia Hills, Ri Bhoi, South Garo Hills, West
Garo Hills
The picture changes substantially when one looks at the penetration of non institutional
loans. The top 24 districts have penetration ranging from 50-53%. These are - Tiruchirappalli,
Nagapattinam, Thiruvarur, Thanjavur, Karur, Pudukkottai and Perambalur from Tamil Nadu,
Mahe, Karaikal, Pondicherry, Yanam from Pondicherry, and Prakasam, Srikakulam, West
Godavari, Krishna, Nellore, Guntur, Visakhapatnam, Vizianagaram, East Godavari, Chittoor,
Cuddapah, Anantapur and Kurnool from Andhra Pradesh indicating a clear geographic
pattern.
The bottom districts are again from the hill states. In fact of the bottom 64 (up to 7%
penetration) - 2 are from Andaman and Nicobar, 13 are from Arunachal, 14 are from J&K, 7
from Meghalaya, 8 from Mizoram, 4 from Sikkim, 13 from Uttaranchal, and 3 from West
Bengal.
At a broader level there is a clear need for enhanced services in the hill states. However,
even among the relatively well off districts, it is interesting to note that TN and Andhra seem
to have a very high penetration of non institutional loans as compared to institutional loans –
clearly an area for capturing the low hanging fruits for the formal sector.
How many people invest in stocks and shares?
We all know that penetration of shares and debentures is extremely low in India. Just how
low is it? The various data thrown around suggest around 30 million demat accounts. This
however does not account for multiple accounts of investors.
In our product, Indian Financial Scape, we have estimated the number of households (not
individuals) who own shares and debentures at district level. This is based on large scale
household surveys at various points in time conducted by Census of India, NSSO, and
others.
Some of the top line results are as follows:
• Less than 5% of the households, about 12 million in number own shares and
debentures (note: this can translate into anywhere between 20-25 million individuals
and 30-40 million demat accounts)
• Region wise the penetration of shares and debentures (% of households) are – West
5.25%, North 4.52%, South 8.17%, and East 3.2%.
• West is dragged down by Rajasthan (3.6%) and MP (3.2%). The other states in the
West are Maharashtra (8.4%), Gujarat (6.1%) and the combined Goa, Daman and
Diu, Dadra Nagar Haveli (8.2%)
• At state level, the highest penetrations are in:
Delhi Kerala Karnataka Maharashtra
Goa,
Daman,
Dadra
Tamil
Nadu Punjab Haryana
13.00 10.50 8.96 8.37 8.20 7.97 7.00 6.95
• The leading districts in terms of penetration are:
Maharashtra Karnataka Maharashtra Maharashtra Haryana
Mumbai Udupi
Mumbai
(Suburban) Thane Panchkula
27 24 23 20 19
Chandigarh
West
Bengal Goa Karnataka Kerala
Chandigarh Kolkata North Goa Bangalore Ernakulam
19 19 18 18 18
Kerala
Tamil
Nadu Maharashtra Karnataka Karnataka
Thrissur Chennai Kolhapur
Dakshina
Kannada Dharwad
18 18 17 17 17
Andhra
Pradesh Karnataka Kerala Gujarat
Madhya
Pradesh
Hyderabad
Uttara
Kannada Kottayam Ahmadabad Indore
15 15 15 14 14
• The bottom 41 districts in terms of penetration are all from the East
• The bottom 249 districts (42% of the districts) are from the East, hill states or MP,
Rajasthan and UP. In fact, if we ignore the backward areas of Vidarbha and
Panchmahals, then we actually see that the bottom 50% (about 290 districts) are all
from the East, hill states or MP, Rajasthan and UP, clearly indicating an East-West
divide in penetration.
Housing Stock and Demand
The Housing Skyline of India estimates the demand for housing units in the top 112 cities to
be 10.5 million units during the next 7 years leading up to 2015. The current stock of housing
units in these cities is estimated to be 41.8 million units, which implies a growth in housing
stock of over 25% within 7 years
Of these 112, the top 30 cities will account for 60% of the demand and are expected to add
6.36 million units during the next 7. The current stock of housing units in these 30 cities is
estimated to be 25 million units.
The top 112 Cities
Figures in
millions
Households with Plinth Area Less than 500 Sq ft 17.0
Households with Plinth Area Between 500-1000 Sq ft 12.5
Households with Plinth Area More than 1000 Sq ft 12.3
Demand for units (2008-2015) for Plinth Area Less than 500 Sq ft 3.5
Demand for units (2008-2015) for Plinth Area Between 500-1000
Sq ft 3.4
Demand for units (2008-2015) for Plinth Area More than 1000 Sq ft 3.7
The top 30 Cities
Figures in
millions
Households with Plinth Area Less than 500 Sq ft 10.01
Households with Plinth Area Between 500-1000 Sq ft 7.48
Households with Plinth Area More than 1000 Sq ft 7.55
Current stock of houses
with plinth area > 1000 sq
feet (figures in ‘000s)
Demand for units (2008-2015) for Plinth Area Less than 500 Sq ft 2.14
Demand for units (2008-2015) for Plinth Area Between 500-1000
Sq ft 2.07
Demand for units (2008-2015) for Plinth Area More than 1000 Sq ft 2.15
Whereas most of the attention of the building industry is on the upper segment, it is middle
and lower middle India which is driving demand -
• The demand for housing of size less than 1000 sq ft is 6.2 million units over 7 years,
which is 2/3rd
of the demand
• The anticipated growth in percentage terms in the lower segments (23% combined)
is lower than the upper segment (30%), but on a base which is nearly two and a half
times.
• The pattern is similar for the alpha (top 10) and beta (the next 20) cities, implying a
uniform demand for affordable housing.
The above pattern indicates that a renewed focus on affordable housing is in order. There is
plenty of demand out there; supply is more likely to be the constraint.
Demography – Age profile of the top 112 cities of India
The age profile of the top 112 cities (which account for a population of 200 million) does not
show too much variation. 69% are between the age of 18 and 60 and the proportions do not
vary much across different cities. The proportion of the aged in the larger cities is higher but
only marginally.
In sheer numbers, about 36 million people in the top 112 cities are above 60 years of age
and the alpha cities account for 35% of them. The under 18 population is significantly smaller
at about 26 million
under 18
years 18-35 years 35-60 years > 60 years
Alpha (top 10) 12.4% 34.3% 34.7% 18.6%
Beta (11th to 30th) 13.0% 34.7% 34.2% 18.1%
Gamma (31st to
50th) 14.1% 35.9% 32.7% 17.3%
Delta (51st to 112th) 14.3% 36.7% 31.6% 17.3%
Total (112 cities) 13.3% 35.3% 33.5% 17.9%
under 18
years 18-35 years 35-60 years > 60 years
Alpha (top 10) 8,306,888 23,052,698 23,318,890 12,456,128
Beta (11th to 30th) 6,714,661 17,926,723 17,642,448 9,352,400
Gamma (31st to
50th) 4,390,776 11,161,258 10,161,636 5,388,436
Delta (51st to 112th) 7,211,062 18,473,936 15,894,690 8,708,917
Total (112 cities) 26,623,387 70,614,615 67,017,664 35,905,881
8,306,888 6,714,661 4,390,776
7,211,062
23,052,698
17,926,723
11,161,258
18,473,936
23,318,890
17,642,448
10,161,636
15,894,690
12,456,128
9,352,400
5,388,436
8,708,917
Alpha (top 10) Beta (11th to 30th) Gamma (31st to 50th) Delta (51st to 112th)
under 18 years 18-35 years 35-60 years > 60 years
12.4% 13.0% 14.1% 14.3%
34.3% 34.7% 35.9% 36.7%
34.7% 34.2% 32.7% 31.6%
18.6% 18.1% 17.3% 17.3%
Alpha (top 10) Beta (11th to 30th) Gamma (31st to 50th) Delta (51st to 112th)
under 18 years 18-35 years 35-60 years > 60 years
Income and Savings in Urban India
The top 112 cities account for about 200 million Indians which is more than 60% of urban India. These
cities constitute a market of consumers whose combined annual incomes are Rs 13.26 billion. Their
combined savings are Rs 3.5 billion which is about 26.5% of income. However there is considerable
heterogeneity in the income and savings pattern across these cities.
If we look at four classes of cities (by size), we get the following picture:
Total Income (Rs
billions)
Total Savings
(Rs billions)
Savings/
Income Ratio
Alpha (Top 10) 5,912 1,296 21.9%
Beta (11th to 30th) 2,887 931 32.2%
Gamma (31st to 50th) 1,774 519 29.3%
Delta (The balance 62) 2,688 771 28.7%
Top 112 cities 13,261 3,516 26.5%
The large cities have a significantly lower savings rate. The top 10 cities have a savings rate of under
22%, whereas the gamma and delta cities (82 in number) have savings rate around 29%. Clearly the
EMI culture hasn’t percolated down to too many cities in India. An interesting piece of statistics is that
the 2nd
rung of cities are the biggest savers – the beta cities save as much as 32% of their income and
reinforce the old adage that savings and investment are the route to growth.
If we look at the same set of data through the regional prism, we get the following picture:
Total Income (Rs
billions)
Total Savings
(Rs billions)
Savings/
Income Ratio
East 2,011 522 25.9%
West 5,167 1,191 23.0%
North 2,849 797 28.0%
South 3,233 1,007 31.1%
The Southerners are by far the largest savers with a savings rate of over 31%. The West (it includes
Rajasthan and MP) has the lowest savings rate of just 23%. Within West, Gujarat is a high saver with
27% savings rate whereas Maharashtra saves only 18%. Madhya Pradesh is a very high saver with
savings rate of 38%.
Contrary to popular wisdom, the North is not exactly spendthrift, they are second only to the South in
savings rate.
What do the figures look like for some of the major cities?
Total Income (Rs
billions)
Total Savings
(Rs billions)
Savings/
Income Ratio
Mumbai 1,608 216 13.4%
Delhi 1,264 289 22.8%
Bangalore 602 192 31.9%
Urban Areas in Thane 569 132 23.2%
Pune 446 111 24.9%
Ahmadabad 429 109 25.3%
Chennai 393 88 22.2%
Kolkata 350 68 19.3%
Surat 318 82 25.8%
Hyderabad 295 87 29.3%
Mumbai has the lowest savings rate. Delhi, Kolkata and Mumbai’s neighbours are also low savers.
Bangalore and Hyderabad are high savers, much higher than average.
The heterogeneity of India is well reflected in the savings patterns. There are no clear regional patterns.
However, it is evident that the economically vibrant cities are lower in savings rate as compared to their
regional brethrens which reinforces the theory that consumerism is one of the key pivots of the recent
surge in economic growth and erosion in consumer confidence will impact economic growth negatively.

Mais conteúdo relacionado

Mais procurados

Impact of Demonetization on the Indian Economy and its People
Impact of Demonetization on the Indian Economy and its PeopleImpact of Demonetization on the Indian Economy and its People
Impact of Demonetization on the Indian Economy and its PeopleIRJET Journal
 
Finalaya market commentary daily wrap 6 feb 2014
Finalaya market commentary daily wrap 6 feb 2014Finalaya market commentary daily wrap 6 feb 2014
Finalaya market commentary daily wrap 6 feb 2014Investors Empowered
 
Project Remonetisation In India
Project Remonetisation In IndiaProject Remonetisation In India
Project Remonetisation In IndiaShantanu Basu
 
Presentation on Demonetization effect on Rural area
Presentation on Demonetization effect on Rural areaPresentation on Demonetization effect on Rural area
Presentation on Demonetization effect on Rural areaSayantan Roychoudhury
 
Demonitization-Impact on various sectors in India
Demonitization-Impact on various sectors in IndiaDemonitization-Impact on various sectors in India
Demonitization-Impact on various sectors in IndiaDeepak Bhadouriya
 
impact of demonetization.Shivanandppt.pptx1803sims
impact of demonetization.Shivanandppt.pptx1803simsimpact of demonetization.Shivanandppt.pptx1803sims
impact of demonetization.Shivanandppt.pptx1803simsShivanand Rai
 
Reforms in banking sector after demonitisation
Reforms in banking sector after demonitisationReforms in banking sector after demonitisation
Reforms in banking sector after demonitisationVikas Singh
 
Demonetization
DemonetizationDemonetization
DemonetizationKetan Vira
 
Demonetisation journey of black turning white
Demonetisation journey of black turning whiteDemonetisation journey of black turning white
Demonetisation journey of black turning whiteAkshay Kumar Sethia
 

Mais procurados (20)

Demonetization Intent, secret, myth, math and politics behind demonetizatio...
Demonetization   Intent, secret, myth, math and politics behind demonetizatio...Demonetization   Intent, secret, myth, math and politics behind demonetizatio...
Demonetization Intent, secret, myth, math and politics behind demonetizatio...
 
How and why to move towards cashless economy after demonetization
How and why to move towards cashless economy after demonetizationHow and why to move towards cashless economy after demonetization
How and why to move towards cashless economy after demonetization
 
Impact of Demonetization on the Indian Economy and its People
Impact of Demonetization on the Indian Economy and its PeopleImpact of Demonetization on the Indian Economy and its People
Impact of Demonetization on the Indian Economy and its People
 
Equity Research Report 21 November 2016 Ways2Capital
Equity Research Report 21 November 2016 Ways2CapitalEquity Research Report 21 November 2016 Ways2Capital
Equity Research Report 21 November 2016 Ways2Capital
 
Final mc-edited-1
Final mc-edited-1Final mc-edited-1
Final mc-edited-1
 
India Demonitization Nov 2016- PROS & CONS
India Demonitization Nov 2016- PROS & CONSIndia Demonitization Nov 2016- PROS & CONS
India Demonitization Nov 2016- PROS & CONS
 
DB5968
DB5968DB5968
DB5968
 
Finalaya market commentary daily wrap 6 feb 2014
Finalaya market commentary daily wrap 6 feb 2014Finalaya market commentary daily wrap 6 feb 2014
Finalaya market commentary daily wrap 6 feb 2014
 
Demonetisation
DemonetisationDemonetisation
Demonetisation
 
Project Slides
Project SlidesProject Slides
Project Slides
 
Project Remonetisation In India
Project Remonetisation In IndiaProject Remonetisation In India
Project Remonetisation In India
 
Presentation on Demonetization effect on Rural area
Presentation on Demonetization effect on Rural areaPresentation on Demonetization effect on Rural area
Presentation on Demonetization effect on Rural area
 
Demonitization-Impact on various sectors in India
Demonitization-Impact on various sectors in IndiaDemonitization-Impact on various sectors in India
Demonitization-Impact on various sectors in India
 
impact of demonetization.Shivanandppt.pptx1803sims
impact of demonetization.Shivanandppt.pptx1803simsimpact of demonetization.Shivanandppt.pptx1803sims
impact of demonetization.Shivanandppt.pptx1803sims
 
Reforms in banking sector after demonitisation
Reforms in banking sector after demonitisationReforms in banking sector after demonitisation
Reforms in banking sector after demonitisation
 
Demonetization
DemonetizationDemonetization
Demonetization
 
Demonetisation journey of black turning white
Demonetisation journey of black turning whiteDemonetisation journey of black turning white
Demonetisation journey of black turning white
 
Finalaya daily wrap_07nov2013
Finalaya daily wrap_07nov2013Finalaya daily wrap_07nov2013
Finalaya daily wrap_07nov2013
 
Demonetisation
DemonetisationDemonetisation
Demonetisation
 
Demonetization
DemonetizationDemonetization
Demonetization
 

Destaque

Informe: Movilidad económica y crecimiento clase media en América Latina - Ba...
Informe: Movilidad económica y crecimiento clase media en América Latina - Ba...Informe: Movilidad económica y crecimiento clase media en América Latina - Ba...
Informe: Movilidad económica y crecimiento clase media en América Latina - Ba...Foro Blog
 
Célula, transporte y reinos
Célula, transporte y reinosCélula, transporte y reinos
Célula, transporte y reinosOscar
 
Zb classificados março 2012 configuração 260 x 297
Zb classificados março 2012 configuração 260 x 297Zb classificados março 2012 configuração 260 x 297
Zb classificados março 2012 configuração 260 x 297paulo maia
 
Fiam catalogo home office-2010
Fiam catalogo home office-2010Fiam catalogo home office-2010
Fiam catalogo home office-2010Arredi Lanzini
 
Internet Media Scene Tunisia 09
Internet  Media  Scene  Tunisia 09Internet  Media  Scene  Tunisia 09
Internet Media Scene Tunisia 09FADERCO
 
Cópia de escultura gotico renascença e barroco
Cópia de escultura gotico renascença e barrocoCópia de escultura gotico renascença e barroco
Cópia de escultura gotico renascença e barrocofernandodiasnet
 
Fernandinho - Mil Cairão Versão 1
Fernandinho - Mil Cairão Versão 1Fernandinho - Mil Cairão Versão 1
Fernandinho - Mil Cairão Versão 1Willian Carvalho
 
Português prova o rato do campo e da cidade
Português   prova o rato do campo e da cidadePortuguês   prova o rato do campo e da cidade
Português prova o rato do campo e da cidadeWillian Carvalho
 
Formação de utilizadores
Formação de utilizadoresFormação de utilizadores
Formação de utilizadorespoletef
 

Destaque (20)

Insights From Indicus Products 1
Insights From Indicus Products 1Insights From Indicus Products 1
Insights From Indicus Products 1
 
Delhi 2050
Delhi 2050Delhi 2050
Delhi 2050
 
Jharkand Development Report 2009
Jharkand Development Report 2009Jharkand Development Report 2009
Jharkand Development Report 2009
 
Informe: Movilidad económica y crecimiento clase media en América Latina - Ba...
Informe: Movilidad económica y crecimiento clase media en América Latina - Ba...Informe: Movilidad económica y crecimiento clase media en América Latina - Ba...
Informe: Movilidad económica y crecimiento clase media en América Latina - Ba...
 
Yafo
Yafo Yafo
Yafo
 
Ckd Portfolio
Ckd PortfolioCkd Portfolio
Ckd Portfolio
 
Célula, transporte y reinos
Célula, transporte y reinosCélula, transporte y reinos
Célula, transporte y reinos
 
Logotipo Silivia
Logotipo SiliviaLogotipo Silivia
Logotipo Silivia
 
Mikrotik qos
Mikrotik qosMikrotik qos
Mikrotik qos
 
animations
animationsanimations
animations
 
Zb classificados março 2012 configuração 260 x 297
Zb classificados março 2012 configuração 260 x 297Zb classificados março 2012 configuração 260 x 297
Zb classificados março 2012 configuração 260 x 297
 
Island vulkan-2
Island vulkan-2Island vulkan-2
Island vulkan-2
 
Fiam catalogo home office-2010
Fiam catalogo home office-2010Fiam catalogo home office-2010
Fiam catalogo home office-2010
 
Linha guiahiperdia
Linha guiahiperdiaLinha guiahiperdia
Linha guiahiperdia
 
Internet Media Scene Tunisia 09
Internet  Media  Scene  Tunisia 09Internet  Media  Scene  Tunisia 09
Internet Media Scene Tunisia 09
 
Significados
SignificadosSignificados
Significados
 
Cópia de escultura gotico renascença e barroco
Cópia de escultura gotico renascença e barrocoCópia de escultura gotico renascença e barroco
Cópia de escultura gotico renascença e barroco
 
Fernandinho - Mil Cairão Versão 1
Fernandinho - Mil Cairão Versão 1Fernandinho - Mil Cairão Versão 1
Fernandinho - Mil Cairão Versão 1
 
Português prova o rato do campo e da cidade
Português   prova o rato do campo e da cidadePortuguês   prova o rato do campo e da cidade
Português prova o rato do campo e da cidade
 
Formação de utilizadores
Formação de utilizadoresFormação de utilizadores
Formação de utilizadores
 

Semelhante a Various Facets of Indian Consumer Markets - 2

FOREIGN BANKS & REGIONAL RURAL BANKS
FOREIGN BANKS & REGIONAL RURAL BANKSFOREIGN BANKS & REGIONAL RURAL BANKS
FOREIGN BANKS & REGIONAL RURAL BANKSsaikat sen
 
International Journal of Business and Management Invention (IJBMI)
International Journal of Business and Management Invention (IJBMI)International Journal of Business and Management Invention (IJBMI)
International Journal of Business and Management Invention (IJBMI)inventionjournals
 
Karur vysya bank
Karur vysya bankKarur vysya bank
Karur vysya bankRJETHANI
 
Emerging_Growth_Centres_Q1_07
Emerging_Growth_Centres_Q1_07Emerging_Growth_Centres_Q1_07
Emerging_Growth_Centres_Q1_07Chetanbir Kaur
 
Institutional research report sbi
Institutional research report  sbiInstitutional research report  sbi
Institutional research report sbiChoice Equity
 
AN OVERVIEW OF BRANCHES AND ATMS OF COMMERCIAL BANKS IN INDIA
AN OVERVIEW OF BRANCHES AND ATMS OF COMMERCIAL BANKS IN INDIA AN OVERVIEW OF BRANCHES AND ATMS OF COMMERCIAL BANKS IN INDIA
AN OVERVIEW OF BRANCHES AND ATMS OF COMMERCIAL BANKS IN INDIA PARAMASIVANCHELLIAH
 
AN OVERVIEW OF BRANCHES AND ATMS OF COMMERCIAL BANKS IN INDIA
AN OVERVIEW OF BRANCHES AND ATMS OF COMMERCIAL BANKS IN INDIA AN OVERVIEW OF BRANCHES AND ATMS OF COMMERCIAL BANKS IN INDIA
AN OVERVIEW OF BRANCHES AND ATMS OF COMMERCIAL BANKS IN INDIA PARAMASIVANCHELLIAH
 
AN OVERVIEW OF BRANCHES AND ATMS OF COMMERCIAL BANKS IN INDIA
AN OVERVIEW OF BRANCHES AND ATMS OF COMMERCIAL BANKS IN INDIA AN OVERVIEW OF BRANCHES AND ATMS OF COMMERCIAL BANKS IN INDIA
AN OVERVIEW OF BRANCHES AND ATMS OF COMMERCIAL BANKS IN INDIA PARAMASIVANCHELLIAH
 
Vibrant Gujarat - Services Sector Profile
Vibrant Gujarat - Services Sector ProfileVibrant Gujarat - Services Sector Profile
Vibrant Gujarat - Services Sector ProfileVibrant Gujarat
 
OWNERSHIP STRUCTURE OF COMMERCIAL BANKS IN INDIA
OWNERSHIP STRUCTURE OF COMMERCIAL BANKS IN INDIAOWNERSHIP STRUCTURE OF COMMERCIAL BANKS IN INDIA
OWNERSHIP STRUCTURE OF COMMERCIAL BANKS IN INDIARAVICHANDIRANG
 
HDFC Bank Financial Analysis & Industry Comparison 2017
HDFC Bank Financial Analysis & Industry Comparison 2017HDFC Bank Financial Analysis & Industry Comparison 2017
HDFC Bank Financial Analysis & Industry Comparison 2017Harsh Bohra
 
Indiabankingsectorreportaugust2013 140201021707-phpapp01
Indiabankingsectorreportaugust2013 140201021707-phpapp01Indiabankingsectorreportaugust2013 140201021707-phpapp01
Indiabankingsectorreportaugust2013 140201021707-phpapp01Supa Buoy
 
Real estate-august-2014
Real estate-august-2014Real estate-august-2014
Real estate-august-2014Lov kush Singh
 

Semelhante a Various Facets of Indian Consumer Markets - 2 (20)

FOREIGN BANKS & REGIONAL RURAL BANKS
FOREIGN BANKS & REGIONAL RURAL BANKSFOREIGN BANKS & REGIONAL RURAL BANKS
FOREIGN BANKS & REGIONAL RURAL BANKS
 
International Journal of Business and Management Invention (IJBMI)
International Journal of Business and Management Invention (IJBMI)International Journal of Business and Management Invention (IJBMI)
International Journal of Business and Management Invention (IJBMI)
 
Karur vysya bank
Karur vysya bankKarur vysya bank
Karur vysya bank
 
Emerging_Growth_Centres_Q1_07
Emerging_Growth_Centres_Q1_07Emerging_Growth_Centres_Q1_07
Emerging_Growth_Centres_Q1_07
 
Institutional research report sbi
Institutional research report  sbiInstitutional research report  sbi
Institutional research report sbi
 
Hdfc aug05 13
Hdfc aug05 13Hdfc aug05 13
Hdfc aug05 13
 
Hdfc jan22 14
Hdfc jan22 14Hdfc jan22 14
Hdfc jan22 14
 
Hdfc jan22 14
Hdfc jan22 14Hdfc jan22 14
Hdfc jan22 14
 
Samvridhi
SamvridhiSamvridhi
Samvridhi
 
AN OVERVIEW OF BRANCHES AND ATMS OF COMMERCIAL BANKS IN INDIA
AN OVERVIEW OF BRANCHES AND ATMS OF COMMERCIAL BANKS IN INDIA AN OVERVIEW OF BRANCHES AND ATMS OF COMMERCIAL BANKS IN INDIA
AN OVERVIEW OF BRANCHES AND ATMS OF COMMERCIAL BANKS IN INDIA
 
AN OVERVIEW OF BRANCHES AND ATMS OF COMMERCIAL BANKS IN INDIA
AN OVERVIEW OF BRANCHES AND ATMS OF COMMERCIAL BANKS IN INDIA AN OVERVIEW OF BRANCHES AND ATMS OF COMMERCIAL BANKS IN INDIA
AN OVERVIEW OF BRANCHES AND ATMS OF COMMERCIAL BANKS IN INDIA
 
AN OVERVIEW OF BRANCHES AND ATMS OF COMMERCIAL BANKS IN INDIA
AN OVERVIEW OF BRANCHES AND ATMS OF COMMERCIAL BANKS IN INDIA AN OVERVIEW OF BRANCHES AND ATMS OF COMMERCIAL BANKS IN INDIA
AN OVERVIEW OF BRANCHES AND ATMS OF COMMERCIAL BANKS IN INDIA
 
Vibrant Gujarat - Services Sector Profile
Vibrant Gujarat - Services Sector ProfileVibrant Gujarat - Services Sector Profile
Vibrant Gujarat - Services Sector Profile
 
Beacon July 2014
Beacon July 2014Beacon July 2014
Beacon July 2014
 
OWNERSHIP STRUCTURE OF COMMERCIAL BANKS IN INDIA
OWNERSHIP STRUCTURE OF COMMERCIAL BANKS IN INDIAOWNERSHIP STRUCTURE OF COMMERCIAL BANKS IN INDIA
OWNERSHIP STRUCTURE OF COMMERCIAL BANKS IN INDIA
 
Private banks
Private banksPrivate banks
Private banks
 
HDFC Bank Financial Analysis & Industry Comparison 2017
HDFC Bank Financial Analysis & Industry Comparison 2017HDFC Bank Financial Analysis & Industry Comparison 2017
HDFC Bank Financial Analysis & Industry Comparison 2017
 
India : Banking Sector Report_August 2013
India : Banking Sector Report_August 2013India : Banking Sector Report_August 2013
India : Banking Sector Report_August 2013
 
Indiabankingsectorreportaugust2013 140201021707-phpapp01
Indiabankingsectorreportaugust2013 140201021707-phpapp01Indiabankingsectorreportaugust2013 140201021707-phpapp01
Indiabankingsectorreportaugust2013 140201021707-phpapp01
 
Real estate-august-2014
Real estate-august-2014Real estate-august-2014
Real estate-august-2014
 

Mais de Indicus Analytics Private Limited

Contribution of Urban Informal Settlement Dwellers to Urban Economy in India
Contribution of Urban Informal Settlement Dwellers to Urban Economy in IndiaContribution of Urban Informal Settlement Dwellers to Urban Economy in India
Contribution of Urban Informal Settlement Dwellers to Urban Economy in IndiaIndicus Analytics Private Limited
 
Predicting growth of urban agglomerations through fractal analysis of geo spa...
Predicting growth of urban agglomerations through fractal analysis of geo spa...Predicting growth of urban agglomerations through fractal analysis of geo spa...
Predicting growth of urban agglomerations through fractal analysis of geo spa...Indicus Analytics Private Limited
 
POLICY BRIEF ON FINANCIAL INCLUSION IN INDIA: E-money issuers- Risks, Rewards...
POLICY BRIEF ON FINANCIAL INCLUSION IN INDIA: E-money issuers- Risks, Rewards...POLICY BRIEF ON FINANCIAL INCLUSION IN INDIA: E-money issuers- Risks, Rewards...
POLICY BRIEF ON FINANCIAL INCLUSION IN INDIA: E-money issuers- Risks, Rewards...Indicus Analytics Private Limited
 

Mais de Indicus Analytics Private Limited (20)

Indicus Product Portfolio 2013 14
Indicus Product Portfolio 2013 14Indicus Product Portfolio 2013 14
Indicus Product Portfolio 2013 14
 
Economic Freedom Index of the States of India 2013
Economic Freedom Index of the States of India 2013Economic Freedom Index of the States of India 2013
Economic Freedom Index of the States of India 2013
 
Contribution of Urban Informal Settlement Dwellers to Urban Economy in India
Contribution of Urban Informal Settlement Dwellers to Urban Economy in IndiaContribution of Urban Informal Settlement Dwellers to Urban Economy in India
Contribution of Urban Informal Settlement Dwellers to Urban Economy in India
 
Predicting growth of urban agglomerations through fractal analysis of geo spa...
Predicting growth of urban agglomerations through fractal analysis of geo spa...Predicting growth of urban agglomerations through fractal analysis of geo spa...
Predicting growth of urban agglomerations through fractal analysis of geo spa...
 
Exploring the Luxury Clusters of India
Exploring the Luxury Clusters of IndiaExploring the Luxury Clusters of India
Exploring the Luxury Clusters of India
 
Indicus premium products software tour
Indicus premium products software tourIndicus premium products software tour
Indicus premium products software tour
 
A recipe for disaster
A recipe for disasterA recipe for disaster
A recipe for disaster
 
Market Skyline of India 2013-14
Market Skyline of India 2013-14Market Skyline of India 2013-14
Market Skyline of India 2013-14
 
The Case for Increasing FDI Caps in Insurance
The Case for Increasing FDI Caps in InsuranceThe Case for Increasing FDI Caps in Insurance
The Case for Increasing FDI Caps in Insurance
 
Economic freedom of the states of india 2012
Economic freedom of the states of india 2012Economic freedom of the states of india 2012
Economic freedom of the states of india 2012
 
Gujarat - the Social Sectors
Gujarat - the Social SectorsGujarat - the Social Sectors
Gujarat - the Social Sectors
 
Gujarat the growth story
Gujarat the growth storyGujarat the growth story
Gujarat the growth story
 
Indian cement industry a technology perspective
Indian cement industry a technology perspectiveIndian cement industry a technology perspective
Indian cement industry a technology perspective
 
Employment Trends Survey 2012
Employment Trends Survey 2012Employment Trends Survey 2012
Employment Trends Survey 2012
 
eyestate brochure
eyestate brochureeyestate brochure
eyestate brochure
 
eyestate
eyestateeyestate
eyestate
 
The organized sector in India created 346,000 jobs
The organized sector in India created 346,000 jobs The organized sector in India created 346,000 jobs
The organized sector in India created 346,000 jobs
 
Tracking urban households
Tracking urban householdsTracking urban households
Tracking urban households
 
Small durables a grwoing market
Small durables a grwoing marketSmall durables a grwoing market
Small durables a grwoing market
 
POLICY BRIEF ON FINANCIAL INCLUSION IN INDIA: E-money issuers- Risks, Rewards...
POLICY BRIEF ON FINANCIAL INCLUSION IN INDIA: E-money issuers- Risks, Rewards...POLICY BRIEF ON FINANCIAL INCLUSION IN INDIA: E-money issuers- Risks, Rewards...
POLICY BRIEF ON FINANCIAL INCLUSION IN INDIA: E-money issuers- Risks, Rewards...
 

Último

Bajaj Allianz Life Insurance Company - Insurer Innovation Award 2024
Bajaj Allianz Life Insurance Company - Insurer Innovation Award 2024Bajaj Allianz Life Insurance Company - Insurer Innovation Award 2024
Bajaj Allianz Life Insurance Company - Insurer Innovation Award 2024The Digital Insurer
 
Mastering MySQL Database Architecture: Deep Dive into MySQL Shell and MySQL R...
Mastering MySQL Database Architecture: Deep Dive into MySQL Shell and MySQL R...Mastering MySQL Database Architecture: Deep Dive into MySQL Shell and MySQL R...
Mastering MySQL Database Architecture: Deep Dive into MySQL Shell and MySQL R...Miguel Araújo
 
Top 5 Benefits OF Using Muvi Live Paywall For Live Streams
Top 5 Benefits OF Using Muvi Live Paywall For Live StreamsTop 5 Benefits OF Using Muvi Live Paywall For Live Streams
Top 5 Benefits OF Using Muvi Live Paywall For Live StreamsRoshan Dwivedi
 
Cloud Frontiers: A Deep Dive into Serverless Spatial Data and FME
Cloud Frontiers:  A Deep Dive into Serverless Spatial Data and FMECloud Frontiers:  A Deep Dive into Serverless Spatial Data and FME
Cloud Frontiers: A Deep Dive into Serverless Spatial Data and FMESafe Software
 
Artificial Intelligence: Facts and Myths
Artificial Intelligence: Facts and MythsArtificial Intelligence: Facts and Myths
Artificial Intelligence: Facts and MythsJoaquim Jorge
 
Polkadot JAM Slides - Token2049 - By Dr. Gavin Wood
Polkadot JAM Slides - Token2049 - By Dr. Gavin WoodPolkadot JAM Slides - Token2049 - By Dr. Gavin Wood
Polkadot JAM Slides - Token2049 - By Dr. Gavin WoodJuan lago vázquez
 
Deploy with confidence: VMware Cloud Foundation 5.1 on next gen Dell PowerEdg...
Deploy with confidence: VMware Cloud Foundation 5.1 on next gen Dell PowerEdg...Deploy with confidence: VMware Cloud Foundation 5.1 on next gen Dell PowerEdg...
Deploy with confidence: VMware Cloud Foundation 5.1 on next gen Dell PowerEdg...Principled Technologies
 
HTML Injection Attacks: Impact and Mitigation Strategies
HTML Injection Attacks: Impact and Mitigation StrategiesHTML Injection Attacks: Impact and Mitigation Strategies
HTML Injection Attacks: Impact and Mitigation StrategiesBoston Institute of Analytics
 
Real Time Object Detection Using Open CV
Real Time Object Detection Using Open CVReal Time Object Detection Using Open CV
Real Time Object Detection Using Open CVKhem
 
Apidays Singapore 2024 - Building Digital Trust in a Digital Economy by Veron...
Apidays Singapore 2024 - Building Digital Trust in a Digital Economy by Veron...Apidays Singapore 2024 - Building Digital Trust in a Digital Economy by Veron...
Apidays Singapore 2024 - Building Digital Trust in a Digital Economy by Veron...apidays
 
A Year of the Servo Reboot: Where Are We Now?
A Year of the Servo Reboot: Where Are We Now?A Year of the Servo Reboot: Where Are We Now?
A Year of the Servo Reboot: Where Are We Now?Igalia
 
Apidays New York 2024 - The Good, the Bad and the Governed by David O'Neill, ...
Apidays New York 2024 - The Good, the Bad and the Governed by David O'Neill, ...Apidays New York 2024 - The Good, the Bad and the Governed by David O'Neill, ...
Apidays New York 2024 - The Good, the Bad and the Governed by David O'Neill, ...apidays
 
Tata AIG General Insurance Company - Insurer Innovation Award 2024
Tata AIG General Insurance Company - Insurer Innovation Award 2024Tata AIG General Insurance Company - Insurer Innovation Award 2024
Tata AIG General Insurance Company - Insurer Innovation Award 2024The Digital Insurer
 
TrustArc Webinar - Stay Ahead of US State Data Privacy Law Developments
TrustArc Webinar - Stay Ahead of US State Data Privacy Law DevelopmentsTrustArc Webinar - Stay Ahead of US State Data Privacy Law Developments
TrustArc Webinar - Stay Ahead of US State Data Privacy Law DevelopmentsTrustArc
 
A Domino Admins Adventures (Engage 2024)
A Domino Admins Adventures (Engage 2024)A Domino Admins Adventures (Engage 2024)
A Domino Admins Adventures (Engage 2024)Gabriella Davis
 
Workshop - Best of Both Worlds_ Combine KG and Vector search for enhanced R...
Workshop - Best of Both Worlds_ Combine  KG and Vector search for  enhanced R...Workshop - Best of Both Worlds_ Combine  KG and Vector search for  enhanced R...
Workshop - Best of Both Worlds_ Combine KG and Vector search for enhanced R...Neo4j
 
Powerful Google developer tools for immediate impact! (2023-24 C)
Powerful Google developer tools for immediate impact! (2023-24 C)Powerful Google developer tools for immediate impact! (2023-24 C)
Powerful Google developer tools for immediate impact! (2023-24 C)wesley chun
 
Top 10 Most Downloaded Games on Play Store in 2024
Top 10 Most Downloaded Games on Play Store in 2024Top 10 Most Downloaded Games on Play Store in 2024
Top 10 Most Downloaded Games on Play Store in 2024SynarionITSolutions
 
Data Cloud, More than a CDP by Matt Robison
Data Cloud, More than a CDP by Matt RobisonData Cloud, More than a CDP by Matt Robison
Data Cloud, More than a CDP by Matt RobisonAnna Loughnan Colquhoun
 

Último (20)

Bajaj Allianz Life Insurance Company - Insurer Innovation Award 2024
Bajaj Allianz Life Insurance Company - Insurer Innovation Award 2024Bajaj Allianz Life Insurance Company - Insurer Innovation Award 2024
Bajaj Allianz Life Insurance Company - Insurer Innovation Award 2024
 
Mastering MySQL Database Architecture: Deep Dive into MySQL Shell and MySQL R...
Mastering MySQL Database Architecture: Deep Dive into MySQL Shell and MySQL R...Mastering MySQL Database Architecture: Deep Dive into MySQL Shell and MySQL R...
Mastering MySQL Database Architecture: Deep Dive into MySQL Shell and MySQL R...
 
Top 5 Benefits OF Using Muvi Live Paywall For Live Streams
Top 5 Benefits OF Using Muvi Live Paywall For Live StreamsTop 5 Benefits OF Using Muvi Live Paywall For Live Streams
Top 5 Benefits OF Using Muvi Live Paywall For Live Streams
 
Cloud Frontiers: A Deep Dive into Serverless Spatial Data and FME
Cloud Frontiers:  A Deep Dive into Serverless Spatial Data and FMECloud Frontiers:  A Deep Dive into Serverless Spatial Data and FME
Cloud Frontiers: A Deep Dive into Serverless Spatial Data and FME
 
Artificial Intelligence: Facts and Myths
Artificial Intelligence: Facts and MythsArtificial Intelligence: Facts and Myths
Artificial Intelligence: Facts and Myths
 
Polkadot JAM Slides - Token2049 - By Dr. Gavin Wood
Polkadot JAM Slides - Token2049 - By Dr. Gavin WoodPolkadot JAM Slides - Token2049 - By Dr. Gavin Wood
Polkadot JAM Slides - Token2049 - By Dr. Gavin Wood
 
Deploy with confidence: VMware Cloud Foundation 5.1 on next gen Dell PowerEdg...
Deploy with confidence: VMware Cloud Foundation 5.1 on next gen Dell PowerEdg...Deploy with confidence: VMware Cloud Foundation 5.1 on next gen Dell PowerEdg...
Deploy with confidence: VMware Cloud Foundation 5.1 on next gen Dell PowerEdg...
 
+971581248768>> SAFE AND ORIGINAL ABORTION PILLS FOR SALE IN DUBAI AND ABUDHA...
+971581248768>> SAFE AND ORIGINAL ABORTION PILLS FOR SALE IN DUBAI AND ABUDHA...+971581248768>> SAFE AND ORIGINAL ABORTION PILLS FOR SALE IN DUBAI AND ABUDHA...
+971581248768>> SAFE AND ORIGINAL ABORTION PILLS FOR SALE IN DUBAI AND ABUDHA...
 
HTML Injection Attacks: Impact and Mitigation Strategies
HTML Injection Attacks: Impact and Mitigation StrategiesHTML Injection Attacks: Impact and Mitigation Strategies
HTML Injection Attacks: Impact and Mitigation Strategies
 
Real Time Object Detection Using Open CV
Real Time Object Detection Using Open CVReal Time Object Detection Using Open CV
Real Time Object Detection Using Open CV
 
Apidays Singapore 2024 - Building Digital Trust in a Digital Economy by Veron...
Apidays Singapore 2024 - Building Digital Trust in a Digital Economy by Veron...Apidays Singapore 2024 - Building Digital Trust in a Digital Economy by Veron...
Apidays Singapore 2024 - Building Digital Trust in a Digital Economy by Veron...
 
A Year of the Servo Reboot: Where Are We Now?
A Year of the Servo Reboot: Where Are We Now?A Year of the Servo Reboot: Where Are We Now?
A Year of the Servo Reboot: Where Are We Now?
 
Apidays New York 2024 - The Good, the Bad and the Governed by David O'Neill, ...
Apidays New York 2024 - The Good, the Bad and the Governed by David O'Neill, ...Apidays New York 2024 - The Good, the Bad and the Governed by David O'Neill, ...
Apidays New York 2024 - The Good, the Bad and the Governed by David O'Neill, ...
 
Tata AIG General Insurance Company - Insurer Innovation Award 2024
Tata AIG General Insurance Company - Insurer Innovation Award 2024Tata AIG General Insurance Company - Insurer Innovation Award 2024
Tata AIG General Insurance Company - Insurer Innovation Award 2024
 
TrustArc Webinar - Stay Ahead of US State Data Privacy Law Developments
TrustArc Webinar - Stay Ahead of US State Data Privacy Law DevelopmentsTrustArc Webinar - Stay Ahead of US State Data Privacy Law Developments
TrustArc Webinar - Stay Ahead of US State Data Privacy Law Developments
 
A Domino Admins Adventures (Engage 2024)
A Domino Admins Adventures (Engage 2024)A Domino Admins Adventures (Engage 2024)
A Domino Admins Adventures (Engage 2024)
 
Workshop - Best of Both Worlds_ Combine KG and Vector search for enhanced R...
Workshop - Best of Both Worlds_ Combine  KG and Vector search for  enhanced R...Workshop - Best of Both Worlds_ Combine  KG and Vector search for  enhanced R...
Workshop - Best of Both Worlds_ Combine KG and Vector search for enhanced R...
 
Powerful Google developer tools for immediate impact! (2023-24 C)
Powerful Google developer tools for immediate impact! (2023-24 C)Powerful Google developer tools for immediate impact! (2023-24 C)
Powerful Google developer tools for immediate impact! (2023-24 C)
 
Top 10 Most Downloaded Games on Play Store in 2024
Top 10 Most Downloaded Games on Play Store in 2024Top 10 Most Downloaded Games on Play Store in 2024
Top 10 Most Downloaded Games on Play Store in 2024
 
Data Cloud, More than a CDP by Matt Robison
Data Cloud, More than a CDP by Matt RobisonData Cloud, More than a CDP by Matt Robison
Data Cloud, More than a CDP by Matt Robison
 

Various Facets of Indian Consumer Markets - 2

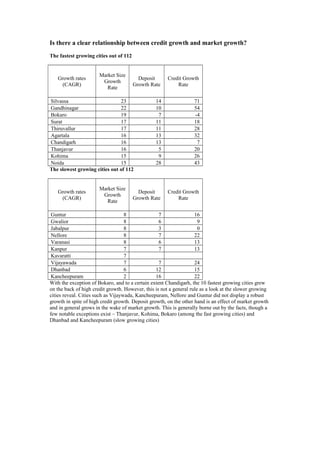
  • 1. Is there a clear relationship between credit growth and market growth? The fastest growing cities out of 112 Growth rates (CAGR) Market Size Growth Rate Deposit Growth Rate Credit Growth Rate Silvassa 23 14 71 Gandhinagar 22 10 54 Bokaro 19 7 -4 Surat 17 11 18 Thiruvallur 17 11 28 Agartala 16 13 32 Chandigarh 16 13 7 Thanjavur 16 5 20 Kohima 15 9 26 Noida 15 28 43 The slowest growing cities out of 112 Growth rates (CAGR) Market Size Growth Rate Deposit Growth Rate Credit Growth Rate Guntur 8 7 16 Gwalior 8 6 9 Jabalpur 8 3 0 Nellore 8 7 22 Varanasi 8 6 13 Kanpur 7 7 13 Kavaratti 7 Vijayawada 7 7 24 Dhanbad 6 12 15 Kancheepuram 2 16 22 With the exception of Bokaro, and to a certain extent Chandigarh, the 10 fastest growing cities grew on the back of high credit growth. However, this is not a general rule as a look at the slower growing cities reveal. Cities such as Vijaywada, Kancheepuram, Nellore and Guntur did not display a robust growth in spite of high credit growth. Deposit growth, on the other hand is an effect of market growth and in general grows in the wake of market growth. This is generally borne out by the facts, though a few notable exceptions exist – Thanjavur, Kohima, Bokaro (among the fast growing cities) and Dhanbad and Kancheepuram (slow growing cities)
  • 2. Insights into the Financial landscape of the country Indian Financial Scape provides insights into the financial landscape of the country. It presents nearly 250 different variables at district level. The product helps enhance a professional’s understanding of the markets. A few samples of unusual insights are presented below. There are many more interesting ones available in the product. Fastest growing districts in terms of Personal Loans (Personal loans, as defined by RBI includes all loans taken by individuals – secured and unsecured) Unit % Year 2001-02 to 2007-08 Personal loans - growth rate of SCB`s credit State District Karnataka Bangalore Rural 77 Meghalaya West Garo Hills 74 Arunachal Pradesh Changlang 72 Arunachal Pradesh East Siang 72 Arunachal Pradesh Papum Pare 72 Arunachal Pradesh West Kameng 72 Bihar Katihar 72 Uttar Pradesh Sant Kabir Nagar 71 Haryana Jhajjar 70 Assam Hailakandi 69 Gujarat Narmada 69 Haryana Panipat 68 Haryana Rohtak 67 Haryana Sonipat 67 Haryana Faridabad 62 Jammu & Kashmir Pulwama 62 Mizoram Champhai 60 Bihar Araria 57 Chhattisgarh Rajnandgaon 57 Uttar Pradesh Baghpat 56 Arunachal Pradesh is an unusual place. Not much is known about it and it has a small base. Yet, on a sustained basis, over a 6 year period, four of its districts have figured among the top 6 districts in India in terms of growth in personal credit. Haryana is another place which has seen a boom with four of its districts figuring in the top 15. Fastest growing districts in terms of Professional and other Services credit Unit % % Year 2001-02 to 2007-08 2001-02 to 2007-08 Professional & other Services - growth rate of SCB`s credit Personal loans - growth rate of SCB`s credit State District Gujarat Rajkot 51 26 Chhattisgarh Korba 47 34 Punjab Bathinda 47 50
  • 3. Andhra Pradesh Krishna 46 18 Rajasthan Ajmer 46 31 Rajasthan Kota 44 25 Madhya Pradesh Katni 44 12 Chhattisgarh Kanker 44 34 Rajasthan Ganganagar 43 31 Sikkim South Sikkim 42 26 Sikkim North Sikkim 42 53 Arunachal Pradesh Lohit 42 -16 Rajasthan Jodhpur 42 36 West Bengal Haora 42 17 Sikkim East Sikkim 42 16 Rajasthan Sikar 41 51 Orissa Sambalpur 41 34 Haryana Rewari 40 -11 Andhra Pradesh Nalgonda 40 21 Haryana Mahendragarh 40 33 The growth in credit in this category has been much lower than in the personal credit category. The districts that have grown fastest are those that are not in the top pecking order, yet they are not very small either. Lohit, in Arunachal Pradesh is unusual because it shows a negative growth in personal credit. Its possible that personal credit were routed through Professional credit in reality. Rewari is another standout – high growth in Professional combining with a negative growth in personal credit. Fastest growing districts in terms of Trade Credit Unit % Year 2001-02 to 2007-08 Trade Credit - growth rate of SCB`s credit State District Tamil nadu Nagapattinam 49 Chhattisgarh Rajnandgaon 47 Meghalaya Jaintia Hills 44 Haryana Jhajjar 40 Karnataka Bangalore Rural 40 Uttar Pradesh Mahoba 40 Gujarat Kheda 39 Orissa Ganjam 39 Haryana Gurgaon 38 Himachal Pradesh Kinnaur 38 Uttar Pradesh Gautam Buddha Nagar 38 Sikkim East Sikkim 37 Jammu & Kashmir Leh (Ladakh) 37 Bihar Madhubani 37 Arunachal Pradesh West Kameng 36 Uttaranchal Rudraprayag 35 West Bengal Medinipur 35
  • 4. Andhra Pradesh Medak 35 Haryana Panchkula 34 Nagaland Mon 34 Economic Risk The Economic Risk Index is an important variable to consider while doing business. In case of financial products, it is important for marketers to consider the risks involved in addition to market size, growth and demography. Indian Financial Scape is a product which has introduced an Economic Risk index and rated districts based on variables such as economic offences, credit penetration, and credit overdue per credit of district central cooperative banks, Gross domestic product, GDP Growth, No. of Industrial Disputes (All strikes & Lockouts) and Maydays Lost Due to Industrial, Disputes per worker.. The top ranking districts in terms of economic risk State District Dadra & Nagar Haveli Dadra & Nagar Haveli Daman & Diu Daman Daman & Diu Diu Lakshadweep Lakshadweep Madhya Pradesh Neemuch Madhya Pradesh Jhabua Rajasthan Ganganagar Himachal Pradesh Kinnaur Madhya Pradesh Shajapur Madhya Pradesh Satna The worst districts in terms of economic risk State District Pondicherry Mahe Pondicherry Yanam Pondicherry Pondicherry West Bengal Kolkata West Bengal Koch Bihar West Bengal North 24 Parganas West Bengal South 24 Parganas Jharkhand Dumka Arunachal Pradesh Tirap West Bengal Puruliya How are some of the top business centres ranked (out of nearly 600 districts of India)? District Rank Hyderabad 177 Delhi 104 Ahmadabad 35 Surat 33 Bangalore 110 Mumbai 72 Mumbai (Suburban) 70 Pune 74 Chennai 111 Coimbatore 112 Kolkata 581
  • 5. Most of the major centres are ranked within the top 30%. However, there are wide differences. The Western region (Mumbai, Ahmadabad, etc.) are clearly the safest. Kolkata stands out with a very poor ranking.
  • 6. Demand for Housing The Housing Skyline of India estimates the demand for housing units in the top 30 cities to grow by 6.36 million units during the next 7 years leading up to 2015. The current stock of housing units in these 30 cities is estimated to be 25 million units, which implies a growth in housing stock of over 25% within 7 years. Demand between 2008 and 2015 Total Demand for Housing Demand for Plinth Area Less than 500 Sq ft Demand for Plinth Area Between 500- 1000 Sq ft Demand for Plinth Area More than 1000 Sq ft Top 10 cities (alpha) 3,548,000 1,212,000 1,151,00 0 1,186,0 00 Next 20 cities (beta) 2,815,000 930,000 921,00 0 965,0 00 Top 30 cities (alpha + beta) 6,363,000 2,142,000 2,072,00 0 2,151,0 00 Current Stock Current Housing Stock Current Housing Stock - Plinth Area Less than 500 Sq ft Current Housing Stock - Plinth Area Between 500-1000 Sq ft Current Housing Stock - Plinth Area More than 1000 Sq ft Top 10 14,624,000 5,829,000 4,337,00 0 4,458,0 00 Next 20 10,413,000 4,179,000 3,145,00 0 3,089,0 00 Top 30 25,037,000 10,008,000 7,482,000 7,547,000 Whereas most of the attention of the building industry is on the upper segment, it is middle and lower middle India which is driving demand - • The demand for housing of size less than 1000 sq ft is 4.2 million units over 7 years, which is 2/3rd of the demand • The anticipated growth in percentage terms in the lower segments (24% combined) is only marginally lower than the upper segment (28.5%) • The pattern is similar for the alpha (top 10) and beta (the next 20) cities, implying a uniform demand for affordable housing. The above pattern indicates that a renewed focus on affordable housing is in order. There is plenty of demand out there; supply is more likely to be the constraint. Alpha cities are - Hyderabad, Delhi, Ahmadabad, Surat, Bangalore, Mumbai, Pune, Chennai, Coimbatore, Kolkata Beta cities are – Asansol, Bhopal, Faridabad, Indore, Jaipur, Jamshedpur, Kancheepuram, Kanniyakumari, Kanpur, Kochi, Lucknow, Ludhiana, Madurai, Nagpur, Patna, Salem, Thiruvallur, Urban Areas in North 24 Parganas, Urban Areas in Thane, Vadodara The estimation process involved the following steps: • Demographic parameters such as population across age-groups, change in household sizes, and family structures were estimated using data from census and various large scale data surveys. • This data was used with large scale survey data on housing conditions (NSSO 49th and 58th rounds) to establish the relationship between housing demand and demographic parameters. • Independently the relationship between ownership and income was established. Estimates of current income and growth from “The Market Skyline of India” were used to estimate households across income levels for the two time periods. • One of the major drivers of housing demand is the current and future rental markets. This in turn is driven by growth in economy, employment and migration trends. Estimates of GDP, employment growth and migration were used from “The District Level GDP 2006-07” to define the relationship with housing demand.
  • 7. • Another relationship established was the ease and extent of availability of finance and housing demand. Data from RBI on housing loans for the last ten years were used to determine the function. • All these aspects were then combined to estimate the net demand in housing during the period 2008-15. They were also used to determine the demand for housing across various segments including income categories, plinth area, room size, etc. • The entire exercise was validated at various stages using a primary survey of households on income, demography, financial habits and housing conditions conducted in July 2008. Secondary data such as housing stock estimates from NHB, proposed construction data from various housing boards, etc. were also used to cross check estimates at various intermediate steps.
  • 8. Financial Asset Penetration On an average, only 16% of Indian households have taken loans from institutional agencies. On the other hand, 22% of the households have taken loans from non institutional agencies. There are two clear indications here – a) the bulk of the population is financially underserved and rely on informal lending and b) the non institutional agencies have together achieved a much higher penetration than the institutional agencies. If we look at another indicator of financial inclusion, namely percentage of households who hold stocks and debentures, we find that the penetration is just 5%. There is no doubt that financial inclusion is extremely poor and financial institutions need to focus more on expanding the market rather than flog the existing markets. Here are the top districts in terms of penetration of institutional loans. These districts have penetrations ranging from 37% to 68%. As many as 14 of these 20 are from Kerala. The districts are Kottayam, Kannur, Idukki, Ernakulam, Pathanamthitta, Kasaragod, Wayanad, Palakkad, Kollam, Thrissur, Kozhikode, Malappuram, Alappuzha and Thiruvananthapuram from Kerala and Mahe, Udupi, Satara, Kolhapur, Wardha, Shajapur (MP). The bottom twenty districts (all less than 1% penetration) are mainly from the hill districts (Arunachal Pradesh, Manipur, Mehghalaya and J&K - Changlang, East Kameng, Lohit, Lower Subansiri, Tirap, Dhubri, Kupwara, Bishnupur, Chandel, Churachandpur, Senapati, Tamenglong, Thoubal, Ukhrul, East Garo Hills, Jaintia Hills, Ri Bhoi, South Garo Hills, West Garo Hills The picture changes substantially when one looks at the penetration of non institutional loans. The top 24 districts have penetration ranging from 50-53%. These are - Tiruchirappalli, Nagapattinam, Thiruvarur, Thanjavur, Karur, Pudukkottai and Perambalur from Tamil Nadu, Mahe, Karaikal, Pondicherry, Yanam from Pondicherry, and Prakasam, Srikakulam, West Godavari, Krishna, Nellore, Guntur, Visakhapatnam, Vizianagaram, East Godavari, Chittoor, Cuddapah, Anantapur and Kurnool from Andhra Pradesh indicating a clear geographic pattern. The bottom districts are again from the hill states. In fact of the bottom 64 (up to 7% penetration) - 2 are from Andaman and Nicobar, 13 are from Arunachal, 14 are from J&K, 7 from Meghalaya, 8 from Mizoram, 4 from Sikkim, 13 from Uttaranchal, and 3 from West Bengal. At a broader level there is a clear need for enhanced services in the hill states. However, even among the relatively well off districts, it is interesting to note that TN and Andhra seem to have a very high penetration of non institutional loans as compared to institutional loans – clearly an area for capturing the low hanging fruits for the formal sector.
  • 9. How many people invest in stocks and shares? We all know that penetration of shares and debentures is extremely low in India. Just how low is it? The various data thrown around suggest around 30 million demat accounts. This however does not account for multiple accounts of investors. In our product, Indian Financial Scape, we have estimated the number of households (not individuals) who own shares and debentures at district level. This is based on large scale household surveys at various points in time conducted by Census of India, NSSO, and others. Some of the top line results are as follows: • Less than 5% of the households, about 12 million in number own shares and debentures (note: this can translate into anywhere between 20-25 million individuals and 30-40 million demat accounts) • Region wise the penetration of shares and debentures (% of households) are – West 5.25%, North 4.52%, South 8.17%, and East 3.2%. • West is dragged down by Rajasthan (3.6%) and MP (3.2%). The other states in the West are Maharashtra (8.4%), Gujarat (6.1%) and the combined Goa, Daman and Diu, Dadra Nagar Haveli (8.2%) • At state level, the highest penetrations are in: Delhi Kerala Karnataka Maharashtra Goa, Daman, Dadra Tamil Nadu Punjab Haryana 13.00 10.50 8.96 8.37 8.20 7.97 7.00 6.95 • The leading districts in terms of penetration are: Maharashtra Karnataka Maharashtra Maharashtra Haryana Mumbai Udupi Mumbai (Suburban) Thane Panchkula 27 24 23 20 19 Chandigarh West Bengal Goa Karnataka Kerala Chandigarh Kolkata North Goa Bangalore Ernakulam 19 19 18 18 18 Kerala Tamil Nadu Maharashtra Karnataka Karnataka Thrissur Chennai Kolhapur Dakshina Kannada Dharwad 18 18 17 17 17 Andhra Pradesh Karnataka Kerala Gujarat Madhya Pradesh Hyderabad Uttara Kannada Kottayam Ahmadabad Indore 15 15 15 14 14 • The bottom 41 districts in terms of penetration are all from the East • The bottom 249 districts (42% of the districts) are from the East, hill states or MP, Rajasthan and UP. In fact, if we ignore the backward areas of Vidarbha and Panchmahals, then we actually see that the bottom 50% (about 290 districts) are all from the East, hill states or MP, Rajasthan and UP, clearly indicating an East-West divide in penetration.
  • 10. Housing Stock and Demand The Housing Skyline of India estimates the demand for housing units in the top 112 cities to be 10.5 million units during the next 7 years leading up to 2015. The current stock of housing units in these cities is estimated to be 41.8 million units, which implies a growth in housing stock of over 25% within 7 years Of these 112, the top 30 cities will account for 60% of the demand and are expected to add 6.36 million units during the next 7. The current stock of housing units in these 30 cities is estimated to be 25 million units. The top 112 Cities Figures in millions Households with Plinth Area Less than 500 Sq ft 17.0 Households with Plinth Area Between 500-1000 Sq ft 12.5 Households with Plinth Area More than 1000 Sq ft 12.3 Demand for units (2008-2015) for Plinth Area Less than 500 Sq ft 3.5 Demand for units (2008-2015) for Plinth Area Between 500-1000 Sq ft 3.4 Demand for units (2008-2015) for Plinth Area More than 1000 Sq ft 3.7 The top 30 Cities Figures in millions Households with Plinth Area Less than 500 Sq ft 10.01 Households with Plinth Area Between 500-1000 Sq ft 7.48 Households with Plinth Area More than 1000 Sq ft 7.55 Current stock of houses with plinth area > 1000 sq feet (figures in ‘000s)
  • 11. Demand for units (2008-2015) for Plinth Area Less than 500 Sq ft 2.14 Demand for units (2008-2015) for Plinth Area Between 500-1000 Sq ft 2.07 Demand for units (2008-2015) for Plinth Area More than 1000 Sq ft 2.15 Whereas most of the attention of the building industry is on the upper segment, it is middle and lower middle India which is driving demand - • The demand for housing of size less than 1000 sq ft is 6.2 million units over 7 years, which is 2/3rd of the demand • The anticipated growth in percentage terms in the lower segments (23% combined) is lower than the upper segment (30%), but on a base which is nearly two and a half times. • The pattern is similar for the alpha (top 10) and beta (the next 20) cities, implying a uniform demand for affordable housing. The above pattern indicates that a renewed focus on affordable housing is in order. There is plenty of demand out there; supply is more likely to be the constraint.
  • 12. Demography – Age profile of the top 112 cities of India The age profile of the top 112 cities (which account for a population of 200 million) does not show too much variation. 69% are between the age of 18 and 60 and the proportions do not vary much across different cities. The proportion of the aged in the larger cities is higher but only marginally. In sheer numbers, about 36 million people in the top 112 cities are above 60 years of age and the alpha cities account for 35% of them. The under 18 population is significantly smaller at about 26 million under 18 years 18-35 years 35-60 years > 60 years Alpha (top 10) 12.4% 34.3% 34.7% 18.6% Beta (11th to 30th) 13.0% 34.7% 34.2% 18.1% Gamma (31st to 50th) 14.1% 35.9% 32.7% 17.3% Delta (51st to 112th) 14.3% 36.7% 31.6% 17.3% Total (112 cities) 13.3% 35.3% 33.5% 17.9% under 18 years 18-35 years 35-60 years > 60 years Alpha (top 10) 8,306,888 23,052,698 23,318,890 12,456,128 Beta (11th to 30th) 6,714,661 17,926,723 17,642,448 9,352,400 Gamma (31st to 50th) 4,390,776 11,161,258 10,161,636 5,388,436 Delta (51st to 112th) 7,211,062 18,473,936 15,894,690 8,708,917 Total (112 cities) 26,623,387 70,614,615 67,017,664 35,905,881 8,306,888 6,714,661 4,390,776 7,211,062 23,052,698 17,926,723 11,161,258 18,473,936 23,318,890 17,642,448 10,161,636 15,894,690 12,456,128 9,352,400 5,388,436 8,708,917 Alpha (top 10) Beta (11th to 30th) Gamma (31st to 50th) Delta (51st to 112th) under 18 years 18-35 years 35-60 years > 60 years
  • 13. 12.4% 13.0% 14.1% 14.3% 34.3% 34.7% 35.9% 36.7% 34.7% 34.2% 32.7% 31.6% 18.6% 18.1% 17.3% 17.3% Alpha (top 10) Beta (11th to 30th) Gamma (31st to 50th) Delta (51st to 112th) under 18 years 18-35 years 35-60 years > 60 years
  • 14. Income and Savings in Urban India The top 112 cities account for about 200 million Indians which is more than 60% of urban India. These cities constitute a market of consumers whose combined annual incomes are Rs 13.26 billion. Their combined savings are Rs 3.5 billion which is about 26.5% of income. However there is considerable heterogeneity in the income and savings pattern across these cities. If we look at four classes of cities (by size), we get the following picture: Total Income (Rs billions) Total Savings (Rs billions) Savings/ Income Ratio Alpha (Top 10) 5,912 1,296 21.9% Beta (11th to 30th) 2,887 931 32.2% Gamma (31st to 50th) 1,774 519 29.3% Delta (The balance 62) 2,688 771 28.7% Top 112 cities 13,261 3,516 26.5% The large cities have a significantly lower savings rate. The top 10 cities have a savings rate of under 22%, whereas the gamma and delta cities (82 in number) have savings rate around 29%. Clearly the EMI culture hasn’t percolated down to too many cities in India. An interesting piece of statistics is that the 2nd rung of cities are the biggest savers – the beta cities save as much as 32% of their income and reinforce the old adage that savings and investment are the route to growth. If we look at the same set of data through the regional prism, we get the following picture: Total Income (Rs billions) Total Savings (Rs billions) Savings/ Income Ratio East 2,011 522 25.9% West 5,167 1,191 23.0% North 2,849 797 28.0% South 3,233 1,007 31.1% The Southerners are by far the largest savers with a savings rate of over 31%. The West (it includes Rajasthan and MP) has the lowest savings rate of just 23%. Within West, Gujarat is a high saver with 27% savings rate whereas Maharashtra saves only 18%. Madhya Pradesh is a very high saver with savings rate of 38%. Contrary to popular wisdom, the North is not exactly spendthrift, they are second only to the South in savings rate. What do the figures look like for some of the major cities? Total Income (Rs billions) Total Savings (Rs billions) Savings/ Income Ratio Mumbai 1,608 216 13.4% Delhi 1,264 289 22.8% Bangalore 602 192 31.9% Urban Areas in Thane 569 132 23.2% Pune 446 111 24.9% Ahmadabad 429 109 25.3% Chennai 393 88 22.2% Kolkata 350 68 19.3% Surat 318 82 25.8% Hyderabad 295 87 29.3% Mumbai has the lowest savings rate. Delhi, Kolkata and Mumbai’s neighbours are also low savers. Bangalore and Hyderabad are high savers, much higher than average. The heterogeneity of India is well reflected in the savings patterns. There are no clear regional patterns. However, it is evident that the economically vibrant cities are lower in savings rate as compared to their regional brethrens which reinforces the theory that consumerism is one of the key pivots of the recent surge in economic growth and erosion in consumer confidence will impact economic growth negatively.