Coverage of Market Skyline of India
•Transferir como DOC, PDF•
0 gostou•654 visualizações

Know about socio economic classifications, Income, savings and consumption expenditures of households for each district of India and: Individuals/children across income groups Rural/urban break up of market size Urban household Socio economic classifications Product segment wise market sizes … and much more Enables you with Granular Information Map, graph and report Prioritize and expand your business Be better informed than competitors … and many other benefits Market Skyline of India accelerates your research on consumers, demography, market sizes, income and savings pattern, socio economic factors and much more.The pack comes with GUI navigation which allows the user to drill down to the districts via clickable maps.

Recomendados
Recomendados
Mais conteúdo relacionado
Mais de Indicus Analytics Private Limited
Mais de Indicus Analytics Private Limited (20)
Último
Último (20)
Coverage of Market Skyline of India
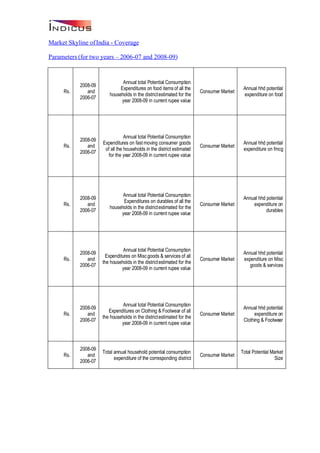
- 1. Market Skyline of India - Coverage Parameters (for two years – 2006-07 and 2008-09) Annual total Potential Consumption 2008-09 Expenditures on food items of all the Annual hhd potential Rs. and Consumer Market households in the district estimated for the expenditure on food 2006-07 year 2008-09 in current rupee value Annual total Potential Consumption 2008-09 Expenditures on fast moving consumer goods Annual hhd potential Rs. and Consumer Market of all the households in the district estimated expenditure on fmcg 2006-07 for the year 2008-09 in current rupee value Annual total Potential Consumption 2008-09 Annual hhd potential Expenditures on durables of all the Rs. and Consumer Market expenditure on households in the district estimated for the 2006-07 durables year 2008-09 in current rupee value Annual total Potential Consumption 2008-09 Annual hhd potential Expenditures on Misc goods & services of all Rs. and Consumer Market expenditure on Misc the households in the district estimated for the 2006-07 goods & services year 2008-09 in current rupee value Annual total Potential Consumption 2008-09 Annual hhd potential Expenditures on Clothing & Footwear of all Rs. and Consumer Market expenditure on the households in the district estimated for the 2006-07 Clothing & Footwear year 2008-09 in current rupee value 2008-09 Total annual household potential consumption Total Potential Market Rs. and Consumer Market expenditure of the corresponding district Size 2006-07
- 2. Shop owners/ farmers/ wholesalers/ traders/ self employed professionals/ junior executives/ officers who have a graduate degree or above, businessmen/ industrialists 2008-09 with less than 10 employees and have been to Number and Consumer Market SEC A (Urban) college, businessmen/industrialists with 10 or 2006-07 more employees and have greater than four years of schooling, all middle/senior officers and executives who have been to college in urban areas Shop owners/ farmers/ wholesale traders/ self employed professionals/ officers/ junior executives who have spent some time in college but are not graduates, clerks and salesmen who are graduate and above, supervisors who are graduate and general post graduates, businessmen/industrialists with 9 or less employees and have completed schooling, businessmen/ industrialists with 10 or more employees but up to 9 years of 2008-09 schooling, all middle/senior officers and Number and executives who have not been to college, Consumer Market SEC B (Urban) 2006-07 skilled workers and petty traders with graduate or higher degree, Shop owners who have completed schooling, businessmen with 5 to 9 years of schooling, businessmen with up to 9 years of schooling, self employed professionals, officers and junior executives who have completed schooling, supervisors/clerks/ salesmen who have spent some time in college but are not graduates in urban areas
- 3. Skilled workers and petty traders with greater than 9 years of schooling but not graduates, shop owners/ farmers/ wholesalers/ traders with 5 to 9 years of schooling, illiterate 2008-09 businessmen with 1 to 9 employees, Number and businessmen with no employees but up to 4 Consumer Market SEC C (Urban) 2006-07 years of schooling, clerks and salesmen who have completed schooling, supervisors with greater than five years of schooling but not college, officers and junior executives with up to 9 years of schooling in urban areas Unskilled workers with greater than 9 years of schooling, skilled workers with 5 to 9 years of schooling, literate petty traders with up to 9 years of schooling, shop owners/farmers or 2008-09 wholesale traders with up to four years of Number and Consumer Market SEC D (Urban) schooling, self employed with no employees, 2006-07 self employed with up to 9 years of schoolng,i Clerks and salesmen with up to 9 years of schooling, Supervisors with up to 4 years of schooling in urban areas
- 4. Unskilled workers with 5 to 9 years of schooling, skilled workers with up to four 2008-09 years of schooling, unskilled workers with up Number and Consumer Market SEC E (Urban) to 4 years of schooling, illiterate skilled 2006-07 workers, illiterate petty traders in urban areas Number of Urban 2008-09 number of Urban Households with Annual Consumer Households with Number and income of less than Rs. 75,000 Demography Annual Household 2006-07 income < Rs. 75k Number of Urban 2008-09 Households with Number of Urban Households with Annual Consumer Number and Annual Household income of Rs. 75,000 to Rs.1,50,000 Demography 2006-07 income Rs. 75k- Rs.150k Number of Urban 2008-09 Households with Number of Urban Households with Annual Consumer Number and Annual Household income of Rs. 1,50,000 to Rs.3,00,000 Demography 2006-07 income Rs. 150k- Rs. 300k Number of Urban 2008-09 Households with Number of Urban Households with Annual Consumer Number and Annual Household income of Rs. 3,00,000 to Rs.5,00,000 Demography 2006-07 income Rs. 300k- Rs. 500k Number of Urban 2008-09 Households with Number of Urban Households with Annual Consumer Number and Annual Household income of Rs. 5,00,000 to Rs.10,00,000 Demography 2006-07 income Rs. 500k- Rs. 1,000k Number of Urban 2008-09 Number of Urban Households with Annual Consumer Households with Number and income above Rs. 10,00,000 Demography Annual Household 2006-07 income > Rs.1,000k Number of Urban 2008-09 Number of Urban Households with Annual Consumer Households with Number and income above Rs.3,00,000 Demography Annual Household 2006-07 income > Rs.300k 2008-09 Consumer Total Number of Number and Total Urban Households Demography Urban Households 2006-07 Urban Population in 2008-09 Urban Population in households with Annual Consumer households with Number and income of less than Rs. 75,000 Demography Annual income of < 2006-07 Rs. 75k Urban Population in 2008-09 Urban Population in households with Annual Consumer households with Number and income of Rs. 75,000 to Rs.1,50,000 Demography Annual income of Rs. 2006-07 75k to Rs.150k
- 5. Urban Population in 2008-09 Urban Population in households with Annual Consumer households with Number and income of Rs. 1,50,000 to Rs.3,00,000 Demography Annual income of Rs. 2006-07 150k to Rs.300k Urban Population in 2008-09 Urban Population in households with Annual Consumer households with Number and income of Rs. 3,00,000 to Rs.5,00,000 Demography Annual income Rs. 2006-07 300k- Rs. 500k Urban Population in 2008-09 Urban Population in households with Annual Consumer households with Number and income of Rs. 5,00,000 to Rs.10,00,000 Demography Annual income Rs. 2006-07 500k- Rs. 1,000k Urban Population in 2008-09 Urban Population in households with Annual Consumer households with Number and income above Rs.10,00,000 Demography Annual income > 2006-07 Rs.1,000k Urban Population in 2008-09 Urban Population in households with Annual Consumer households with Number and income above Rs.3,00,000 Demography Annual income > 2006-07 Rs.300k 2008-09 Consumer Number and Urban Population in total Urban households Urban Population Demography 2006-07 Annual Per capita Annual disposable income (in Rs. ‘000) of all 2008-09 Income of Urban urban households with income category of Rs. and Consumer Market Households with annual income of less than Rs. 75,000 2006-07 Annual income of < divided by population in that income category Rs. 75k Annual disposable income (in Rs. ‘000) of all Annual Per capita 2008-09 urban households with income category of Income of Urban Rs. and annual income between Rs. 75,000 and Consumer Market Households with 2006-07 1,50,000 divided by population in that income Annual income of Rs. category 75k to Rs.150k Annual disposable income (in Rs. ‘000) of all Annual Per capita 2008-09 urban households with income category of Income of Urban Rs. and annual income between Rs.1,50,000 and Consumer Market Households with 2006-07 Rs.3,00,000 divided by population in that Annual income of Rs. income category 150k to Rs.300k
- 6. Annual Per capita Annual disposable income (in Rs. ‘000) of all 2008-09 Income of Urban urban households with income category of Rs. and Consumer Market Households with annual income of Rs. 3,00,000 to Rs.5,00,000 2006-07 Annual income Rs. divided by population in that income category 300k- Rs. 500k Annual Per capita Annual disposable income (in Rs. ‘000) of all 2008-09 Income of Urban urban households with income category of Rs. and Consumer Market Households with annual income Rs. 5,00,000 to Rs.10,00,000 2006-07 Annual income Rs. divided by population in that income category 500k- Rs. 1,000k Annual Per capita Annual disposable income (in Rs. ‘000) of all 2008-09 Income of Urban urban households with income category of Rs. and Consumer Market Households with above Rs.10,00,000 divided by population in 2006-07 Annual income > that income category Rs.1,000k Annual Per capita Annual disposable income (in Rs. ‘000) of all 2008-09 Income of Urban urban households with income category of Rs. and Consumer Market Households with above Rs.3,00,000 divided by population in 2006-07 Annual income > that income category Rs.300k 2008-09 Annual disposable income (in Rs. ‘000) of all Annual Per capita Rs. and urban households divided by urban Consumer Market Income of Urban 2006-07 population Households Annual Per capita Annual net potential saving (in Rs. ‘000) of all 2008-09 Potential Savings of urban households with less than annual Rs. and Consumer Market Urban Households income of less than Rs. 75,000 divided by 2006-07 with Annual income of population in that income category < Rs. 75k Annual Per capita Annual net potential saving (in Rs. ‘000) of all 2008-09 Potential Savings of urban households with annual income Rs. and Consumer Market Urban Households between Rs. 75,000 and 1,50,000 divided by 2006-07 with Annual income of population in that income category Rs. 75k to Rs.150k
- 7. Annual net potential saving (in Rs. ‘000) of all Annual Per capita 2008-09 urban households with income category of Potential Savings of Rs. and annual income between Rs.1,50,000 and Consumer Market Urban Households 2006-07 Rs.3,00,000 divided by population in that with Annual income of income category Rs. 150k to Rs.300k Annual net potential saving (in Rs. ‘000) of all Annual Per capita 2008-09 urban households with income category of Potential Savings of Rs. and annual income between Rs.3,00,000 and Consumer Market Urban Households 2006-07 Rs.5,00,000 divided by population in that with Annual income of income category Rs. 300k to Rs.500k Annual net potential saving (in Rs. ‘000) of all Annual Per capita 2008-09 urban households with income category of Potential Savings of Rs. and annual income between Rs.5,00,000 and Consumer Market Urban Households 2006-07 Rs.10,00,000 divided by population in that with Annual income of income category Rs. 500k to Rs.1,000k Annual Per capita Annual net potential saving (in Rs. ‘000) of all 2008-09 Potential Savings of urban households with income category of Rs. and Consumer Market Urban Households annual income of above Rs.10,00,000 divided 2006-07 with Annual income by population in that income category above Rs.1,000k Annual Per capita Annual net potential saving (in Rs. ‘000) of all 2008-09 Potential Savings of urban households with income category of Rs. and Consumer Market Urban Households annual income of above Rs.3,00,000 divided 2006-07 with Annual income by population in that income category above Rs.300k 2008-09 Annual Per capita Annual net potential saving (in Rs. ‘000) of all Rs. and Consumer Market Potential Savings of urban households divided by population 2006-07 Urban Households
- 8. Annual Per capita Potential Annual potential consumption expenditure (in 2008-09 Consumption Rs. ‘000) of all urban households with annual Rs. and Consumer Market Expenditure of Urban income of less than Rs.75,000 divided by 2006-07 Households with population in that income category Annual income of < Rs. 75k Annual Per capita Potential Annual potential consumption expenditure (in 2008-09 Consumption Rs. ‘000) of all urban households with annual Rs. and Consumer Market Expenditure of Urban income of Rs. 75,000 and 1,50,000 divided by 2006-07 Households with population in that income category Annual income of Rs. 75k to Rs.150k Annual Per capita Potential Annual potential consumption expenditures (in 2008-09 Consumption Rs.‘000) of all urban households with annual Rs. and Consumer Market Expenditure of Urban income of Rs. 1,50,000 and 3,00,000 divided 2006-07 Households with by population in that income category Annual income of Rs. 150k to Rs.300k Annual Per capita Potential Annual potential consumption expenditures (in 2008-09 Consumption Rs. ‘000) of all urban households with annual Rs. and Consumer Market Expenditure of Urban income of Rs. 3,00,000 and 5,00,000 divided 2006-07 Households with by population in that income category Annual income of Rs. 300k to Rs.500k Annual Per capita Potential Annual potential consumption expenditures (in 2008-09 Consumption Rs. ‘000) of all urban households with annual Rs. and Consumer Market Expenditure of Urban income of Rs. 5,00,000 and 10,00,000 divided 2006-07 Households with by population in that income category Annual income of Rs. 300k to Rs.500k
- 9. Annual Per capita Annual potential consumption expenditures (in Potential 2008-09 Rs. ‘000) of all urban households with income Consumption Rs. and category of annual income of above than Consumer Market Expenditure of Urban 2006-07 Rs.10,00,000 divided by population in that Households with income category Annual income > Rs.1,000k Annual Per capita Annual potential consumption expenditures (in Potential 2008-09 Rs. ‘000) of all urban households with income Consumption Rs. and category of annual income of above than Consumer Market Expenditure of Urban 2006-07 Rs.3,00,000 divided by population in that Households with income category Annual income > Rs.300k Annual Per capita 2008-09 Annual potential consumption expenditures (in Potential Rs. and Rs. ‘000) of all urban households divided by Consumer Market Consumption 2006-07 urban population Expenditure of Urban Households Annual Tot. Hhd. 2008-09 Total Annual Household Income of urban Income of Urban Rs. and households with annual income of less than Consumer Market Households with 2006-07 Rs.75,000 Annual income of < Rs. 75k Annual Tot. Hhd. 2008-09 Total Annual Household Income of urban Income of Urban Rs. and households with annual income of Rs.75,000 Consumer Market Households with 2006-07 and 1,50,000 Annual income of Rs. 75k to Rs.150k Annual Tot. Hhd. 2008-09 Total Annual Household Income of urban Income of Urban Rs. and households with annual income of Rs Consumer Market Households with 2006-07 1,50,000 and 3,00,000 Annual income of Rs. 150k to Rs.300k Annual Tot. Hhd. Income of Urban 2008-09 Total Annual Household Income of urban Households with Rs. and households with annual income of Rs Consumer Market Annual income of 2006-07 3,00,000 and 5,00,000 Annual income Rs. 300k- Rs. 500k Annual Tot. Hhd 2008-09 Total Annual Household Income of urban Income of Urban Rs. and households with annual income of Rs Consumer Market Households with 2006-07 5,00,000 and 10,00,000 Annual income Rs. 500k- Rs. 1,000k
- 10. Annual Tot. Hhd 2008-09 Total Annual Household Income of urban Income of Urban Rs. and households with annual income of more than Consumer Market Households with 2006-07 Rs.10,00,000 Annual income > Rs.1,000k Annual Tot. Hhd 2008-09 Total Annual Household Income of urban Income of Urban Rs. and households with annual income of more than Consumer Market Households with 2006-07 Rs.3,00,000 Annual income > Rs.300k 2008-09 Total Annual Household Income of urban Annual Tot. Hhd. Rs. and households with total annual income (in Rs. Consumer Market Income of Urban 2006-07 ’00,000) Households Annual Tot. 2008-09 Total annual potential saving (in Rs. ’00,000) Hhd.Potential Savings Rs. and of all urban households with annual income of Consumer Market of Urban Households 2006-07 less than Rs.75,000 with Annual income of < Rs. 75k Annual Tot. Hhd. 2008-09 Total annual potential saving (in Rs. ’00,000) Potential Savings of Rs. and of all urban households with annual income of Consumer Market Urban Households 2006-07 Rs.75,000 and 1,50,000 with Annual income of Rs. 75k to Rs.150k Annual Tot. Hhd. 2008-09 Total annual potential saving (in Rs. ’00,000) Potential Savings of Rs. and of all urban households with annual income of Consumer Market Urban Households 2006-079 Rs 1,50,000 and 3,00,000 with Annual income of Rs. 150k to Rs.300k Annual Tot. Hhd. 2008-09 Total annual potential saving (in Rs. ’00,000) Potential Savings of Rs. and of all urban households with annual income of Consumer Market Urban Households 2006-07 Rs 3,00,000 and 5,00,000 with Annual income Rs. 300k- Rs. 500k Annual Tot. Hhd. 2008-09 Total annual potential saving (in Rs. ’00,000) Potential Savings of Rs. and of all urban households with annual income of Consumer Market Urban Households 2006-07 Rs 5,00,000 and 10,00,000 with Annual income Rs. 500k- Rs. 1,000k Annual Tot. Hhd. 2008-09 Total annual potential saving (in Rs. ’00,000) Potential Savings of Rs. and of all urban households with annual income of Consumer Market Urban Households 2006-07 more than Rs.10,00,000 with Annual income > Rs.1,000k
- 11. Annual Tot. Hhd. 2008-09 Total annual potential saving (in Rs. ’00,000) Potential Savings of Rs. and of all urban households with annual income of Consumer Market Urban Households 2006-07 more than Rs.3,00,000 with Annual income > Rs.300k 2008-09 Annual Tot. Hhd. Total annual potential saving (in Rs. ’00,000) Rs. and Consumer Market Potential Savings of of all urban households 2006-07 Urban Households Annual Tot. potential Total annual potential consumption 2008-09 Consumption expenditure (in Rs. ’00,000) of all urban Rs. and Consumer Market Expenditure with households with annual income of less than 2006-07 Annual income of < Rs.75,000 Rs. 75k Annual Tot. potential Total annual potential consumption Consumption 2008-09 expenditure (in Rs. ’00,000) of all urban Expenditure of Urban Rs. and Consumer Market households with annual income of Rs.75,000 Households with 2006-07 and 1,50,000 Annual income of Rs. 75k to Rs.150k Annual Tot. potential Total annual potential consumption Consumption 2008-09 expenditure (in Rs. ’00,000) of all urban Expenditure of Urban Rs. and Consumer Market households with annual income of Rs Households with 2006-07 1,50,000 and 3,00,000 Annual income of Rs. 150k to Rs.300k Annual Tot. potential Total annual potential consumption Consumption 2008-09 expenditure (in Rs. ’00,000) of all urban Expenditure of Urban Rs. and Consumer Market households with annual income of Rs Households with 2006-07 3,00,000 and 5,00,000 Annual income of Rs. 300k- Rs. 500k Annual Tot. potential Total annual potential consumption Consumption 2008-09 expenditure (in Rs. ’00,000) of all urban Expenditure of Urban Rs. and Consumer Market households with annual income of Rs Households with 2006-07 5,00,000 and 10,00,000 Annual income of Rs. 500k- Rs. 1,000k Annual Tot. potential Total annual potential consumption Consumption 2008-09 expenditure (in Rs. ’00,000) of all urban Expenditure of Urban Rs. and Consumer Market households with annual income of more than Households with 2006-07 Rs.10,00,000 Annual income of > Rs.1,000k
- 12. Annual Tot. potential Total annual potential consumption Consumption 2008-09 expenditure (in Rs. ’00,000) of all urban Expenditure of Urban Rs. and Consumer Market households with annual income of more than Households with 2006-07 Rs.3,00,000 Annual income of > Rs.300k Annual Tot. potential 2008-09 Total annual potential consumption Consumption Rs. and expenditure (in Rs. ’00,000) of all urban Consumer Market Expenditure of Urban 2006-07 households Households 2008-09 Rural Households Total Number of Rural Households with Consumer Number and with Annual income of Annual income Rs. 75,000 Demography 2006-07 < Rs. 75k 2008-09 Rural Households Number of Rural Households with Annual Consumer Number and with Annual income of income of Rs.75,000 and 1,50,000 Demography 2006-07 Rs. 75k to Rs.150k 2008-09 Rural Households Number of Rural Households with Annual Consumer Number and with Annual income of income of Rs 1,50,000 and 3,00,000 Demography 2006-07 Rs. 150k to Rs.300k 2008-09 Rural Households Number of Rural Households with Annual Consumer Number and with Annual income of income of Rs 3,00,000 and 5,00,000 Demography 2006-07 Rs. 300k- Rs. 500k 2008-09 Rural Households Number of Rural Households with Annual Consumer Number and with Annual income of income of Rs 5,00,000 and 10,00,000 Demography 2006-07 Rs. 500k- Rs. 1,000k 2008-09 Rural Households Number of Rural Households with Annual Consumer Number and with Annual income > income above Rs.10,00,000 Demography 2006-07 Rs.1,000k 2008-09 Rural Households Number of Rural Households with Annual Consumer Number and with Annual income > income above Rs.3,00,000 Demography 2006-07 Rs.300k 2008-09 Consumer Number and Total Rural Households Rural Households Demography 2006-07 2008-09 Rural Population with Rural Population in households with Annual Consumer Number and Annual income of < income less than Rs. 75,000 Demography 2006-07 Rs. 75k 2008-09 Rural Population with Rural Population in households with Annual Consumer Number and Annual income of Rs. income between Rs. 75,000 to Rs.1,50,000 Demography 2006-07 75k to Rs.150k
- 13. 2008-09 Rural Population with Rural Population in households with Annual Consumer Number and Annual income of Rs. income between Rs. 1,50,000 to Rs.3,00,000 Demography 2006-07 150k to Rs.300k 2008-09 Rural Population with Rural Population in households with Annual Consumer Number and Annual income of Rs. income between Rs. 3,00,000 to Rs.5,00,000 Demography 2006-07 300k to Rs.500k 2008-09 Rural Population with Rural Population in households with Annual Consumer Number and Annual income of Rs. income between Rs. 5,00,000 to Rs.10,00,000 Demography 2006-07 500k to Rs.1,000k 2008-09 Rural Population with Rural Population in households with Annual Consumer Number and Annual income above income above Rs.10,00,000 Demography 2006-07 Rs.1,000k 2008-09 Rural Population with Rural Population in households with Annual Consumer Number and Annual income above income above Rs.3,00,000 Demography 2006-07 Rs.300k 2008-09 Consumer Number and Population in total rural households Rural Population Demography 2006-07 Annual Per Capita Annual disposable income (in Rs. ‘000) of all 2008-09 Income in rural rural households with income category of Rs. and Consumer Market households with annual income of less than Rs. 75,000 2006-07 Annual income < Rs. divided by population in that income category 75k Annual disposable income (in Rs. ‘000) of all Annual Per Capita 2008-09 rural households with income category of Income in rural Rs. and annual income between Rs. 75,000 and Consumer Market households with 2006-07 1,50,000 divided by population in that income Annual income Rs. category 75k to Rs.150k Annual disposable income (in Rs. ‘000) of all Annual Per Capita 2008-09 rural households with income category of Income in rural Rs. and annual income between Rs.1,50,000 and Consumer Market households with 2006-07 Rs.3,00,000 divided by population in that Annual income Rs. income category 150k to Rs.300k
- 14. Annual disposable income (in Rs. ‘000) of all Annual Per capita 2008-09 rural households with income category of Income of Rural Rs. and annual income between Rs.3,00,000 and Consumer Market Households with 2006-07 Rs.5,00,000 divided by population in that Annual income Rs. income category 300k- Rs. 500k Annual disposable income (in Rs. ‘000) of all Annual Per capita 2008-09 rural households with income category of Income of Rural Rs. and annual income between Rs.5,00,000 and Consumer Market Households with 2006-07 Rs.10,00,000 divided by population in that Annual income Rs. income category 500k- Rs. 1,000k Annual Per capita Annual disposable income (in Rs. ‘000) of all 2008-09 Income of Rural rural households with income category of Rs. and Consumer Market Households with annual income of above than Rs.10,00,000 2006-07 Annual income > divided by population in that income category Rs.1,000k Annual Per capita Annual disposable income (in Rs. ‘000) of all 2008-09 Income of Rural rural households with income category of Rs. and Consumer Market Households with annual income of above Rs.3,00,000 divided 2006-07 Annual income > by population in that income category Rs.300k 2008-09 Annual Per Capita Annual disposable income (in Rs. ‘000) of all Rs. and Consumer Market Income in total rural rural households divided by rural population 2006-07 households Annual Per Capita Annual net potential saving (in Rs. ‘000) of all 2008-09 Potential Saving in rural households with less than annual Rs. and Consumer Market rural households with income of less than Rs. 75,000 divided by 2006-07 Annual income < Rs. population in that income category 75k
- 15. Annual Per Capita Annual net potential saving (in Rs. ‘000) of all 2008-09 Potential Saving in rural households with annual income between Rs. and Consumer Market rural households with Rs. 75,000 and 1,50,000 divided by 2006-07 Annual income Rs. population in that income category 75k to Rs.150k Annual net potential saving (in Rs. ‘000) of all Annual Per Capita 2008-09 rural households with income category of Potential Saving in Rs. and annual income between Rs.1,50,000 and Consumer Market rural households with 2006-07 Rs.3,00,000 divided by population in that Annual income Rs. income category 150k to Rs.300k Annual net potential saving (in Rs. ‘000) of all Annual Per Capita 2008-09 rural households with income category of Potential Saving in Rs. and annual income between Rs.3,00,000 and Consumer Market rural households with 2006-07 Rs.5,00,000 divided by population in that Annual income Rs. income category 300k to Rs.500k Annual net potential saving (in Rs. ‘000) of all Annual Per Capita 2008-09 rural households with income category of Potential Saving in Rs. and annual income between Rs.5,00,000 and Consumer Market rural households with 2006-07 Rs.10,00,000 divided by population in that Annual income Rs. income category 500k to Rs.1,000k Annual Per Capita Annual net potential saving (in Rs. ‘000) of all 2008-09 Potential Saving in rural households with income category of Rs. and Consumer Market rural households with annual income of above Rs.10,00,000 divided 2006-07 Annual income by population in that income category >1,000k Annual Per Capita Annual net potential saving (in Rs. ‘000) of all 2008-09 Potential Saving in rural households with income category of Rs. and Consumer Market rural households with annual income of above Rs.3,00,000 divided 2006-07 Annual income by population in that income category >Rs.300k
- 16. 2008-09 Annual Per Capita Annual net potential saving (in Rs. ‘000) of all Rs. and Consumer Market Potential Saving in rural households divided by population 2006-07 total rural households Annual Per Capita Annual potential consumption expenditure (in 2008-09 Potential Expenditure Rs. ‘000) of all rural households with annual Rs. and Consumer Market in rural households income of less than Rs.75,000 divided by 2006-07 with Annual income < population in that income category Rs. 75k Annual Per Capita Annual potential consumption expenditure (in 2008-09 Potential Expenditure Rs. ‘000) of all rural households with annual Rs. and Consumer Market in rural households income of Rs. 75,000 and 1,50,000 divided by 2006-07 with Annual income population in that income category Rs. 75k to Rs.150k Annual Per Capita Annual potential consumption expenditure (in 2008-09 Potential Expenditure Rs. ‘000) of all rural households with annual Rs. and Consumer Market in rural households income of Rs. 1,50,000 and 3,00,000 divided 2006-07 with Annual income by population in that income category Rs. 150k to Rs.300k Annual per capita Annual potential consumption expenditure (in 2008-09 Potential Expenditure Rs. ‘000) of all rural households with annual Rs. and Consumer Market in rural households income of Rs. 3,00,000 and 5,00,000 divided 2006-07 with Annual income by population in that income category Rs. 300k- Rs. 500k Annual per capita Annual potential consumption expenditure (in 2008-09 Potential Expenditure Rs. ‘000) of all rural households with annual Rs. and Consumer Market in rural households income of Rs. 5,00,000 and 10,00,000 divided 2006-07 with Annual income by population in that income category Rs. 500k- Rs. 1,000k
- 17. Annual potential consumption expenditure (in Annual per capita 2008-09 Rs. ‘000) of all rural households with income Potential Expenditure Rs. and category of annual income of above Consumer Market in rural Households 2006-07 Rs.10,00,000 divided by population in that with Annual income > income category Rs.1,000k Annual potential consumption expenditure (in Annual per capita 2008-09 Rs. ‘000) of all rural households with income Potential Expenditure Rs. and category of annual income of above Consumer Market in rural Households 2006-07 Rs.3,00,000 divided by population in that with Annual income > income category Rs.300k Annual Per Capita 2008-09 Annual potential consumption expenditure (in Potential Expenditure Rs. and Rs. ‘000) of all rural households divided by Consumer Market in total rural 2006-07 rural population households Annual Tot. Hhd. 2008-09 Annual Tot. Household Income in rural Income of rural Rs. and households with Annual income less than Rs. Consumer Market households with 2006-07 75,000 Annual income of < Rs. 75k Annual Tot. Hhd. 2008-09 Annual Tot. Household Income in rural Income of rural Rs. and households with Annual income Rs. 75,000 to Consumer Market households with 2006-07 Rs.1,50,000 Annual income of Rs. 75k to Rs.150k Annual Tot. Hhd. 2008-09 Annual Tot. Household Income in rural Income of rural Rs. and households with Annual income Rs 1,50,000 Consumer Market households with 2006-07 and 3,00,000 Annual income of Rs. 150k to Rs.300k Annual Tot. Hhd. 2008-09 Annual Tot. Household Income in rural Income of Rural Rs. and households with Annual income Rs 3,00,000 Consumer Market Households with 2006-07 and 5,00,000 Annual income Rs. 300k- Rs. 500k Annual Tot. Hhd. 2008-09 Annual Tot. Household Income in rural Income of Rural Rs. and households with Annual income Rs 5,00,000 Consumer Market Households with 2006-07 and 10,00,000 Annual income Rs. 500k- Rs. 1,000k
- 18. Annual Tot. Hhd. 2008-09 Annual Tot. Household Income in rural Income of Rural Rs. and households with Annual income above Rs. Consumer Market Households with 2006-07 10,00,000 Annual income > Rs.1,000k Annual Tot. Hhd. 2008-09 Annual Tot. Household Income in rural Income of Rural Rs. and households with Annual income above Rs. Consumer Market Households with 2006-07 3,00,000 Annual income > Rs.300k 2008-09 Annual Tot. Hhd. Annual Tot. Household Income in total rural Rs. and Consumer Market Income of rural households 2006-07 households Annual Tot. Hhd. 2008-09 Annual Tot. Potential Household Saving in Potential Savings of Rs. and rural households with Annual income less Consumer Market rural households with 2006-07 than Rs. 75,000 Annual income of < Rs. 75k Annual Tot. Hhd. 2008-09 Annual Tot. Potential Household Saving in Potential Savings of Rs. and rural households with Annual income Rs. Consumer Market rural households with 2006-07 75,000 to Rs.1,50,000 Annual income of Rs. 75k to Rs.150k Annual Tot. Hhd. 2008-09 Annual Tot. Potential Household Saving in Potential Savings of Rs. and rural households with Annual income Rs Consumer Market rural households with 2006-07 1,50,000 and 3,00,000 Annual income of Rs. 150k to Rs.300k Annual Tot. Hhd. 2008-09 Annual Tot. Potential Household Saving in Potential Savings of Rs. and rural households with Annual income Rs Consumer Market Rural Households 2006-07 3,00,000 and 5,00,000 with Annual income Rs. 300k- Rs. 500k Annual Tot. Hhd. 2008-09 Annual Tot. Potential Household Saving in Potential Savings of Rs. and rural households with Annual income Rs Consumer Market Rural Households 2006-07 5,00,000 and 10,00,000 with Annual income Rs. 500k- Rs. 1,000k Annual Tot. Hhd. 2008-09 Annual Tot. Potential Household Saving in Potential Savings of Rs. and rural households with Annual income above Consumer Market Rural Households 2006-07 Rs. 10,00,000 with Annual income > Rs.1,000k Annual Tot. Hhd. 2008-09 Annual Tot. Potential Household Saving in Potential Savings of Rs. and rural households with Annual income above Consumer Market Rural Households 2006-07 Rs. 3,00,000 with Annual income > Rs.300k 2008-09 Annual Tot. Hhd. Annual Tot. Potential Household Saving in Rs. and Consumer Market Potential Savings of total rural households 2006-07 rural households
- 19. Annual Tot. Potential Consumption 2008-09 Annual Tot. Potential Consumption Expenditure of rural Rs. and Expenditure in rural households with Annual Consumer Market households with 2006-07 income less than Rs. 75,000 Annual income of < Rs. 75k Annual Tot. Potential Consumption 2008-09 Annual Tot. Potential Consumption Expenditure of rural Rs. and Expenditure in rural households with Annual Consumer Market households with 2006-07 income Rs. 75,000 to Rs.1,50,000 Annual income of Rs. 75k to Rs.150k Annual Tot. Potential Consumption 2008-09 Annual Tot. Potential Consumption Expenditure of rural Rs. and Expenditure in rural households with Annual Consumer Market households with 2006-07 income Rs 1,50,000 and 3,00,000 Annual income of Rs. 150k to Rs.300k Annual Tot. Potential Consumption 2008-09 Annual Tot. Potential Consumption Expenditure of rural Rs. and Expenditure in rural households with Annual Consumer Market households with 2006-07 income Rs 3,00,000 and 5,00,000 Annual income of Rs. 300k- Rs. 500k Annual Tot. Potential Consumption 2008-09 Annual Tot. Potential Consumption Expenditure of rural Rs. and Expenditure in rural households with Annual Consumer Market households with 2006-07 income Rs 5,00,000 and 10,00,000 Annual income of Rs. 500k- Rs. 1,000k Annual Tot. Potential Consumption 2008-09 Annual Tot. Potential Consumption Expenditure of rural Rs. and Expenditure in rural households with Annual Consumer Market households with 2006-07 income above Rs.10,00,000 Annual income of > Rs.1,000k Annual Tot. Potential Consumption 2008-09 Annual Tot. Potential Consumption Expenditure of rural Rs. and Expenditure in rural households with Annual Consumer Market households with 2006-07 income above Rs.3,00,000 Annual income of > Rs.300k Annual Tot. Potential 2008-09 Annual Tot. Potential Consumption Consumption Rs. and Consumer Market Expenditure in total rural households Expenditure of rural 2006-07 households Square 2001 Total Geographical Area Area Geographical Area Kilometre 2008-09 Consumer Number and Total number of Individuals Population Demography 2006-07 % 2006-08 Urban growth Rate of Income Growth Rate Growth rate between annual total income of Urban households between 2006-07 &
- 20. 2008-09 Growth rate between annual total Urban growth Rate of Potential Expenditure expenditure of urban households between % 2006-08 Growth Rate 2006-07 & 2008-09 Growth rate between annual total saving of Urban growth Rate of Potential Savings urban households between 2006-07 & % 2006-08 Growth Rate 2008-09 Growth rate between annual total income of Rural growth rate of Income rural households between 2006-07 & % 2006-08 Growth Rate 2008-09 Growth rate between annual total Rural growth rate of Potential Expenditure expenditure of rural households between % 2006-08 Growth Rate 2006-07 & 2008-09 Growth rate between annual total saving of Rural growth rate of Potential Savings rural households between 2006-07 & % 2006-08 Growth Rate 2008-09 The Region Classifications are as follows West Includes Rajasthan, Gujarat, MP, Goa and Maharashtra East includes Chhatisgarh, Orissa, Bihar, Jharkand, West Bengal, Sikkim and NE states South includes A&N, Lakshwadeep, AP, TN, Kerala, Pondicherry and Karnataka North includes UP, Uttaranchal, Delhi, Haryana, Punjab, J&K, HP
- 21. The districts Alpha Districts State District State District State District Delhi Delhi West Bengal Hugli Maharashtra Nanded Mumbai Andhra Maharashtra (Suburban) Pradesh Krishna Chhattisgarh Raipur Andhra Maharashtra Thane Haryana Gurgaon Pradesh West Godavari Karnataka Bangalore Rajasthan Jaipur Karnataka Belgaum Maharashtra Pune West Bengal Murshidabad Chandigarh Chandigarh Maharashtra Mumbai Gujarat Rajkot Punjab Amritsar Andhra Gujarat Ahmadabad Pradesh East Godavari Maharashtra Ahmadnagar Tamil Nadu Chennai West Bengal Haora Kerala Thiruvananthapuram Andhra Gujarat Surat Pradesh Guntur Maharashtra Raigarh North 24 West Bengal Parganas Maharashtra Jalgaon Uttar Pradesh Kanpur Nagar West Bengal Kolkata Haryana Faridabad Kerala Ernakulam West Bengal Medinipur Gujarat Bhavnagar Jharkhand Ranchi Andhra Andhra Pradesh Hyderabad West Bengal Jalpaiguri Pradesh Kurnool Andhra West Bengal Barddhaman West Bengal Nadia Pradesh Karimnagar South 24 West Bengal Parganas Maharashtra Kolhapur Kerala Malappuram Tamil Nadu Coimbatore Punjab Ludhiana Maharashtra Aurangabad Andhra Andhra Maharashtra Nagpur Pradesh Visakhapatnam Pradesh Nellore Andhra Maharashtra Nashik Tamil Nadu Thiruvallur Pradesh Chittoor Gujarat Vadodara Gujarat Jamnagar Chhattisgarh Durg Andhra Andhra Pradesh Rangareddi Maharashtra Solapur Pradesh Anantapur
- 22. Beta Districts State District State District State District Tamil Nadu Salem Bihar Patna Kerala Idukki West Bengal Birbhum Punjab Gurdaspur West Bengal Uttar Dinajpur Karnataka Gulbarga Uttar Pradesh Agra Rajasthan Jodhpur Andhra Andhra Tamil Nadu Erode Pradesh Khammam Pradesh Srikakulam Andhra Pradesh Warangal Gujarat Surendranagar Jharkhand Purbi Singhbhum Andhra Tamil Nadu Vellore Pradesh Adilabad Gujarat Banas Kantha Goa North Goa Tamil Nadu Tiruchirappalli Orissa Mayurbhanj Andhra Pradesh Prakasam Kerala Palakkad Haryana Yamunanagar Gujarat Junagadh Orissa Khordha Rajasthan Udaipur Gujarat Valsad Tamil Nadu Kanniyakumari Jharkhand Bokaro Tamil Nadu Kancheepuram Tamil Nadu Virudhunagar Kerala Alappuzha Karnataka Mysore Orissa Cuttack Uttar Pradesh Bijnor Maharashtra Satara Jharkhand Dhanbad Maharashtra Buldana Kerala Kozhikode Kerala Kollam Tamil Nadu Cuddalore Uttar Pradesh Ghaziabad Haryana Sonipat Tamil Nadu Viluppuram Andhra Pradesh Medak Gujarat Bharuch Karnataka Bangalore Rural Maharashtra Sangli Uttar Pradesh Kheri Uttar Pradesh Aligarh Kerala Thrissur Gujarat Kheda Tamil Nadu Thoothukkudi Tamil Nadu Madurai West Bengal Darjiling Gujarat Anand Gujarat Kachch Maharashtra Yavatmal Chhattisgarh Bilaspur Madhya Pradesh Indore Kerala Wayanad Uttaranchal Hardwar Pashchimi Andhra Pradesh Mahbubnagar Uttar Pradesh Bulandshahr Jharkhand Singhbhum West Bengal Bankura Uttar Pradesh Bareilly Gujarat Sabar Kantha Jammu & Andhra Pradesh Nalgonda Tamil Nadu Thanjavur Kashmir Jammu West Bengal Maldah Jharkhand Hazaribag Haryana Sirsa Punjab Jalandhar Gujarat Amreli Maharashtra Latur Dakshina Karnataka Kannada Rajasthan Alwar West Bengal Puruliya Andhra Maharashtra Amravati Haryana Ambala Pradesh Vizianagaram Orissa Ganjam Uttar Pradesh Moradabad Punjab Firozpur Himachal Tamil Nadu Tirunelveli Karnataka Dharwad Pradesh Kangra West Bengal Koch Bihar Kerala Kannur Maharashtra Akola Andhra Pradesh Cuddapah Gujarat Mahesana Karnataka Shimoga Uttar Pradesh Muzaffarnagar Haryana Karnal Karnataka Bagalkot Madhya Punjab Sangrur Karnataka Tumkur Pradesh East Nimar Assam Kamrup Maharashtra Chandrapur Maharashtra Bid Uttar Pradesh Allahabad Tamil Nadu Dharmapuri Gujarat Gandhinagar Uttar Pradesh Meerut Karnataka Bellary Rajasthan Sikar Andhra Haryana Hisar Pradesh Nizamabad Goa South Goa Uttar Pradesh Lucknow Karnataka Kolar Uttar Pradesh Gorakhpur Jammu & Punjab Patiala Haryana Panipat Kashmir Srinagar