Coverage in premium version of City Skyline of India

The City Skyline of India, 2008-09 provides information on different kinds of consumers, market sizes, their income, savings and expenditure patterns. The top 112 cities are also ranked on the basis of “Economy” and “Reside in” indices. It also comprises people’s perception about their cities on education, health facilities, environment, entertainment and public facilities captured through a survey. The product covers demography, age distribution, consumer markets – assets owned, socio economic classifications, consumer psychographics, income categories, earning potential, education, housing, safety, entertainment, environment, health, among others. Your requirements of Consumer Market Research are addressed very effectively. The City Skyline of India is your key Market Research Resource for Urban India.

Recomendados
Recomendados
Mais conteúdo relacionado
Mais de Indicus Analytics Private Limited
Mais de Indicus Analytics Private Limited (20)
Último
Último (20)
Coverage in premium version of City Skyline of India
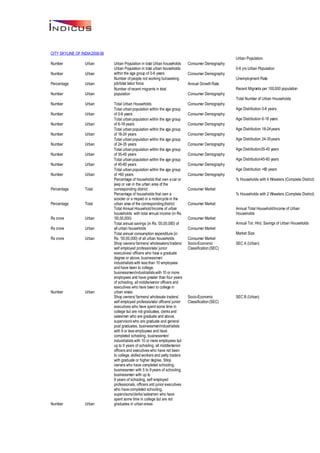
- 1. CITY SKYLINE OF INDIA 2008-09 Urban Population Number Urban Urban Population in total Urban households Consumer Demography Urban Population in total urban households 0-6 yrs Urban Population Number Urban within the age group of 0-6 years Consumer Demography Number of people not working but seeking Unemployment Rate Percentage Urban job/total labor force Annual Growth Rate Number of recent migrants in total Recent Migrants per 100,000 population Number Urban population Consumer Demography Total Number of Urban Households Number Urban Total Urban Households Consumer Demography Total urban population within the age group Age Distribution 0-6 years Number Urban of 0-6 years Consumer Demography Total urban population within the age group Age Distribution 6-18 years Number Urban of 6-18 years Consumer Demography Total urban population within the age group Age Distribution 18-24 years Number Urban of 18-24 years Consumer Demography Total urban population within the age group Age Distribution 24-35 years Number Urban of 24-35 years Consumer Demography Total urban population within the age group Age Distribution35-45 years Number Urban of 35-45 years Consumer Demography Total urban population within the age group Age Distribution45-60 years Number Urban of 45-60 years Consumer Demography Total urban population within the age group Age Distribution >60 years Number Urban of >60 years Consumer Demography Percentage of households that own a car or % Households with 4 Wheelers (Complete District) jeep or van in the urban area of the Percentage Total corresponding district Consumer Market Percentage of households that own a % Households with 2 Wheelers (Complete District) scooter or a moped or a motorcycle in the Percentage Total urban area of the corresponding district Consumer Market Total Annual Household Income of urban Annual Total Household Income of Urban households with total annual income (in Rs. Households Rs crore Urban ’00,00,000) Consumer Market Total annual savings (in Rs. ’00,00,000) of Annual Tot. Hhd. Savings of Urban Households Rs crore Urban all urban households Consumer Market Total annual consumption expenditure (in Market Size Rs crore Urban Rs. ’00,00,000) of all urban households Consumer Market Shop owners/ farmers/ wholesalers/ traders/ Socio-Economic SEC A (Urban) self employed professionals/ junior Classification (SEC) executives/ officers who hav a graduate e degree or above, businessmen/ industrialists with less than 10 employees and have been to college, businessmen/industrialists with 10 or more employees and have greater than four years of schooling, all middle/senior officers and executives who have been to college in Number Urban urban areas Shop owners/ farmers/ wholesale traders/ Socio-Economic SEC B (Urban) self employed professionals/ officers/ junior Classification (SEC) executives who have spent some time in college but are not graduates, clerks and salesmen who are graduate and above, supervisors who are graduate and general post graduates, businessmen/industrialists with 9 or less employees and have completed schooling, businessmen/ industrialists with 10 or more employees but up to 9 years of schooling, all middle/senior officers and executives who have not been to college, skilled workers and petty traders with graduate or higher degree, Shop owners who have completed schooling, businessmen with 5 to 9 years of schooling, businessmen with up to 9 years of schooling, self employed professionals, officers and junior executives who have completed schooling, supervisors/clerks/ salesmen who have spent some time in college but are not Number Urban graduates in urban areas
- 2. Skilled workers and petty traders with Socio-Economic SEC C (Urban) greater than 9 years of schooling but not Classification (SEC) graduates, shop owners/ farmers/ wholesalers/ traders with 5 to 9 years of schooling, illiterate business men with 1 to 9 employees, businessmen with no employees but up to 4 years of schooling, clerks and salesmen who have completed schooling, supervisors with greater than five years of schooling but not college, officers and junior executives with up to 9 years of Number Urban schooling in urban areas Unskilled workers with greater than 9 years Socio-Economic SEC D (Urban) of schooling, skilled workers with 5 to 9 Classification (SEC) years of schooling, literate petty traders with up to 9 years of schooling, shop owners/farmers or wholesale traders with up to four years of schooling, self employed with no employees, self employed with up to 9 years of schooling, Clerks and salesmen with up to 9 years of schooling, Supervisors with up to 4 years of schooling in urban Number Urban areas Unskilled workers with 5 to 9 years of Socio-Economic SEC E (Urban) schooling, skilled workers with up to four Classification (SEC) years of schooling, unskilled workers with up to 4 years of schooling, illiterate skilled workers, illiterate petty traders Number Urban in urban areas Ratio of people in age group 15 to 24 to Youthfullness Index Index Urban total population Psychographics Index Ratio of total number of (including non- Experimentation Index indian food) restaurants in a city to total Index Urban population in a city. Psychographics Index Ratio of English newspapers and Westernised index newsmagazines sold to number of vernacular newspapers and Index Urban magazines sold in the city. Psychographics Index Variation of circulation of newspapers of Cosmopolitan index various northern, eastern, southern, and Index Urban western languages. Psychographics Index Ratio of females to males Gender Inequlity Index Urban Psychographics Index Annualized Population Growth Rate Annual Exponential Population Growth Rate between 1991 and 2001 in the Percentage Urban corresponding urban district Annual Growth rate Annualized Employment Growth Rate Employment Growth Rate between 1991 and 2001 in the Percentage Urban corresponding urban district Annual Growth rate This is the real compounded annualized Credit Growth Rate growth rate of credit (after correcting for inflation) of all scheduled commercial banks between the years 2001 and 2006 in the Percentage Urban urban area of the corresponding district. Annual Growth rate This is the real compounded annualized Deposit Growth Rate growth rate of debit (after correcting for inflation) of all scheduled commercial banks between the years 2001 and 2006 in the Percentage Urban urban area of the corresponding district. Annual Growth rate Compounded annual growth of Market size Market_Size Growth Rate 2006-08 Percentage Total over the given years Annual Growth rate Reflects the economic conditions in a Rankings based on quot;Economyquot; Index particular city, opportunities to start a new Relative City Ranking Rank Urban business, investment etc within each City category Reflects a city's suitability for residing based Rankings based on quot;Reside-Inquot; Index on the following Sub-heads: Health, Education, Environment, Safety, Public Facilities, Entertainment and Relative City Ranking Rank Urban Housing . within each City category Number of Urban Households with Annual Number of Urban Households with Annual Income Distribution Number Urban income of less than Rs. 75,000 Household income < Rs. 75k Number of Urban Households with Annual Number of Urban Households with Annual Income Distribution Number Urban income of Rs. 75,000 to Rs.1,50,000 Household income Rs. 75k- Rs.150k Number of Urban Households with Annual Number of Urban Households with Annual Income Distribution Number Urban income of Rs. 1,50,000 to Rs.3,00,000 Household income Rs. 150k- Rs. 300k
- 3. Number of Urban Households with Annual Number of Urban Households with Annual Income Distribution Number Urban income of Rs. 3,00,000 to Rs.5,00,000 Household income Rs. 300k- Rs. 500k Number of Urban Households with Annual Number of Urban Households with Annual Income Distribution Number Urban income of Rs. 5,00,000 to Rs.10,00,000 Household income Rs. 500k- Rs. 1,000k Number of Urban Households with Annual Number of Urban Households with Annual Income Distribution Number Urban income above Rs. 10,00,000 Household income > Rs.1,000k Total Number of Urban Households Total Urban Households Income Distribution Number Urban Number of people working divided by the Employment Rate total workforce for the year 2001 in the corresponding district Percentage Urban urban area. Earning Annual disposable income (in Rs) of all Annual Per capita Income of Urban Households urban households divided by urban Rs Urban population Earning Annual net saving (in Rs) of all urban Annual Per capita Savings of Urban Households Rs Urban households divided by population Earning Ratio of credit to deposit for the year 2006 Financial & Human Capital Credit to Deposit ratio Ratio Urban in the corresponding district’s urban are a. Flows Percentage of recent migrants of 1-9 years Financial & Human Capital % Recent migrants of 1-9 years Percentage Urban Flows Migrants less than 1 -9yrs as a share of Financial & Human Capital Migrants less than 1 year-9yrs as a share of total Number Urban total population(urban) Flows population(urban) Percentage of recent migrants(1-4yrs)in all Financial & Human Capital % Recent migrants of all migrants Percentage Urban migrants(last 10 yrs) Flows Percentage of households electrified in the Households Electrified corresponding Percentage Urban district’s urban area. Utilities & Transport Murders as a percentage of total cognizable Murders as % of Total crime crimes for the year 2006 in the Percentage Total district corresponding distric Safety Crime against women (rapes, sexual Crime against women as % of Total crime harassment,molestation, abduction, dowry deaths etc) as a percentage of total cognizable crime for the year 2005 in the Percentage Total district corresponding district Safety Total theft and robbery as a percentage of Theft & robbery as % of Total crime total cognizable crime for the year 2006 in Percentage Total district the corresponding district. Safety Total number of users actively using Total Number of Internet Users number Urban Internet Entertainment number of Readership of Newspaper Circulation of dailies(english) newspapers(origin ating+incoming) Urban Entertainment number of Readership of Newspaper Circulation of dailies(gujarati) newspapers(origin ating+incoming) Urban Entertainment number of Readership of Newspaper Circulation of dailies(assamese) newspapers(origin ating+incoming) Urban Entertainment number of Readership of Newspaper Circulation of dailies(oriya) newspapers(origin ating+incoming) Urban Entertainment number of Readership of Newspaper Circulation of dailies(bengali) newspapers(origin ating+incoming) Urban Entertainment number of Readership of Newspaper Circulation of dailies(malayali) newspapers(origin ating+incoming) Urban Entertainment number of Readership of Newspaper Circulation of dailies(hindi) newspapers(origin ating+incoming) Urban Entertainment number of Readership of Newspaper Circulation of dailies(marathi) newspapers(origin ating+incoming) Urban Entertainment number of Readership of Newspaper Circulation of dailies(kannad) newspapers(origin ating+incoming) Urban Entertainment number of Readership of Newspaper Circulation of dailies(punjabi) newspapers(origin ating+incoming) Urban Entertainment number of Readership of Newspaper Circulation of dailies(urdu) newspapers(origin ating+incoming) Urban Entertainment number of Urban Readership of Newspaper Entertainment Circulation of dailies(Telegu) newspapers(origin
- 4. ating+incoming) number of Readership of Newspaper Circulation of dailies(Tamil) newspapers(origin ating+incoming) Urban Entertainment Total Workers Number Urban Total number of urban workers Consumer Demography Small business credit Financial & Human Capital Amount Outstanding:Artisans and Village & Tiny Rs thousands Total district Flows Industries Small business credit Financial & Human Capital Amount Outstanding: Other Small Scale Industries Rs thousands Total district Flows Sum of credit to Artisans and Village & Tiny Financial & Human Capital Total amount outstanding(small business) Rs thousands Total district Industries and Other Small Scale Industries Flows Number of bank accounts in small business Financial & Human Capital Number of Accounts: Artisans and Village & Tiny Number Total district category credit Flows Industries Number of bank accounts in small business Financial & Human Capital Number of Accounts: Other Small Scale Industries Number Total district category credit Flows No. of murders Number Districtwise Total number of murder cases Safety No. of rapes Number Districtwise Total number of rape cases Safety No. of molestation Number Districtwise Total number of molestation cases Safety No. of sexual harrasment Number Districtwise Total number of sexual harrasment Safety No. of Thefts Number Districtwise Total number of theft cases Safety No. of Roberry Number Districtwise Total number of robbery cases Safety Total Cognizable IPC crime Total Cognizable IPC crime Number Districtwise Safety Percentage of children of age 12-35 months Children age 12-35 months received Full Percentage Urban receiving full immunization Health Immunization Total surfaced roads in the town or for the Total Road Length in km Urban corresponding district Public Facilities Total bank offices in urban district Financial and Human Bank Offices Number Urban Capital Flows Total number of housing loan accounts in Number of Housing Loan accounts Number Urban the corresponding urban district Public Facility Total Number of Owned Households in the Total Number of Owned Households Number Urban corresponding urban district Public Facility Total Number of Rented Households in the Total Number of Rented Households Number Urban corresponding urban district Public Facility Total Number of Other Households in the Total Number of Others Households Number Urban corresponding urban district Public Facility Annual Growth rate of Housing Loan Annualized Growth rate of Housing Loan accounts Percentage Urban accounts Public Facility Total number of workers in secondary Total number of workers in secondary sector Number Urban sector in the corresponding urban district Consumer Demography Total number of workers in tertiary sector in Total number of workers in tertiary sector Number Urban the corresponding urban district Consumer Demography Slum population of the district Slum Population Number District Consumer Demography Number of hospitals offering cashless No of hospitals offering cashless facilities Number Urban facilities in the corresponding urban district Health Under 5 mortality rate Percentage Total Under-five mortality rate Health Percentages of women receiving 3 or more % Antinatal check ups 3+ Percentage Total Antinatal visits Health Percentage of women receiving at least 2 Atleast 2TT injections Percentage Total TT injections Health % immunization drop out Percentage Total Percentage dropout from full immunization Health Contraceptive Prevalence Rat e Contraceptive Prevalence Rat e Percentage Total Health Annual Growth Rate of Consumer Price Growth Rate of Consumer Price Index for Housing Index for Housing in the corresponding Percentage urban districts Public Facility A measure of changes over time in the Consumer Price Index for Housing general level of prices of goods and services (housing), which the private Index consumer buys or pays for. Public Facility Number Urban Total number of job advertisement per 1 Earning Job ads with minimum 0-1 year experience lakh population in the corresponding urben
- 5. district % Urban Earning Much worse Somewhat % Urban Earning worse % Urban Earning Similar Somewhat % Urban Dweller's perception of buiding a Earning Dweller's perception of buiding better business/professional career vis-à-vis other a business/professional career % Urban cities Earning vis-à-vis other cities Much better Percentage literates in total population in % Urban the corresponding urban district Education Literacy rate Total number of AICTE approved MBA Number Urban seats per lakh population Education MBA seats Total number of AICTE approved Number Urban Engineering seats per lakh population Education Engg. Seats Dweller perception of adequacy of good Dweller perception of on the need of better quality Response Urban schools Education schools Dweller perception of on the need of better quality Response Urban Dweller perception of on the need of better quality colleges colleges % Urban Education Much worse Somewhat % Urban Education worse % Urban Education Similar Somewhat % Urban Education Dweller's perception of quality better Dweller's perception of quality of best of best school vis-à-vis other % Urban school vis-à-vis other cities Education cities Much better Most Dwellers' Perception of: water supply Response Urban in a day Public Facility Most Dwellers' Perception of: water supply in a day Response Urban Average duration of power cut per day Public Facility Average duration of power cut per day Response Urban Most frequently public transport used Public Facility Most frequently public transport used 75 to 100% of % Urban Utilities & Transport the time 50 to 75% of % Urban Utilities & Transport the time 25 to 50% of % Urban Utilities & Transport the time < 25% of the % Urban Utilities & Transport time Dweller's perception of haggling with Dweller's perception of % Urban Taxi/Auto Walla Utilities & Transport haggling with Taxi/Auto Walla Don’t know % Urban Utilities & Transport Taxi % Urban Utilities & Transport Auto % Urban Utilities & Transport Buses % Urban Utilities & Transport Rickshaws Train (Local Dweller's usage of public train, metro or % Urban Dweller's usage of public transport Utilities & Transport transport Tram) Response Urban Dwellers perception regarding safety Safety Dwellers feel safe till Response Urban Dwellers perception regarding safety Safety Dwellers feel women to be safe till % Urban Safety Agree strongly Agree % Urban Safety somewhat % Urban Safety Adequate Disagree % Urban Safety Dweller's perception of somewhat Dweller's perception of requirement for requirement for more Disagree % Urban more Policemen Safety Policemen strongly
- 6. number Urban Total number of restuarants under FHRAI Entertainment Number of FHRAI restaurants number Urban Total number of hotels under FHRAI Entertainment Number of FHRAI hotels number Urban Total number of tourist places to visit Entertainment Number of tourist places to visit Total number of malls in the corresponding number Urban urban district Entertainment Number of malls Response Urban Dweller perception of adequacy of parks Entertainment Dweller perception of adequacy of parks % Urban Entertainment Agree strongly Agree % Urban Entertainment somewhat % Urban Entertainment Adequate Disagree % Urban Entertainment Dweller's perception of somewhat Dweller's perception of requirement for requirement for more Movie Disagree % Urban more Movie Halls Entertainment Halls strongly Microgramme per cubic meter Urban Nitrogen Dioxide in residential areas Environment Nitrogen Dioxide in residential areas Microgramme per cubic meter Urban SPM in residential areas Environment RSPM in residential areas Average maximum temperature in the Degree Celsius Urban corresponding urban district Environment Avg. maximum temperature Average minimum temperature in the Degree Celsius Urban corresponding urban district Environment Avg. minimum temperature Average annual rainfall in the corresponding mm Urban urban district Environment Avg. Annual rainfall % Urban Environment Extremely high % Urban Environment Somewhat high % Urban Environment Average % Urban Environment Dweller's perception of Somewhat low Dweller's perception of pollution Levels vis- pollution Levels vis-à-vis other % Urban à-vis other cities Environment cities Very low % Urban Others Agree strongly Agree % Urban Others somewhat % Urban Others Adequate Disagree % Urban Others somewhat City Dweller's requirement for Market City Dweller's requirement for Disagree % Urban Places Others Market Places strongly % Urban Others Agree strongly Agree % Urban Others somewhat % Urban Others Adequate Disagree % Urban Others somewhat City Dweller's requirement for Shopping City Dweller's requirement for Disagree % Urban Malls Others Shopping Malls strongly % Urban Others Agree strongly Agree % Urban Others somewhat % Urban Others Adequate Disagree % Urban Others somewhat City Dweller's requirement for Disagree % Urban City Dweller's requirement for Hospitals Others Hospitals strongly
- 7. % Urban Entertainment Agree strongly Agree % Urban Entertainment somewhat % Urban Entertainment Adequate Disagree % Urban Entertainment somewhat City Dweller's requirement for Disagree % Urban City Dweller's requirement for Bars / Discos Entertainment Bars / Discos strongly % Urban Safety 5:00 PM % Urban Safety 7:00 PM % Urban Safety 9:00 PM % Urban Safety Dwellers' Perception about 11:00 PM Dwellers' Perception about walking alone walking alone outside their % Urban outside their residence Safety residence 1:00 AM % Urban Safety 5:00 PM % Urban Safety 7:00 PM % Urban Safety 9:00 PM Dwellers' Perception about % Urban Dwellers' Perception about young woman Safety young woman safely walk 11:00 PM safely walk alone on the street outside your alone on the street outside % Urban residence Safety your residence 1:00 AM % Urban Education Much worse Somewhat % Urban Education worse % Urban Education Similar Somewhat % Urban Education Dweller's perception of Quality better Dweller's perception of Quality of best of best college vis-a-vis other % Urban college vis-a-vis other cities Education cities Much better % Urban Others Much worse Somewhat % Urban Others worse % Urban Others Similar Somewhat % Urban Others better Dweller's perception of Doctors vis-a-vis Dweller's perception of Doctors % Urban other cities Others vis-a-vis other cities Much better % Urban Others Much worse Somewhat % Urban Others worse % Urban Others Similar Somewhat % Urban Others better Dweller's perception of hospitals vis-à-vis Dweller's perception of % Urban other cities Others hospitals vis-à-vis other cities Much better % Urban Utilities & Transport No Power cut % Urban Utilities & Transport <1 hour % Urban Utilities & Transport 1 to 2 hours % Urban Utilities & Transport Dweller's perception about 2 to 4 hours Dweller's perception about average duration average duration of power cut % Urban of power cut per day Utilities & Transport per day 4 to 8 hours
- 8. Throughout the % Urban Utilities & Transport day % Urban Utilities & Transport Once a day % Urban Utilities & Transport Twice a day Dweller's perception about % Urban Dweller's perception about frequency of Utilities & Transport frequency of water supply from Once in 2 days water supply from Municipality Board in last Municipality Board in last one Less than once % Urban one month Utilities & Transport month in two days % Urban Education Agree strongly Agree % Urban Education somewhat % Urban Education Adequate Disagree % Urban Education somewhat City Dweller's requirement for Disagree % Urban City Dweller's requirement for more School Education more School strongly % Urban Education Agree strongly Agree % Urban Education somewhat % Urban Education Adequate Disagree % Urban Education somewhat City Dweller's requirement for more City Dweller's requirement for Disagree % Urban Colleges Education more Colleges strongly % Urban Entertainment Agree strongly Agree % Urban Entertainment somewhat % Urban Entertainment Adequate Disagree % Urban Entertainment somewhat City Dweller's requirement for Disagree % Urban City Dweller's requirement for more Parks Entertainment more Parks strongly % Urban Others Agree strongly Agree % Urban Others somewhat % Urban Others Adequate Disagree % Urban Others somewhat City Dweller's requirement for more Parking City Dweller's requirement for Disagree % Urban space Others more Parking space strongly % Urban Others Agree strongly Agree % Urban Others somewhat % Urban Others Adequate Disagree % Urban Others somewhat City Dweller's requirement for more Hotels / City Dweller's requirement for Disagree % Urban Restaurants Others more Hotels / Restaurants strongly