SlideShare uma empresa Scribd logo
1 de 10
Baixar para ler offline
1
         ¯ÖÏÖ¸ÓüÛ´³Öú µÖÖ¡Öß
         PASSENGERS ORIGINATING


   (×´Ö×»ÖµÖ−Öü)
  (MILLIONS)
4000
                                                                                                                 3876
                                                                                                        3802

                                                                                               3689


                                                                                   3514
3 50 0
                                                                                                                 3370
                                                                          3329


                                                               3178
                                                                                                        3118


                                      2999            2986
3000
                         2861                     2934                                         2835


                                                                                   2705


2 50 0
                                                                        2396


             2259
                                                               2200
                                                      2126
                                         2094

2000        2000                                  2037
                         1972


          1613
                     1599
150 0
     80-81         -91          -01   -02       -03      -04      -05        -06      -07         -08      -09      -10


                                             S UBURBAN                N ON - S U B U R B A N
         EXCL. METRO
µÖÖ¡Öß ×ú»ÖÖê´Öß™ü¸ü                                                                                       2

           PASSENGER KILOMETRES


 (ײÖ×»ÖµÖ−Öü)
(BILLIONS)
800
                                                                                                                 772


                                                                                                         713


                                                                                                 650
640


                                                                                         583


                                                                                 509

480                                                                  472

                                                             445
                                                   425
                                           398

                                368


320


                        236


             167
16 0
                                                                                                                 131
                                                                                                 120     125
                                                                                 107     112
                                                              96      104
                                89         93       90
   95
                         60
                 41
   23

   0
    70-71         -81     -91        -01     -02      -03      -04         -05     -06     -07     -08     -09         -10


                                           N ON - S U B U R B A N            S UBURBAN
¯ÖÏÖ¸Óü׳֍ú ¸üÖ•ÖÃ¾Ö »Ö¤üÖ−Ö                                                               3
           ORIGINATING REVENUE LOADING

  (×´Ö×»ÖµÖ−Ö ™ü−Ö)
(MILLION TONNES)
900
                                                                                                    887.8


                                                                                            833.4

                                                                                    793.9


750
                                                                            727.8


                                                                    666.5


                                                            602.1
600
                                                    557.4

                                            518.7
                                    492.5
                            473.5

4 50


                      318
300


            196

  168
 150
    70-71 -81           -91     -01    -02     -03      -04    -05      -06     -07    -08      -09     -10

   EXCL. KONKAN RAILWAY
4
               ¯ÖÏןÖפü−Ö †ÖîÃÖŸÖ ´ÖÖ»Ö×›ü²²ÖÖ »Ö¤üÖ−Ö (²Ö.»ÖÖ.)
               AVERAGE WAGON LOADING PER DAY (B.G.)


(ÃÖ´ÖŸÖã»µÖ “ÖÖî¯Ö×ÆüµÖÖê ´Öë)
   (IN 4-WHEELER
   EQUIVALENTS)
 9 50 0 0


                                                                                82010
                                                                                             80137
80000

                                                                      75552


                                                            70615


                                                 65490
 6 50 0 0


                                 59193


                56170

                                            52589
 50 0 0 0


                                                                                                          36133   *
 3 50 0 0
                                                                                              33798   *


20000
    2000-01 01-02                        02-03      03-04     04-05     05-06     06-07   07-08      08-09   09-10

              * Figures in 8-wheelers
5
          ¿Öã¨ü ™ü−Ö ×ú»ÖÖê´Öß™ü¸ü (¸üÖ•ÖÃ¾Ö ´ÖÖ»Ö)
          NET TONNE KILOMETRES (REVENUE FREIGHT)
 (ײÖ×»ÖµÖ−Ö)
 (BILLIONS)
625
                                                                                                   601


                                                                                           551

                                                                                   521

50 0
                                                                           481


                                                                    440


                                                             407

                                                      381
3 75
                                                353
                                          333

                                  312


2 50
                      236


             148

12 5
       111


  0
   70-71        -81         -91     -01   -02   -03    -04    -05    -06     -07     -08     -09     -10


       1 BILLION = 1000 MILLIONS OR 100 CRORES
6
          ¯ÖÏ×ŸÖ ´ÖÖ»Ö ×›ü²²ÖÖ ¯ÖÏ×ŸÖ ×¤ü−Ö ¿Öã¨ü ™ü−Ö ×ú»ÖÖê´Öß™ü¸ü (²Ö.»ÖÖ.)
          NET TONNE Kms. PER WAGON PER DAY (B.G.)


9800

                                                                                                            9270   *

                                                                                                 8687   *

8000


6200


4400


                                                                                         3539
                                                                                3238
                                                                        2960

                                                       2574    2677
2600                                          2468

                                      2223
                             2042


                    1407

            986
   908
 800
    70-71     -81      -91      -01     -02      -03     -04      -05     -06      -07     -08      -09            -10

       *In Term of Eight Wheelers
7
            ´ÖÖ»Ö ×›ü²²Öê êú ±êú¸êü (²Ö.»ÖÖ.)
            WAGON TURN-ROUND (B.G.)

   (פü−ÖÖë ´Öë)
   (IN DAYS)
8 .0 0


          7.47


                     7.16

                              6.99
7.0 0

                                       6.72


                                                 6.40


                                                           6.08

6 .0 0


                                                                    5.49


                                                                             5.23
                                                                                     5.19


5.0 0
                                                                                            4.98


4 .0 0
    2000-01        01-02    02-03    03-04    04-05     05-06     06-07    07-08    08-09     09-10
8
           µÖÖŸÖÖµÖÖŸÖ ‘Ö−ÖŸ¾Ö
           Ã֍ú»Ö ™ü−Ö ×ú»ÖÖê´Öß™ü¸ü ¯ÖÏ×ŸÖ “ÖÖ×»ÖŸÖ ¸êü»Ö¯Ö£Ö ׍ú»ÖÖê´Öß™ü¸ (²Ö.»ÖÖ.)ü
           TRAFFIC DENSITY
           GROSS TONNE KILOMETRES PER RUNNING TRACK
           KILOMETRE (B.G.)
   (×´Ö×»ÖµÖ−Öü ´Öë)
  (IN MILLIONS)
2 5.0 0


                                                                                                                                           21.91


                                                                                                                                  20.56
                                                                                                                    19.74
2 0 .0 0
                                                                                              18.67       18.84
                                                                                   18.34
                                                                         17.46
                                                            16.85
                                                 16.34
                                       15.55

15.0 0


                         12.67


10 .0 0
               8.84


            7.49


  5.0 0


 0 .0 0
       70-71           -81       -91       -01        -02         -03        -04        -05         -06        -07          -08      -09       -10

           “ÖÖ»Öæ ¸êü»Ö¯Ö£Ö êú ‹ú ׍ú»ÖÖê´Öß™ü¸ü ´Öë “Ö»ÖÙü֍ú êú ³ÖÖ¸ü ÃÖ×ÆüŸÖ ‹ú ™ü−Ö Ã֍ú»Ö ³ÖÖ¸ü úÖ ¯Ö׸ü¾ÖÆü−Ö
           TRANSPORTATION OF ONE TONNE OF GROSS LOAD INCLUDING THE WEIGHT OF THE ROLLING STOCK OVER
           ONE KILOMETRE OF RUNNING TRACK
¯Ö׸ü“ÖÖ»Ö−Ö †−Öã¯ÖÖŸÖ                                                                                       9

             OPERATING RATIO


      (¯ÖÏןֿ֟Ö)
    (PERCENT)
10 0 .0 0

                                       98.34


                     96.07                       96.02

                                                                                                                  95.28
 9 5.0 0


                                                          92.34
                                                                    92.13
                               91.97
                                                                              90.98
                                                                                                          90.46
 9 0 .0 0


 8 5.0 0

            84.13                                                                     83.72


 8 0 .0 0

                                                                                                78.68


                                                                                                          75.94

 75.0 0
       70-71          -81    -91   -01         -02       -03      -04       -05   -06         -07       -08   -09     -10
10
            ú´ÖÔ“ÖÖ¸üß ˆŸ¯ÖÖ¤üúŸÖÖ
            STAFF PRODUCTIVITY


         (Æü•ÖÖ¸ü)
  (THOUSANDS)
12 50

                                                                                                                       1183
                             (TOTAL PKMs. + TOTAL NTKMs.) / (NO. OF OPEN LINE STAFF)

                                                                                                              1073


10 0 0                                                                                            991


                                                                                      900


                                                                              799

                                                                      738
 750
                                                              686

                                                       630

                                               585

                                   535

 50 0


                           346


                 244
 2 50


           180


    0
     70-71           -81     -91         -01     -02    -03     -04     -05     -06         -07         -08      -09          -10

Mais conteúdo relacionado

Mais de Prof. K.Nageshwar

Railway Projects In Andhra pradesh : What is pending and What is Proposed
Railway Projects In Andhra pradesh : What is pending and What is ProposedRailway Projects In Andhra pradesh : What is pending and What is Proposed
Railway Projects In Andhra pradesh : What is pending and What is ProposedProf. K.Nageshwar
 
I Love The Whole World. Do You
I Love The Whole World. Do YouI Love The Whole World. Do You
I Love The Whole World. Do YouProf. K.Nageshwar
 
Provisional 2011 Census Report
Provisional 2011 Census ReportProvisional 2011 Census Report
Provisional 2011 Census ReportProf. K.Nageshwar
 
Child Labour In Seed Industries In India
Child Labour In Seed Industries In IndiaChild Labour In Seed Industries In India
Child Labour In Seed Industries In IndiaProf. K.Nageshwar
 
Effective implementation of tobacco prevention in india translating who’s
Effective implementation of tobacco prevention in india translating who’sEffective implementation of tobacco prevention in india translating who’s
Effective implementation of tobacco prevention in india translating who’sProf. K.Nageshwar
 
Allocation Of 2G Spectrum And Telecom Policy
Allocation Of 2G Spectrum And Telecom PolicyAllocation Of 2G Spectrum And Telecom Policy
Allocation Of 2G Spectrum And Telecom PolicyProf. K.Nageshwar
 
Graphene : The Harbinger Of New Technology Revolution
Graphene : The Harbinger Of New Technology RevolutionGraphene : The Harbinger Of New Technology Revolution
Graphene : The Harbinger Of New Technology RevolutionProf. K.Nageshwar
 
Why telangana, sridhar (ppt)
Why telangana, sridhar (ppt)Why telangana, sridhar (ppt)
Why telangana, sridhar (ppt)Prof. K.Nageshwar
 

Mais de Prof. K.Nageshwar (12)

Railway Projects In Andhra pradesh : What is pending and What is Proposed
Railway Projects In Andhra pradesh : What is pending and What is ProposedRailway Projects In Andhra pradesh : What is pending and What is Proposed
Railway Projects In Andhra pradesh : What is pending and What is Proposed
 
Paintings of mf hussain
Paintings of mf hussainPaintings of mf hussain
Paintings of mf hussain
 
I Love The Whole World. Do You
I Love The Whole World. Do YouI Love The Whole World. Do You
I Love The Whole World. Do You
 
Provisional 2011 Census Report
Provisional 2011 Census ReportProvisional 2011 Census Report
Provisional 2011 Census Report
 
Invisible man
Invisible manInvisible man
Invisible man
 
Child Labour In Seed Industries In India
Child Labour In Seed Industries In IndiaChild Labour In Seed Industries In India
Child Labour In Seed Industries In India
 
Effective implementation of tobacco prevention in india translating who’s
Effective implementation of tobacco prevention in india translating who’sEffective implementation of tobacco prevention in india translating who’s
Effective implementation of tobacco prevention in india translating who’s
 
Allocation Of 2G Spectrum And Telecom Policy
Allocation Of 2G Spectrum And Telecom PolicyAllocation Of 2G Spectrum And Telecom Policy
Allocation Of 2G Spectrum And Telecom Policy
 
Graphene : The Harbinger Of New Technology Revolution
Graphene : The Harbinger Of New Technology RevolutionGraphene : The Harbinger Of New Technology Revolution
Graphene : The Harbinger Of New Technology Revolution
 
Js(sa) ppt hyderabad
Js(sa) ppt hyderabadJs(sa) ppt hyderabad
Js(sa) ppt hyderabad
 
Aadhaar ppt
Aadhaar ppt Aadhaar ppt
Aadhaar ppt
 
Why telangana, sridhar (ppt)
Why telangana, sridhar (ppt)Why telangana, sridhar (ppt)
Why telangana, sridhar (ppt)
 

Rail Budget graphs 2011 - 2012
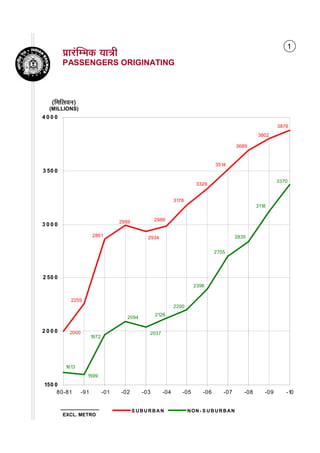
  • 1. 1 ¯ÖÏÖ¸ÓüÛ´³Öú µÖÖ¡Öß PASSENGERS ORIGINATING (×´Ö×»ÖµÖ−Öü) (MILLIONS) 4000 3876 3802 3689 3514 3 50 0 3370 3329 3178 3118 2999 2986 3000 2861 2934 2835 2705 2 50 0 2396 2259 2200 2126 2094 2000 2000 2037 1972 1613 1599 150 0 80-81 -91 -01 -02 -03 -04 -05 -06 -07 -08 -09 -10 S UBURBAN N ON - S U B U R B A N EXCL. METRO
  • 2. µÖÖ¡Öß ×ú»ÖÖê´Öß™ü¸ü 2 PASSENGER KILOMETRES (ײÖ×»ÖµÖ−Öü) (BILLIONS) 800 772 713 650 640 583 509 480 472 445 425 398 368 320 236 167 16 0 131 120 125 107 112 96 104 89 93 90 95 60 41 23 0 70-71 -81 -91 -01 -02 -03 -04 -05 -06 -07 -08 -09 -10 N ON - S U B U R B A N S UBURBAN
  • 3. ¯ÖÏÖ¸Óü׳֍ú ¸üÖ•ÖÃ¾Ö »Ö¤üÖ−Ö 3 ORIGINATING REVENUE LOADING (×´Ö×»ÖµÖ−Ö ™ü−Ö) (MILLION TONNES) 900 887.8 833.4 793.9 750 727.8 666.5 602.1 600 557.4 518.7 492.5 473.5 4 50 318 300 196 168 150 70-71 -81 -91 -01 -02 -03 -04 -05 -06 -07 -08 -09 -10 EXCL. KONKAN RAILWAY
  • 4. 4 ¯ÖÏןÖפü−Ö †ÖîÃÖŸÖ ´ÖÖ»Ö×›ü²²ÖÖ »Ö¤üÖ−Ö (²Ö.»ÖÖ.) AVERAGE WAGON LOADING PER DAY (B.G.) (ÃÖ´ÖŸÖã»µÖ “ÖÖî¯Ö×ÆüµÖÖê ´Öë) (IN 4-WHEELER EQUIVALENTS) 9 50 0 0 82010 80137 80000 75552 70615 65490 6 50 0 0 59193 56170 52589 50 0 0 0 36133 * 3 50 0 0 33798 * 20000 2000-01 01-02 02-03 03-04 04-05 05-06 06-07 07-08 08-09 09-10 * Figures in 8-wheelers
  • 5. 5 ¿Öã¨ü ™ü−Ö ×ú»ÖÖê´Öß™ü¸ü (¸üÖ•ÖÃ¾Ö ´ÖÖ»Ö) NET TONNE KILOMETRES (REVENUE FREIGHT) (ײÖ×»ÖµÖ−Ö) (BILLIONS) 625 601 551 521 50 0 481 440 407 381 3 75 353 333 312 2 50 236 148 12 5 111 0 70-71 -81 -91 -01 -02 -03 -04 -05 -06 -07 -08 -09 -10 1 BILLION = 1000 MILLIONS OR 100 CRORES
  • 6. 6 ¯ÖÏ×ŸÖ ´ÖÖ»Ö ×›ü²²ÖÖ ¯ÖÏ×ŸÖ ×¤ü−Ö ¿Öã¨ü ™ü−Ö ×ú»ÖÖê´Öß™ü¸ü (²Ö.»ÖÖ.) NET TONNE Kms. PER WAGON PER DAY (B.G.) 9800 9270 * 8687 * 8000 6200 4400 3539 3238 2960 2574 2677 2600 2468 2223 2042 1407 986 908 800 70-71 -81 -91 -01 -02 -03 -04 -05 -06 -07 -08 -09 -10 *In Term of Eight Wheelers
  • 7. 7 ´ÖÖ»Ö ×›ü²²Öê êú ±êú¸êü (²Ö.»ÖÖ.) WAGON TURN-ROUND (B.G.) (פü−ÖÖë ´Öë) (IN DAYS) 8 .0 0 7.47 7.16 6.99 7.0 0 6.72 6.40 6.08 6 .0 0 5.49 5.23 5.19 5.0 0 4.98 4 .0 0 2000-01 01-02 02-03 03-04 04-05 05-06 06-07 07-08 08-09 09-10
  • 8. 8 µÖÖŸÖÖµÖÖŸÖ ‘Ö−ÖŸ¾Ö Ã֍ú»Ö ™ü−Ö ×ú»ÖÖê´Öß™ü¸ü ¯ÖÏ×ŸÖ “ÖÖ×»ÖŸÖ ¸êü»Ö¯Ö£Ö ׍ú»ÖÖê´Öß™ü¸ (²Ö.»ÖÖ.)ü TRAFFIC DENSITY GROSS TONNE KILOMETRES PER RUNNING TRACK KILOMETRE (B.G.) (×´Ö×»ÖµÖ−Öü ´Öë) (IN MILLIONS) 2 5.0 0 21.91 20.56 19.74 2 0 .0 0 18.67 18.84 18.34 17.46 16.85 16.34 15.55 15.0 0 12.67 10 .0 0 8.84 7.49 5.0 0 0 .0 0 70-71 -81 -91 -01 -02 -03 -04 -05 -06 -07 -08 -09 -10 “ÖÖ»Öæ ¸êü»Ö¯Ö£Ö êú ‹ú ׍ú»ÖÖê´Öß™ü¸ü ´Öë “Ö»ÖÙü֍ú êú ³ÖÖ¸ü ÃÖ×ÆüŸÖ ‹ú ™ü−Ö Ã֍ú»Ö ³ÖÖ¸ü úÖ ¯Ö׸ü¾ÖÆü−Ö TRANSPORTATION OF ONE TONNE OF GROSS LOAD INCLUDING THE WEIGHT OF THE ROLLING STOCK OVER ONE KILOMETRE OF RUNNING TRACK
  • 9. ¯Ö׸ü“ÖÖ»Ö−Ö †−Öã¯ÖÖŸÖ 9 OPERATING RATIO (¯ÖÏןֿ֟Ö) (PERCENT) 10 0 .0 0 98.34 96.07 96.02 95.28 9 5.0 0 92.34 92.13 91.97 90.98 90.46 9 0 .0 0 8 5.0 0 84.13 83.72 8 0 .0 0 78.68 75.94 75.0 0 70-71 -81 -91 -01 -02 -03 -04 -05 -06 -07 -08 -09 -10
  • 10. 10 ú´ÖÔ“ÖÖ¸üß ˆŸ¯ÖÖ¤üúŸÖÖ STAFF PRODUCTIVITY (Æü•ÖÖ¸ü) (THOUSANDS) 12 50 1183 (TOTAL PKMs. + TOTAL NTKMs.) / (NO. OF OPEN LINE STAFF) 1073 10 0 0 991 900 799 738 750 686 630 585 535 50 0 346 244 2 50 180 0 70-71 -81 -91 -01 -02 -03 -04 -05 -06 -07 -08 -09 -10