SlideShare uma empresa Scribd logo
1 de 15
Baixar para ler offline
International Journal of Data Mining & Knowledge Management Process (IJDKP) Vol.4, No.4, July 2014
DOI : 10.5121/ijdkp.2014.4401 1
STRATIFICATION OF CLINICAL SURVEY DATA
USING CONTINGENCY TABLES
Suzan Arslanturk1
, Mohammad-Reza Siadat1
, Theophilus Ogunyemi2
, Brendhan
Givens1
, Ananias Diokno3
1
Dept of Comp Science and Engineering,
Oakland University, Rochester, MI 48309, USA
2
Department of Mathematics and Statistics,
Oakland University, Rochester, MI 48309, USA
3
Beaumont Health System,
William Beaumont Hospital, Royal Oak, MI 48073, USA
ABSTRACT
Data stratification is the process of partitioning the data into distinct and non-overlapping groups since the
study population consists of subpopulations that are of particular interest. In clinical data, once the data is
stratified into sub populations based on a significant stratifying factor, different risk factors can be
determined from each subpopulation. In this paper, the Fisher’s Exact Test is used to determine the
significant stratifying factors. The experiments are conducted on a simulated study and the Medical,
Epidemiological and Social Aspects of Aging (MESA) data constructed for prediction of urinary
incontinence. Results show that, smoking is the most significant stratifying factor of MESA data, showing
that the smokers and non-smokers indicates different risk factors towards urinary incontinence and should
be treated differently.
KEYWORDS
Contingency Tables, Medical Survey Data, Stratification, Subgroup Analysis
1. INTRODUCTION
In clinical survey data, it is common for subjects to have their own unique set of answers to the
questionnaire. However, the subjects can be grouped into populations based on common answers
to specific questions. It is important to divide the dataset into sub-populations based on these
questions that have common answers for each population. This will help us to investigate
heterogeneous results, or to answer specific questions about particular patients groups and to see
whether and how risk factors vary across sub populations. This approach leads us to extract
maximum amount of information from the data and gives the clinicians the possibility to apply
different treatments for different groups of people. It is important based on what questions to
divide (stratify) the population into groups, which we will refer as the stratifying factors
throughout this paper. This study proposes a method that shows how to stratify a population
based on a simulated study and a longitudinal clinical survey data.
International Journal of Data Mining & Knowledge Management Process (IJDKP) Vol.4, No.4, July 2014
2
A survey data may instruct a respondent to skip some irrelevant questions based on the answer to
a previous branching question. A branching question precedes sets of alternative questions and its
response determines which alternative set of questions to be answered by a respondent. The
questions in the unvisited alternative paths are referred to as skip patterns. Leaving a question
unanswered about number of cigarettes smoked by a non-smoker respondent when the
questionnaire instructs such person to skip this question is an example of a skip pattern. When the
dataset of interest contains skip patterns, it is important to stratify the data based on the branching
questions in order to evaluate each stratum independently.
Su et al. have focused on a comparative study where two or more treatments are compared and
how the treatment effect varies across subgroups induced by covariates. Treatment effect can be
defined as the amount of change in a condition or symptom because of receiving a treatment
compared to not receiving the treatment. They have considered a binary treatment effect (0 or 1),
a continuous output and a number of covariates where the components are of mixed types
(categorical and continuous). They have used a tree-structured subgroup analyses algorithm
since; the tree algorithm is a well-known tool for determining the interactions between the
treatment and the covariates. Their goal in subgroup analysis is to find out whether there exist
subgroups of individuals in which the treatment shows heterogeneous effects, and if so, how the
treatment effect varies across them. By recursively partitioning the data into two subgroups that
show the greatest heterogeneity in the treatment effect, they were able to optimize the subgroup
analyses. They have used simulated studies to validate their approach. Also, they have used the
Current Population Survey (CPS) database conducted by the U.S Census Bureau for the Bureau
of Labor and Statistics, in 2004. The CPS is a survey data of 60.000 households. The
investigators were interested in specific subgroups of the working population where the pay gap
between sexes is dominant. The questions in the survey were related to some demographic
characteristics of the respondents, the employment status, hours worked and the income earned
from their work. There were different covariates in the data such as gender, age, education, race,
citizenship, tax status, etc. The results show that for most of the subgroups that constitute the
majority of the population, women are paid significantly less than men. Also, the wage disparity
between men and women varies with the industry, occupation and age. In our study, on the other
hand, instead of recursively partitioning the data into sub populations, we are using the branching
questions leading the skip patterns to occur as our stratifying factor.
Subgroup analyses are a highly subjective process since the subgroups themselves as well as the
number of subgroups are determined by the investigator beforehand (Assmann et al. 2000). It is
important to determine which specific subgroup to use in the experiment. The incorrect selection
of the subgroups may cause unreliable results. Therefore, significance testing is a common
approach in subgroup analyses. That is, testing the numerous plausible possibilities to see which
subgroup performs better. However, this approach cannot be considered as an efficient way of
splitting the data. We are utilizing the wisdom of experts embedded in the data through the
questionnaire design processes when selecting the branching questions as stratifying
factors. There have been several studies on determining variables that are important for
understanding the underlying phenomena of interest. It is important to reduce the dimension of
original data prior to any modeling. Different attribute selection techniques have been used in
order to reduce the dimensionality and the computational complexity (Azhagusundari et al.). The
attributes that are significant can be extracted, ranked and weights can be assigned to each
attribute to compare the significance. Decision trees based on information gain techniques have
been widely used in order to perform feature selection. Decision trees divide the population
into subgroups recursively until the leaf nodes represents the class labels. However, in this
International Journal of Data Mining & Knowledge Management Process (IJDKP) Vol.4, No.4, July 2014
3
study the feature selection techniques cannot be directly used in order to determine the significant
branching questions, since the class labels of individual subject is irrelevant. Instead high support
and confidence for prospective extracted rules from each stratum is of interest. That is, a
population with mixed class labels in a stratum would be favorable as long as it lends itself to
rules with high confidence factor and support. For instance, smoking could be a significant
branching question if the rules applied to smokers are different than those applied to non-
smokers. However, there could be populations with mixed class labels in smokers and non-
smokers groups.
Risk stratification in clinical data is used to divide patients into different acuity levels and to
determine a person's risk for suffering a particular condition and the need for preventive
intervention. Haas et. al have used several risk stratification techniques to evaluate the
performance in predicting healthcare utilization. They have studied 83 patients empanelled in
2009 and 2010 in a primary care practice. 7 different risk stratification techniques were used:
Adjusted Clinical Groups (ACGs), Hierarchical Condition Categories (HCCs), Elder Risk
Assessment, Chronic Co morbidity Count, Charlson Co morbidity Index, and Minnesota Health
Care Home Tiering and a combination of Minnesota Tiering and ERA. To predict the healthcare
utilization and cost, historical data (data from 2009) have been used by a logistic regression
model using demographic characteristics and diagnosis such as emergency department visits,
hospitalizations, 30 day readmissions. The results show that ACG model outperforms the other
risk stratification methods. They have studied data stratification based on the acuity of each
patient and generated different results for each stratum. However, in our study the stratifying
factor is unknown beforehand and needs to be determined from the existing branching questions
by using statistical methods.
The Medical, Epidemiological and Social Aspects of Aging (MESA) data focuses on different
aspects of aging including the Urinary Incontinence (UI) of elderly women. It is a longitudinal
dataset containing a baseline and three follow-up surveys. In this study, we will consider the
baseline and the first follow-up. The baseline of MESA is collected in 1983. The investigators
surveyed 1957 respondents, 596 of whom were women aged 60 years and older. The respondents
were interviewed for approximately 2 hours at home at baseline (1983-1984 interviews) and then
re-interviewed at 1-2 year intervals. The respondents are interviewed on a variety of health
related questions that may play a role in the prevalence of urinary incontinence (UI). The class
labels of the MESA data are ‘continent’ and ‘incontinent’ indicating the respondent’s outcome.
Although, the survey focused on the epidemiology of UI, many other attributes were also
assessed including medical history, mobility, cognitive function, current health, and quality of
life. The baseline of the MESA dataset contains 34 branching questions which are listed in the
paper.
The patients in the MESA dataset are stratified into different populations based on each branching
question. A statistical method is used to determine the significant branching questions, i.e. the
branching questions that split the dataset into two significantly diverse populations. Once the two
sub-populations are explored, the index estimation and the risk factor analyses can be performed
on those populations.
This paper is organized as follows: In Section 2 the statistical method of identifying significant
branching questions is examined. Section 3 describes the validation for the simulated data.
Section 4 presents the results for the simulated data and the MESA data along with the risk factor
analyses on each stratum. Finally, Section 5 presents our conclusion and future work.
International Journal of Data Mining & Knowledge Management Process (IJDKP) Vol.4, No.4, July 2014
4
2. METHOD
Fisher’s Exact Test is a statistical significance test used in the analysis of contingency tables. It is
used for all sample sizes. The significance of the deviation from a null hypothesis can be
calculated exactly. Therefore, it is not necessary to rely on an approximation that becomes exact
in the limit as the sample size grows to infinity. The Fisher’s Exact Test is used to determine if
there are nonrandom associations between the two variables.
As mentioned before, the dataset is divided into sub populations (‫ܿ݊ܽݎܤ‬ℎଵ, ‫ܿ݊ܽݎܤ‬ℎଶ) based on
each branching question. Even though, this method can be applied on each question, we limit the
number of tests we are using by the branching questions for the following reason: when dividing
the population into subgroups, the split is induced by a threshold which is determined by the
expert knowledge for each branching question. However, for each non-branching question
determining a threshold for each type of answer (categorical, binary, numeric) may lead to
incorrect classifications.
Table 1 shows a contingency table where the p values are calculated by the following formula:
ܲ =
ቀ ൫ࢇశ࢈
ࢇ ൯ ൫ࢉశࢊ
ࢉ ൯ቁ
൫ ࢔
ࢇశࢉ൯
=
ሺ௔ା௕ሻ!ሺ௖ାௗሻ!ሺ௔ା௖ሻ!ሺ௕ାௗሻ!
௔!௕!௖!ௗ!௡!
Here, ܴଵ, ܴଶ, ܽ݊݀ ܴଷ are association rules extracted from datasets ‫ܿ݊ܽݎܤ‬ℎଵ or ‫ܿ݊ܽݎܤ‬ℎଶ. The
values ܽ, ܾ, ܿ and ݀ are the number of subjects that support/contradict the extracted rules in those
two datasets. A different contingency table needs to be generated for each branching question.
Since MESA dataset contains 1957 subjects, the high values used in the formula above resulted in
computational considerations. Therefore, the Fisher’s Exact Test calculation is modified as shown
below.
Table 1 – Contingency Table for Stratification
࡮࢘ࢇ࢔ࢉࢎ૚ ࡮࢘ࢇ࢔ࢉࢎ૛ Row Total
ࡾ૚ # of subjects that support ܴଵ ܽ ܾ ܽ + ܾ
# of subjects that contradict ܴଵ ܿ ݀ ܿ + ݀
Column Total ܽ + ܿ ܾ + ݀ ܽ + ܾ + ܿ + ݀
ࡾ૛ # of subjects that support ܴଶ
# of subjects that contradict ܴଶ
… …
…
ࡾ࢔ # of subjects that support ܴ௡
# of subjects that contradict ܴ௡
‫ݐݑ݌݊ܫ‬ = ‫݁݊݋‬ ‫݈ܾ݁ܽ݅ݎܽݒ‬ ‫ݔ‬ − 2‫2ݔ‬ ݀ܽ‫ܽݐ‬ ݉ܽ‫ݔ݅ݎݐ‬
‫݊ܭ‬ = ‫݉ݑݏ‬ሺ‫,ݔ‬ 2ሻ; ܵ݊ = ‫݉ݑݏ‬ሺ‫ݔ‬ሻ; ܰ = ‫݉ݑݏ‬ሺ‫݊ܭ‬ሻ;
%ܴ݁ܽ‫݁݃݊ܽݎݎ‬ ‫ݐ‬ℎ݁ ‫ݐ‬ℎ‫݁݁ݎ‬ ݉ܽ‫ݏ݁ܿ݅ݎݐ‬ ݂݅ ݅‫ݐ‬ ݅‫ݏ‬ ݊݁ܿ݁‫.ݕݎܽݏݏ‬
International Journal of Data Mining & Knowledge Management Process (IJDKP) Vol.4, No.4, July 2014
5
‫ݐݎ݋ݏ‬ሺ‫݊ܭ‬ሻ
‫ݐݎ݋ݏ‬ሺܵ݊ሻ
%‫݁ݐܽݎ݁݊݁ܩ‬ ‫ݐ‬ℎ݁ ݂‫݃݊݅ݓ݋݈݈݋‬ ݈‫.݌݋݋‬
݅݊݀݁‫ݔ‬ = 0: 1: ݉݅݊ሺ‫݊ܭ‬ሺ1ሻ, ܵ݊ሺ1ሻሻ
‫ݖ‬ = [݅݊݀݁‫;ݔ‬ ‫݊ܭ‬ሺ2ሻ − ܵ݊ሺ1ሻ + ݅݊݀݁‫;ݔ‬ ‫݊ܭ‬ሺ1ሻ − ݅݊݀݁‫;ݔ‬ ܵ݊ሺ1ሻ − ݅݊݀݁‫;ݔ‬ ]
݊‫݌‬ = ‫ݏ݋ݎ݁ݖ‬ሺ1, ݈݁݊݃‫ݐ‬ℎሺ݅݊݀݁‫ݔ‬ሻሻ; ݈‫ݖ‬ = ݈‫݃݋‬ሺ‫ݖ‬ሻ
%ܷ‫݁ݏ‬ ‫ݐ‬ℎ݁ ݈݃ܽ݉݉ܽ݊ሺሻ ݂‫݊݋݅ݐܿ݊ݑ‬ ‫݋ݐ‬ ‫݁ܿݑ݀݁ݎ‬ ‫ݐ‬ℎ݁ ܿ‫݈ܽ݊݋݅ݐܽݐݑ݌݉݋‬ ܿ‫ݕݐ݅ݔ݈݁݌݉݋‬
݊‫݌‬ሺ1ሻ = ‫݉ݑݏ‬ሺ݈݃ܽ݉݉ܽ݊ሺ[‫݊ܭ‬ሺ2ሻ + 1 ܵ݊ሺ2ሻ + 1]ሻ − ݈݃ܽ݉݉ܽ݊ሺ[ܰ + 1 ‫ݖ‬ሺ2ሻ + 1]ሻሻ
݂ = ‫݉ݑݏ‬ሺ݈‫ݖ‬ሺ3: 4,1:݁݊݀ − 1ሻሻ − ‫݉ݑݏ‬ሺ݈‫ݖ‬ሺ1: 2,2: ݁݊݀ሻሻ
݊‫݌‬ሺ2: ݁݊݀ሻ = ݊‫݌‬ሺ1ሻ + ܿ‫݉ݑݏ݉ݑ‬ሺ݂ሻ
%݁‫݌ݔ‬ሺሻ‫݀݁ݏݑ‬ ܾ݁ܿܽ‫݁ݏݑ‬ ‫݂݋‬ ݈݃ܽ݉݉ܽ݊ሺሻ
݊‫݌‬ = ݁‫݌ݔ‬ሺ݊‫݌‬ሻ; ܹ = ‫ݔ‬ሺ1ሻ + 1
%‫ݐ‬ℎ݁݊ ܿ‫݁ݐݑ݌݉݋‬ ‫ݐ‬ℎ݁ ‫݌‬ − ‫ݏ݁ݑ݈ܽݒ‬
ܲ‫݁ݑ݈ܽݒ‬ = [ ܲ 0.5 ∗ ݊‫݌‬ሺܹሻ + ‫݉ݑݏ‬ሺ݊‫݌‬ሺ݊‫݌‬ < ݊‫݌‬ሺܹሻሻሻ]
Algorithm 1- Fisher’s Exact Test
3. SIMULATION
The simulation is created by generating two independent binary datasets. The first dataset D1 and
the second dataset D2 both contain 1000 subjects where ܵଵ = ሼܵଵଵ, ܵଶଵ, ܵଷଵ, … , ܵଵ଴଴଴ ଵሽ is the
subject set of ‫ܦ‬ଵ and ܵଶ = ሼܵଵଶ, ܵଶଶ, ܵଷଶ, … , ܵଵ଴଴଴ ଶሽ is the subject set of ‫ܦ‬ଶ and 15 common
attributes ሺ‫ܣ‬ = ሼ‫ܣ‬ଵ, ‫ܣ‬ଶ, ‫ܣ‬ଷ, … , ‫ܣ‬ଵହሽሻ. Three different rules are embedded to each dataset. The
rules are generated in the sense that none of the rules contradict with another rule. There is no
attribute being used in more than one rule. The class labels contain both the classes from the
baseline and the first follow up. ‘‫ܥ‬ − ‫’ܫ‬ is an example of a response indicating that the subject
was continent in the baseline and became incontinent in the first follow-up. The rules that are
embedded to D1 are as follows:
ܴଵଵ = ‫1ܣ‬ = 0 & ‫3ܣ‬ = 1 ⇒ ‫ܫ‬ − ‫ܥ‬
ܴଶଵ = ‫5ܣ‬ = 0 & ‫7ܣ‬ = 1 ⇒ ‫ܥ‬ − ‫ܫ‬
ܴଷଵ = ‫01ܣ‬ = 1 & ‫21ܣ‬ = 1 ⇒ ‫ܥ‬ − ‫ܫ‬
The rules that are embedded to D2 are as follows:
ܴଵଶ = ‫2ܣ‬ = 0 & ‫11ܣ‬ = 0 ⇒ ‫ܥ‬ − ‫ܫ‬
ܴଶଶ = ‫4ܣ‬ = 1 & ‫9ܣ‬ = 0 ⇒ ‫ܥ‬ − ‫ܫ‬
ܴଷଶ = ‫6ܣ‬ = 0 & ‫8ܣ‬ = 1 ⇒ ‫ܫ‬ − ‫ܥ‬
The two datasets are then combined. The combination ሺ‫ܦ‬ଵ + ‫ܦ‬ଶሻ, have 2000 subjects ܵ஽భା஽మ
=
ሼܵଵଵ, ܵଶଵ, ܵଷଵ, … , ܵଵ଴଴଴ ଵ, ܵଵଶ, ܵଶଶ, ܵଷଶ, … , ܵଵ଴଴଴ ଶሽ and 15 attributes ሺ‫ܣ‬ = ሼ‫ܣ‬ଵ, ‫ܣ‬ଶ, ‫ܣ‬ଷ, … , ‫ܣ‬ଵହሽሻ.
Three attributes are then added to the combined dataset. Those attributes each represent a
branching question having binary values. First branching question ‫ܳܤ‬ଵ, takes value ‘0’ for each
subject existing in ‫ܦ‬ଵ and value ‘1’ for each subject existing in ‫ܦ‬ଶ. The second and third
branching questions, ‫ܳܤ‬ଶ and ‫ܳܤ‬ଷ take random binary values.
International Journal of Data Mining & Knowledge Management Process (IJDKP) Vol.4, No.4, July 2014
6
Figure 1- Simulation of Stratification
The combined dataset is then separated into two subsets based on the values of each branching
question. The subset for ‫ܳܤ‬ଵ taking value ‘0’ is ‫ܦ‬஻ொభ
బ and the subset for ‫ܳܤ‬ଵ taking value ‘1’ is
‫ܦ‬஻ொభ
భ, similarly the subsets for ‫ܳܤ‬ଶ are ‫ܦ‬஻ொమ
బ and ‫ܦ‬஻ொమ
భ and the subsets for ‫ܳܤ‬ଷ are ‫ܦ‬஻ொయ
బ and
‫ܦ‬஻ொయ
భ. Figure 1 shows an example of the combined dataset with branching questions that are
separated.
The association rule mining algorithm, Apriori, is used to extract the rules of each subset. Apriori
is an association rule that iteratively reduces the minimum support until it finds the required
number of rules with the given minimum confidence (W. Cohen). Once the rules are extracted for
each subset, a contingency table is created for each branching question. A contingency table is
a matrix format that displays the frequency distribution of the variables. The rows of the
contingency table denote the rules associated with that branching question. The columns are the
subsets. For example, for ‫ܳܤ‬ଶ, the rows of the contingency table are the rules extracted from
subset ࡰ࡮ࡽ૛
૙ and ࡰ࡮ࡽ૛
૚, respectively. The columns are the datasets ࡰ࡮ࡽ૛
૙ and ࡰ࡮ࡽ૛
૚. The
contingency table is created to display the relative frequencies, i.e. the support/no support of each
rule for each subset.
Once the contingency table is created, the p-values are calculated using the Fisher’s Exact Test
explained in the Methods Section. Based on the p-values that are calculated, we can determine the
branching questions that are statistically significant.
A branching question is a good stratifying factor when it is statistically significant, since different
rules (hence different risk factors and predictive factors) are extracted from its sub populations.
Therefore, those two sub populations cannot be treated the same. If data is not stratified into sub
populations when the branching question is determined to be significant, one may skip some
important risk factors and predictive factors.
International Journal of Data Mining & Knowledge Management Process (IJDKP) Vol.4, No.4, July 2014
7
4. RESULTS
4.1 Simulation Results of Stratification
The contingency tables for three branching questions for the simulated study are analyzed. Table
2 shows the simulation results of stratification with no noise. As mentioned before, the first three
rules ሺܴଵଵ, ܴଶଵ, ܴଷଵሻ are extracted from the dataset that contains the subjects that have ‫ܳܤ‬ଵ
ଵ
= 0,
denoted by ‫ܦ‬஻ொభ
భ, and the last three rules ሺܴଵଶ, ܴଶଶ, ܴଷଶሻ are extracted from the dataset that
contains the subjects that have ‫ܳܤ‬ଵ
ଶ
= 1, denoted by ‫ܦ‬஻ொభ
మ. Since the first branching
question, ‫ܳܤ‬ଵ, was designed to separate datasets ‫ܦ‬ଵ and ‫ܦ‬ଶ, it is expected to extract the same
rules listed in Section 3 ሺܴଵଵ, ܴଶଵ, ܴଷଵ ܽ݊݀ ܴଵଶ, ܴଶଶ, ܴଷଶ ) for subsets, ‫ܦ‬஻ொభ
భ and ‫ܦ‬஻ொభ
మ. The rules
extracted from ‫ܦ‬஻ொభ
భ are the same as the rules extracted from ‫ܦ‬ଵ, and the rules extracted from
‫ܦ‬஻ொభ
మ are the same as the rules extracted from ‫ܦ‬ଶ. Note that, the support of the first three
rules ሺܴଵଵ, ܴଶଵ, ܴଷଵሻ of dataset ‫ܦ‬஻ொభ
భ, is much higher than the support of the first three
rules ሺܴଵଵ, ܴଶଵ, ܴଷଵሻ of dataset ‫ܦ‬஻ொభ
మ and the non-support of the first three rules ሺܴଵଵ, ܴଶଵ, ܴଷଵሻ of
dataset ‫ܦ‬஻ொభ
భ is equal to 0. The reason of the non-support being 0 is that, the rules are generated in
the sense that none of the rules contradict with any other. Likewise, for the second branch, ‫ܳܤ‬ଵ
ଶ
,
we expect to see a lower support and a higher nonsupport compared to ‫ܳܤ‬ଵ
ଵ
, for the first three
rules. Notice that, for the last three rules the support of ‫ܳܤ‬ଵ
ଶ
is higher than ‫ܳܤ‬ଵ
ଵ
and the
nonsupport of ‫ܳܤ‬ଵ
ଶ
is lower than ‫ܳܤ‬ଵ
ଵ
, since the last three rules were extracted from ‫ܦ‬ଶ.
Table 2- Significant Branching (OB) p-values for 0% Noise
Association Rules Noise: 0% ‫ܦ‬஻ொభ
బ ‫ܦ‬஻ொభ
భ Row
T.
p-value
A1T1='(-inf-0.25]' A3T1='(0.75-inf)' 200 ==>
class=I-C 200
Support 200 17 217 3.224e-46
No Support 0 61 61
Column
Total
200 78 556
A5T1='(-inf-0.25]' A7T1='(0.75-inf)' 200 ==>
class=C-I
Support 200 31 231 3.730e-25
No Support 0 34 34
Column
Total
200 65 530
A10T1='(0.75-inf)' A12T1='(0.75-inf)' 200
==> class=C-I 200
Support 200 33 233 7.54e-30
No Support 0 43 43
Column
Total
200 76 552
A2T1='(-inf-0.25]' A11T1='(-inf-0.25]' 200
==> class=C-I 200
Support 26 200 226 4.92e-29
No Support 38 0 38
Column
Total
64 200 528
A4T1='(0.75-inf)' A9T1='(-inf-0.25]' 200 ==>
class=C-I 200
Support 28 200 228 1.30e-29
No Support 40 0 40
Column
Total
68 200 536
International Journal of Data Mining & Knowledge Management Process (IJDKP) Vol.4, No.4, July 2014
8
A6T1='(-inf-0.25]' A8T1='(0.75-inf)' 200 ==>
class=I-C 200
Support 10 200 210 2.74e-37
No Support 40 0 40
Column
Total
50 200 500
The p-values are calculated and the results show that, for each rule, the association between the
rules and two populations are considered to be extremely statistically significant. Therefore, we
can define, ‫ܳܤ‬ଵ, as a significant branching question. That means, the two populations, ‫ܳܤ‬ଵ
ଵ
and
‫ܳܤ‬ଵ
ଶ
has different association rules hence; they have to be analyzed separately.
Table 3, 4, and 5 show the same experiment with 10%, 20% and 30% noise, respectively. Note
that, even if there is 30% noise in the data, the p-values are still considered to be very statistically
significant. However, the comparison of the p-values with different noise levels also show that,
the p-values become less significant when the noise level increases.
Table 3- Significant Branching (OB) p-values for 10% Noise
Association Rules Noise:
10%
‫ܦ‬஻ொభ
బ ‫ܦ‬஻ொభ
భ Row T. p-value
A10T1='(0.75-inf)' A12T1='(0.75-inf)' 137
==> class=C-I 129
Support 129 16 145 3.02e-17
NoSupport 8 33 41
Column
Total
137 49 372
A5T1='(-inf-0.25]' A7T1='(0.75-inf)' 146 ==>
class=C-I
Support 135 24 159 3.94e-14
NoSupport 11 34 45
Column
Total
146 58 408
A1T1='(-inf-0.25]' A3T1='(0.75-inf)' 143 ==>
class=I-C 129
Support 129 7 136 1.57e-33
NoSupport 14 67 81
Column
Total
143 74 434
A4T1='(0.75-inf)' A9T1='(-inf-0.25]' 150 ==>
class=C-I 140
Support 26 140 166 2.70e-15
NoSupport 36 10 46
Column
Total
62 150 424
A6T1='(-inf-0.25]' A8T1='(0.75-inf)' 147 ==>
class=I-C 135
Support 12 135 147 5.12e-23
NoSupport 45 12 57
Column
Total
57 147 408
A2T1='(-inf-0.25]' A11T1='(-inf-0.25]' 155
==> class=C-I 141
Support 18 141 159
NoSupport 35 14 49
Column
Total
53 155 416
International Journal of Data Mining & Knowledge Management Process (IJDKP) Vol.4, No.4, July 2014
9
Table 4- Significant Branching (OB) p-values for 20% Noise
Association Rules Noise: 20% ‫ܦ‬஻ொభ
బ ‫ܦ‬஻ொభ
భ Row T. p-value
A5T1='(-inf-0.25]' 169 ==> class=C-I 126 Support 126 54 180 4.47e-9
No Support 43 78 121
Column
Total
169 132 602
A5T1='(-inf-0.25]' A7T1='(0.75-inf)' 173 ==>
class=C-I 128
Support 128 59 187 3.80e-9
No Support 45 84 129
Column
Total
173 143 632
A5T1='(-inf-0.25]' A7T1='(0.75-inf)' 173 ==>
class=C-I 124
Support 124 54 178 4.93e-7
No Support 49 73 122
Column
Total
173 127 600
A2T1='(-inf-0.25]' A11T1='(-inf-0.25]' 149
==> class=C-I 114
Support 46 114 160 3.06e-9
No Support 68 35 103
Column
Total
114 149 526
A4T1='(0.75-inf)' A9T1='(-inf-0.25]' 151 ==>
class=C-I 115
Support 42 115 157 4.96e-15
No Support 96 36 132
Column
Total
138 151 578
A11T1='(-inf-0.25]' 161 ==> class=C-I 122 Support 43 122 165 1.36e-13
No Support 83 39 122
Column
Total
126 161 574
Table 5- Significant Branching (OB) p-values for 30% Noise
Association Rules Noise:30% ‫ܦ‬஻ொభ
బ ‫ܦ‬஻ொభ
భ Row T. p-value
A12T1='(0.75-inf)' 263 ==> class=C-I 150 Support 150 105 255 0.0018
No Support 113 139 252
Column
Total
263 244 1014
A10T1='(0.75-inf)' A12T1='(0.75-inf)' 257
==> class=C-I 143
Support 143 90 233 7.24e-005
No Support 114 149 263
Column
Total
257 239 992
A4T1='(0.75-inf)' 249 ==> class=C-I 145 Support 96 145 241 4.69e-005
No Support 146 104 250
Column
Total
242 249 982
A9T1='(-inf-0.25]' 269 ==> class=C-I 152 Support 81 152 233 7.62e-005
No Support 131 117 248
Column
Total
212 269 962
International Journal of Data Mining & Knowledge Management Process (IJDKP) Vol.4, No.4, July 2014
10
Table 6 shows the contingency table for the second branching question, ‫ܳܤ‬ଶ. As mentioned
before, the binary values of the second branching question were assigned randomly, and based on
the binary values ‫ܳܤ‬ଶ have, the combined dataset (‫ܦ‬ଵ + ‫ܦ‬ଶ) is separated into ‫ܦ‬஻ொమ
బ and ‫ܦ‬஻ொమ
భ.
Since ‫ܳܤ‬ଶ values are assigned randomly, once separated, ‫ܦ‬஻ொమ
బ and ‫ܦ‬஻ொమ
భ datasets each may
contain subjects from both ‫ܦ‬ଵ and ‫ܦ‬ଶ. Therefore, the rule extraction technique will extract the
rules or some attributes within the rules belonging to both ‫ܦ‬ଵ and ‫ܦ‬ଶ for each of the separated
data. As a result, the rules will be corrupted and therefore the support of each extracted rule will
decrease compared to the significant branching example given before.. Table 6 shows that the
association between the rules and the population is considered to be not statistically significant.
Table 7 shows the results with 10% noise where the p-values increase. Therefore, ‫ܳܤ‬ଶ is not
considered as a significant branching question.
Table 6- Bad Branching (BB) p-values for 0% Noise
Association Rules Noise: 0% ‫ܦ‬஻ொమ
బ ‫ܦ‬஻ொమ
భ Row T. p-value
A4T1='(0.75-inf)' A9T1='(-inf-0.25]' 136
==> class=C-I 117
Support 117 111 128 0.7326
No Support 19 21 40
Column T. 136 132 436
A2T1='(-inf-0.25]' A11T1='(-inf-0.25]' 132
==> class=C-I 112
Support 112 114 226 0.8610
No Support 20 18 38
Column
Total
132 132 528
A5T1='(-inf-0.25]' A7T1='(0.75-inf)' 124
==> class=C-I 107
Support 124 107 231 0.7160
No Support 17 17 34
Column
Total
141 124 530
A10T1='(0.75-inf)' A12T1='(0.75-inf)' 123
==> class=C-I 109
Support 124 109 233 0.0962
No Support 29 14 43
Column
Total
153 123 552
Table 7- Bad Branching (BB) p-values for 10% Noise
Association Rules Noise: 10% ‫ܦ‬஻ொమ
బ ‫ܦ‬஻ொమ
భ Row T. p-value
A4T1='(0.75-inf)' A9T1='(-inf-0.25]' 152
==> class=C-I 109
Support 109 109 218 0.3932
No Support 43 54 97
Column
Total
152 163 630
A10T1='(0.75-inf)' A12T1='(0.75-inf)' 158
==> class=C-I 108
Support 108 87 315 0.4590
No Support 50 49 99
Column
Total
158 136 708
A4T1='(0.75-inf)' 156 ==> class=C-I 106
Support 106 97 203 0.4721
No Support 50 55 105
Column
Total
156 152 616
International Journal of Data Mining & Knowledge Management Process (IJDKP) Vol.4, No.4, July 2014
11
A5T1='(-inf-0.25]' A7T1='(0.75-inf)' 159
==> class=C-I 110
Support 96 110 206 0.3361
No Support 55 49 104
Column
Total
151 159 620
A2T1='(-inf-0.25]' A11T1='(-inf-0.25]' 152
==> class=C-I 102
Support 104 102 206 1.0000
No Support 52 50 102
Column T. 156 152 616
As a result, ‫ܳܤ‬ଵ was defined as a significant stratifying factor that divides the dataset into two
populations with different extracted rules, whereas ‫ܳܤ‬ଶ and ‫ܳܤ‬ଷ are not significant factors.
Hence, this simulation validates that the Fisher’s Exact Test can be used to determine the
significant branching questions.
4.1.1. MESA Results of Stratification
The same experiment is then applied on the MESA dataset. The branching questions that are
extracted from the MESA data are the following:
Table 8- List of Branching Questions
Label Branching Questions
v32 Are you married, widowed, divorced, separated, or have you never married?
v41 Do you sneeze often, sometimes, rarely or never?
v53 Do you usually need to use a wheelchair, cane, crutches or walker to help you get around?
v59 Do you have any health problems which make it difficult for you to leave your home and go
visiting, shopping, or to the doctor’s?
v87 Have you ever been told by a doctor that you had high blood pressure?
v90 Have you ever been told by a doctor that you had a hernia in the groin or stomach area?
v92 Have you ever had a stroke or cerebral brain hemorrhage?
v95 Have you ever been told by a doctor that you occasionally have had transient ischemic
attacks or poor blood flow to the brain, where you seem to lose track of things that are
happening around you for up to a few minutes?
v97 Have you ever had problems with any paralysis?
v107 Have you ever had a heart attack?
v111 Has any doctor ever told you that you have or have had arthritis or rheumatism?
v125 Have you had any other disease of the nerves or muscles?
v128 Have you ever been told by a doctor that you had cancer of any kind?
v133 Have you lost any inches in height as you have gotten older?
v135 In the last 12 months how many times have you become so dizzy that you fainted or nearly
fainted?
v138 Have you broken any bones in the last 12 months?
v171 How many pregnancies have you had?
v180 Have you ever had female surgery such as on your ovaries, vagina, fallopian tubes, uterus,
rectum, or urethra?
v193 Are you currently taking any female hormones?
v207 Have you ever had any other operations on your bladder, kidneys, or any other organs in
your pelvic area or area normally covered by underpants or undershorts?
v219 Do you usually need help in getting into the bathroom or on or off of the toilet?
v220 Do you use any aids like a grab bar, or special toilet or anything else to help you with using
the toilet in your home?
International Journal of Data Mining & Knowledge Management Process (IJDKP) Vol.4, No.4, July 2014
12
v224 Do you have your regular schedule that you usually use to get you to the toilet to urinate, for
example every hour or so?
v415 Have you ever had or have you been told by a doctor that you had any kidney or bladder
problems we haven’t talked about already?
v418 Do you usually drink any liquids of any kind before you go to bed at night?
v422 Did your mother of father have a urine loss condition as an adult?
v458 Do you have any health problems that require medical attention that you have not been able
to get treated?
v496 As you know some people experience memory problems as they get older. How about your
memory? Has it become worse within the last five years?
v540 Have you ever had to stay in a nursing home overnight or longer because of a health
problem you had?
v543 Have you ever had to stay in a mental health facility overnight or longer, because of a
mental or emotional problem that you had?
v725 Do you usually take one or more naps during the day?
v737 Have you smoked at least 100 cigarettes in your entire life?
v745 Do you drink wine, beer, or liquor?
v776 Is this the same occupation that you had for most of your life?
The data is stratified based on the branching questions listed above. For many of the branching
questions there were not enough subjects for a rule to be generated (ex. not enough female
subjects taking female hormones to generate a rule). For those branching questions, a contingency
table could not be generated. Table 9 shows the contingency table for the subjects that have
undergone female surgery and the ones that have not. The p-values show that the association
between the rules and the data is not considered to be statistically significant. Therefore, female
surgery cannot be considered as a significant branching question.
Table 9-Contingecy Table of Female Surgery
Female Surgery- Association Rules ‫ܦ‬ிௌ ‫ܦ‬ேிௌ Row T. p-value
v124='(-inf-0.5]' v152='(-inf-0.5]' v178='(-
inf-0.5]' v195='(-inf-0.5]' v230='(-inf-0.5]'
v231='(-inf-0.5]' 78 ==> class=C-C 49
conf:(0.63)
Support 49 38 87
0.4988
No Support 29 29 58
Column T. 78 67 145
v120='All' v124='(-inf-0.5]' v152='(-inf-0.5]'
v178='(-inf-0.5]' v195='(-inf-0.5]' v230='(-
inf-0.5]' v231='(-inf-0.5]' 78 ==> class=C-C
49 conf:(0.63)
Support 49 38 87
0.4988
No Support 29 29 58
Column T. 78 67 145
v121='All' v124='(-inf-0.5]' v152='(-inf-0.5]'
v178='(-inf-0.5]' v195='(-inf-0.5]' v230='(-
inf-0.5]' v231='(-inf-0.5]' 78 ==> class=C-C
49 conf:(0.63)
Support 49 38 87
0.4988
No Support 29 29 58
Column T. 78 67 145
v107='(-inf-0.5]' v125='(-inf-0.5]' v199='(-
inf-0.5]' v432='(-inf-0.5]' 67 ==> class=C-I
43 conf:(0.64)
Support 32 43 75
0.1135
No Support 33 24 57
Column T. 65 67 132
v78='(-inf-0.5]' v107='(-inf-0.5]' v125='(-inf- Support 30 43 73
0.0782
International Journal of Data Mining & Knowledge Management Process (IJDKP) Vol.4, No.4, July 2014
13
0.5]' v199='(-inf-0.5]' v432='(-inf-0.5]' 67
==> class=C-I 43 conf:(0.64)
No Support 32 24 56
Column T. 62 67 129
v107='(-inf-0.5]' v120='All' v125='(-inf-0.5]'
v199='(-inf-0.5]' v432='(-inf-0.5]' 67 ==>
class=C-I 43 conf:(0.64)
Support 32 43 75
0.1135
No Support 33 24 57
Column T. 65 67 132
Table 10 shows the contingency table for the smokers and non-smokers. Here, the association
between the rules and the data is considered to be statistically significant for the rules whose p-
values are underlined in the table. Therefore, smoking is considered to be a significant branching
question. Similarly, sneezing and taking naps during the day are significant branching questions
in MESA data.
Table 10 – Contingency Table of Smoking
Smoke- Association Rules ‫ܦ‬ௌ ‫ܦ‬ேௌ Row T. p-value
v69='(-inf-0.5]' v80='(-inf-0.5]' v124='(-inf-
0.5]' v152='(-inf-0.5]' v230='(-inf-0.5]' 50
==> class=C-C 37 conf:(0.74)
Support 37 41 78
0.0064
No Support 13 42 55
Column T. 50 83 133
v69='(-inf-0.5]' v78='(-inf-0.5]' v80='(-inf-
0.5]' v124='(-inf-0.5]' v152='(-inf-0.5]'
v230='(-inf-0.5]' 50 ==> class=C-C 37
conf:(0.74)
Support 37 41 78
0.0064
No Support 13 42 55
Column T. 50 83 133
v69='(-inf-0.5]' v79='(-inf-0.5]' v80='(-inf-
0.5]' v124='(-inf-0.5]' v152='(-inf-0.5]'
v230='(-inf-0.5]' 50 ==> class=C-C 37
conf:(0.74)
Support 37 41 78
0.0064
No Support 13 42 55
Column T. 50 83 133
v78='(-inf-0.5]' v107='(-inf-0.5]' v138='(-
inf-0.5]' v432='(-inf-0.5]' 98 ==> class=C-I
58 conf:(0.59)
Support 24 58 82
0.1241
No Support 29 40 69
Column T. 53 98 151
v28='(-inf-0.5]' v78='(-inf-0.5]' v79='(-inf-
0.5]' v138='(-inf-0.5]' v432='(-inf-0.5]' 98
==> class=C-I 58 conf:(0.59)
Support 24 58 82
0.0461No Support 34 40 74
Column T. 58 98 156
v78='(-inf-0.5]' v107='(-inf-0.5]'
v120='All' v138='(-inf-0.5]' v432='(-inf-
0.5]' 98 ==> class=C-I 58 conf:(0.59)
Support 24 58 82
0.1241
No Support 29 40 69
Column T. 53 98 151
4.3. Analysis of the Stratums
The extracted rules of the significant branching questions can be used for prediction. For example
when a new patient comes into the clinic who meets the following rule v69='(-inf-0.5]' v80='(-inf-
0.5]' v124='(-inf-0.5]' v152='(-inf-0.5]' v230='(-inf-0.5]' 50 ==> class=C-C 37 conf:(0.74) , it
can be concluded that, the patient will remain continent with 74% of probability.
International Journal of Data Mining & Knowledge Management Process (IJDKP) Vol.4, No.4, July 2014
14
Next, the risk factors of different stratums (smokers/non-smokers for our case) need to be
determined separately. Relieff attribute selection is used to determine the important attributes of
each population, since our previous studies have shown that Relieff outperformed other attribute
selection techniques on the analysis of MESA dataset. (Arslanturk et al.). The extracted attributes
are defined as the risk factors. Table 11 shows the risk factors for smokers and non-smokers.
Table 11- Risk Factors of Stratums
RISKFACTORS
SMOKERS NON-SMOKERS
v211- Getting yourself wet v68- Being proud of yourself
v128- Having Cancer v128- Having Cancer
v229- Difficulties going to the bathroom
on time v719- Having an active hobby
v89- Diabetes v180- Undergone Female Surgery
v69- Feeling lonely? v74- Things are going your way?
5. CONCLUSION AND FUTURE WORK
The current study models the UI condition on the baseline using stratification based on branching
questions. The questionnaire itself may instruct a respondent to skip some not applicable
questions (skip patterns) based on the answer to a branching question. Using branching questions
to stratify data makes sense as we utilize the wisdom of experts embedded in the data through
questionnaire design processes for stratification of data by taking advantage of skip patterns’. The
significance of a branching question is determined by the calculated p-values of the Fisher’s
Exact Test. A branching question is referred as significant, when each stratum returns different
rules/risk factors when population is stratified or some risk factors/rules is missed when
population is not stratified.
There may be buckets of questions not being answered by some subjects even though they are not
constructed as skip patterns. The preceding question of those buckets can be treated as a
branching question even though it is a non branching question. The next step of the analysis is to
also stratify the population based on those non-branching questions to determine how the risk
factors may vary across sub populations.
ACKNOWLEDGMENT
This work was supported in part by NIH Grant R01AG038673
International Journal of Data Mining & Knowledge Management Process (IJDKP) Vol.4, No.4, July 2014
15
REFERENCES
[1] A.C. Diokno, B.M. Brock, M.B. Brown, et. al., “Prevalence of urinary incontinence and other
urological symptoms in the noninstutionalized elderly,” J Urol 1986; 136:1022.
[2] A.C. Diokno, C.M. Sampselle, A.R. Herzog, et. al., “Prevention of urinary incontinence by behavioral
modification program: a randomized, controlled trial among older women in the community,” J Urol
2004; 171: 1165.
[3] A.C. Diokno, M.B. Brown, B.M. Brock, et. al., “Clinical and cystometric characteristics of continent
and incontinent noninstitutionalized elderly,” J Urol 1988; 140: 567.
[4] B.Azhagusundari, A.S. Thanamani, “Feature Selection based on Information Gain” International
Journal of Innovative Technology and Exploring Engineering (IJITEE), ISSN: 2278-3075, Volume-2,
Issue-2, January 2013.
[5] J.Fagan, B. V. Greenberg, “Using Graph Theory to Analyze Skip Patterns in Questionnaires,” Bureau
of the Census, Statistical Research Division Report Series, SRD Research Report Number:
Census/SRD/RR-88/06, 1988.
[6] Lindsey R. Haas, MPH; Paul Y. Takahashi, MD; Nilay D. Shah, PhD; Robert J. Stroebel, MD;
Matthew E. Bernard, MD; Dawn M. Finnie, MPA; and James M. Naessens, ScD, “Risk-Stratification
Methods for Identifying Patients for Care Coordination”, Am J Manag Care 2013;19(9):725-732
[7] M. A. Hall. “Correlation-based Feature Subset Selection for Machine Learning,” Hamilton, New
Zealand, 1998
[8] S. Arslanturk, M. R. Siadat, T. Ogunyemi, I. Sethi, A.Diokno. “Comparison of Attribute Selection
Techniques Using Fully Controlled Simulation Based Datasets”, 2nd
International Conference on
Information Management and Evaluation 2011, Toronto, Canada
[9] S. Arslanturk, M-R. Siadat, T. Ogunyemi, K. Demirovic, A. Diokno, “Skip Pattern Analysis for
Detection of Undetermined and Inconsistent Data”, 2012 5th International Conference on BioMedical
Engineering and Informatics (BMEI 2012)
[10] W. W. Cohen: “Fast Effective Rule Induction. In: Twelfth International Conference on Machine
Learning,” 115-123, 1995.
[11] X. Su, C-L. Tsai, H. Wang, D. M. Nickerson, B. Li, “Subgroup Analysis via Recursive Partitioning”,
Journal of Machine Learning Research 10 (2009)141-158.

Mais conteúdo relacionado

Mais procurados

Descriptive research
Descriptive researchDescriptive research
Descriptive researchArifa T N
 
Bias, confounding and causality in p'coepidemiological research
Bias, confounding and causality in p'coepidemiological researchBias, confounding and causality in p'coepidemiological research
Bias, confounding and causality in p'coepidemiological researchsamthamby79
 
Cross sectional study
Cross sectional studyCross sectional study
Cross sectional studyAdugnagirma
 
Case-Control Studies
Case-Control Studies Case-Control Studies
Case-Control Studies soudfaiza
 
The feasibility and need for dimensional psychiatric diagnoses
The feasibility and need for dimensional psychiatric diagnosesThe feasibility and need for dimensional psychiatric diagnoses
The feasibility and need for dimensional psychiatric diagnosesChloe Taracatac
 
Cross sectional study by Dr Abhishek Kumar
Cross sectional study by Dr Abhishek KumarCross sectional study by Dr Abhishek Kumar
Cross sectional study by Dr Abhishek Kumarak07mail
 
From association to causation
From association to causation From association to causation
From association to causation soudfaiza
 
2-Epidemiological studies
2-Epidemiological studies2-Epidemiological studies
2-Epidemiological studiesResearchGuru
 
INTRODUCTION TO HEALTHCARE RESEARCH METHODS: Correlational Studies, Case Seri...
INTRODUCTION TO HEALTHCARE RESEARCH METHODS: Correlational Studies, Case Seri...INTRODUCTION TO HEALTHCARE RESEARCH METHODS: Correlational Studies, Case Seri...
INTRODUCTION TO HEALTHCARE RESEARCH METHODS: Correlational Studies, Case Seri...Dr. Khaled OUANES
 
Case control study
Case control studyCase control study
Case control studyswati shikha
 
Cross sectional studies
Cross sectional studiesCross sectional studies
Cross sectional studiessoudfaiza
 
Biostats epidemiological studies
Biostats epidemiological studiesBiostats epidemiological studies
Biostats epidemiological studiesJagdish Dukre
 
Judgment of causality2 kaleab
Judgment of causality2  kaleabJudgment of causality2  kaleab
Judgment of causality2 kaleabkaleabtegegne
 
Bias and confounding
Bias and confounding Bias and confounding
Bias and confounding soudfaiza
 

Mais procurados (20)

83341 ch12 jacobsen
83341 ch12 jacobsen83341 ch12 jacobsen
83341 ch12 jacobsen
 
Observational study design
Observational study designObservational study design
Observational study design
 
Case Study Control | Statistics
Case Study Control | StatisticsCase Study Control | Statistics
Case Study Control | Statistics
 
Descriptive research
Descriptive researchDescriptive research
Descriptive research
 
Case control study
Case control studyCase control study
Case control study
 
Bias, confounding and causality in p'coepidemiological research
Bias, confounding and causality in p'coepidemiological researchBias, confounding and causality in p'coepidemiological research
Bias, confounding and causality in p'coepidemiological research
 
Cross sectional study
Cross sectional studyCross sectional study
Cross sectional study
 
Case-Control Studies
Case-Control Studies Case-Control Studies
Case-Control Studies
 
The feasibility and need for dimensional psychiatric diagnoses
The feasibility and need for dimensional psychiatric diagnosesThe feasibility and need for dimensional psychiatric diagnoses
The feasibility and need for dimensional psychiatric diagnoses
 
Cross sectional study by Dr Abhishek Kumar
Cross sectional study by Dr Abhishek KumarCross sectional study by Dr Abhishek Kumar
Cross sectional study by Dr Abhishek Kumar
 
Cross sectional design
Cross sectional designCross sectional design
Cross sectional design
 
From association to causation
From association to causation From association to causation
From association to causation
 
2-Epidemiological studies
2-Epidemiological studies2-Epidemiological studies
2-Epidemiological studies
 
INTRODUCTION TO HEALTHCARE RESEARCH METHODS: Correlational Studies, Case Seri...
INTRODUCTION TO HEALTHCARE RESEARCH METHODS: Correlational Studies, Case Seri...INTRODUCTION TO HEALTHCARE RESEARCH METHODS: Correlational Studies, Case Seri...
INTRODUCTION TO HEALTHCARE RESEARCH METHODS: Correlational Studies, Case Seri...
 
Case control study
Case control studyCase control study
Case control study
 
Cross sectional studies
Cross sectional studiesCross sectional studies
Cross sectional studies
 
Biostats epidemiological studies
Biostats epidemiological studiesBiostats epidemiological studies
Biostats epidemiological studies
 
Judgment of causality2 kaleab
Judgment of causality2  kaleabJudgment of causality2  kaleab
Judgment of causality2 kaleab
 
05 intervention studies
05 intervention studies05 intervention studies
05 intervention studies
 
Bias and confounding
Bias and confounding Bias and confounding
Bias and confounding
 

Destaque

Intrusion detection system via fuzzy
Intrusion detection system via fuzzyIntrusion detection system via fuzzy
Intrusion detection system via fuzzyIJDKP
 
An experimental study on hypothyroid using rotation forest
An experimental study on hypothyroid using rotation forestAn experimental study on hypothyroid using rotation forest
An experimental study on hypothyroid using rotation forestIJDKP
 
Additive gaussian noise based data perturbation in multi level trust privacy ...
Additive gaussian noise based data perturbation in multi level trust privacy ...Additive gaussian noise based data perturbation in multi level trust privacy ...
Additive gaussian noise based data perturbation in multi level trust privacy ...IJDKP
 
FINDING FREQUENT SUBPATHS IN A GRAPH
FINDING FREQUENT SUBPATHS IN A GRAPHFINDING FREQUENT SUBPATHS IN A GRAPH
FINDING FREQUENT SUBPATHS IN A GRAPHIJDKP
 
A new clutering approach for anomaly intrusion detection
A new clutering approach for anomaly intrusion detectionA new clutering approach for anomaly intrusion detection
A new clutering approach for anomaly intrusion detectionIJDKP
 
Design and implementation for
Design and implementation forDesign and implementation for
Design and implementation forIJDKP
 
Spatio textual similarity join
Spatio textual similarity joinSpatio textual similarity join
Spatio textual similarity joinIJDKP
 
Mining frequent itemsets (mfi) over
Mining frequent itemsets (mfi) overMining frequent itemsets (mfi) over
Mining frequent itemsets (mfi) overIJDKP
 
Prediction of quality features in iberian ham by applying data mining on data...
Prediction of quality features in iberian ham by applying data mining on data...Prediction of quality features in iberian ham by applying data mining on data...
Prediction of quality features in iberian ham by applying data mining on data...IJDKP
 
TEXT CLUSTERING USING INCREMENTAL FREQUENT PATTERN MINING APPROACH
TEXT CLUSTERING USING INCREMENTAL FREQUENT PATTERN MINING APPROACHTEXT CLUSTERING USING INCREMENTAL FREQUENT PATTERN MINING APPROACH
TEXT CLUSTERING USING INCREMENTAL FREQUENT PATTERN MINING APPROACHIJDKP
 
An efficient algorithm for privacy
An efficient algorithm for privacyAn efficient algorithm for privacy
An efficient algorithm for privacyIJDKP
 
Accurate time series classification using shapelets
Accurate time series classification using shapeletsAccurate time series classification using shapelets
Accurate time series classification using shapeletsIJDKP
 
Emotion detection from text documents
Emotion detection from text documentsEmotion detection from text documents
Emotion detection from text documentsIJDKP
 
EXPERIMENTS ON HYPOTHESIS "FUZZY K-MEANS IS BETTER THAN K-MEANS FOR CLUSTERING"
EXPERIMENTS ON HYPOTHESIS "FUZZY K-MEANS IS BETTER THAN K-MEANS FOR CLUSTERING"EXPERIMENTS ON HYPOTHESIS "FUZZY K-MEANS IS BETTER THAN K-MEANS FOR CLUSTERING"
EXPERIMENTS ON HYPOTHESIS "FUZZY K-MEANS IS BETTER THAN K-MEANS FOR CLUSTERING"IJDKP
 
Data mining for prediction of human
Data mining for prediction of humanData mining for prediction of human
Data mining for prediction of humanIJDKP
 
Recommending tags for new resources
Recommending tags for new resourcesRecommending tags for new resources
Recommending tags for new resourcesIJDKP
 
IDENTIFICATION OF OUTLIERS IN OXAZOLINES AND OXAZOLES HIGH DIMENSION MOLECULA...
IDENTIFICATION OF OUTLIERS IN OXAZOLINES AND OXAZOLES HIGH DIMENSION MOLECULA...IDENTIFICATION OF OUTLIERS IN OXAZOLINES AND OXAZOLES HIGH DIMENSION MOLECULA...
IDENTIFICATION OF OUTLIERS IN OXAZOLINES AND OXAZOLES HIGH DIMENSION MOLECULA...IJDKP
 
USING GOOGLE’S KEYWORD RELATION IN MULTIDOMAIN DOCUMENT CLASSIFICATION
USING GOOGLE’S KEYWORD RELATION IN MULTIDOMAIN DOCUMENT CLASSIFICATIONUSING GOOGLE’S KEYWORD RELATION IN MULTIDOMAIN DOCUMENT CLASSIFICATION
USING GOOGLE’S KEYWORD RELATION IN MULTIDOMAIN DOCUMENT CLASSIFICATIONIJDKP
 
PATTERN GENERATION FOR COMPLEX DATA USING HYBRID MINING
PATTERN GENERATION FOR COMPLEX DATA USING HYBRID MININGPATTERN GENERATION FOR COMPLEX DATA USING HYBRID MINING
PATTERN GENERATION FOR COMPLEX DATA USING HYBRID MININGIJDKP
 
Column store databases approaches and optimization techniques
Column store databases  approaches and optimization techniquesColumn store databases  approaches and optimization techniques
Column store databases approaches and optimization techniquesIJDKP
 

Destaque (20)

Intrusion detection system via fuzzy
Intrusion detection system via fuzzyIntrusion detection system via fuzzy
Intrusion detection system via fuzzy
 
An experimental study on hypothyroid using rotation forest
An experimental study on hypothyroid using rotation forestAn experimental study on hypothyroid using rotation forest
An experimental study on hypothyroid using rotation forest
 
Additive gaussian noise based data perturbation in multi level trust privacy ...
Additive gaussian noise based data perturbation in multi level trust privacy ...Additive gaussian noise based data perturbation in multi level trust privacy ...
Additive gaussian noise based data perturbation in multi level trust privacy ...
 
FINDING FREQUENT SUBPATHS IN A GRAPH
FINDING FREQUENT SUBPATHS IN A GRAPHFINDING FREQUENT SUBPATHS IN A GRAPH
FINDING FREQUENT SUBPATHS IN A GRAPH
 
A new clutering approach for anomaly intrusion detection
A new clutering approach for anomaly intrusion detectionA new clutering approach for anomaly intrusion detection
A new clutering approach for anomaly intrusion detection
 
Design and implementation for
Design and implementation forDesign and implementation for
Design and implementation for
 
Spatio textual similarity join
Spatio textual similarity joinSpatio textual similarity join
Spatio textual similarity join
 
Mining frequent itemsets (mfi) over
Mining frequent itemsets (mfi) overMining frequent itemsets (mfi) over
Mining frequent itemsets (mfi) over
 
Prediction of quality features in iberian ham by applying data mining on data...
Prediction of quality features in iberian ham by applying data mining on data...Prediction of quality features in iberian ham by applying data mining on data...
Prediction of quality features in iberian ham by applying data mining on data...
 
TEXT CLUSTERING USING INCREMENTAL FREQUENT PATTERN MINING APPROACH
TEXT CLUSTERING USING INCREMENTAL FREQUENT PATTERN MINING APPROACHTEXT CLUSTERING USING INCREMENTAL FREQUENT PATTERN MINING APPROACH
TEXT CLUSTERING USING INCREMENTAL FREQUENT PATTERN MINING APPROACH
 
An efficient algorithm for privacy
An efficient algorithm for privacyAn efficient algorithm for privacy
An efficient algorithm for privacy
 
Accurate time series classification using shapelets
Accurate time series classification using shapeletsAccurate time series classification using shapelets
Accurate time series classification using shapelets
 
Emotion detection from text documents
Emotion detection from text documentsEmotion detection from text documents
Emotion detection from text documents
 
EXPERIMENTS ON HYPOTHESIS "FUZZY K-MEANS IS BETTER THAN K-MEANS FOR CLUSTERING"
EXPERIMENTS ON HYPOTHESIS "FUZZY K-MEANS IS BETTER THAN K-MEANS FOR CLUSTERING"EXPERIMENTS ON HYPOTHESIS "FUZZY K-MEANS IS BETTER THAN K-MEANS FOR CLUSTERING"
EXPERIMENTS ON HYPOTHESIS "FUZZY K-MEANS IS BETTER THAN K-MEANS FOR CLUSTERING"
 
Data mining for prediction of human
Data mining for prediction of humanData mining for prediction of human
Data mining for prediction of human
 
Recommending tags for new resources
Recommending tags for new resourcesRecommending tags for new resources
Recommending tags for new resources
 
IDENTIFICATION OF OUTLIERS IN OXAZOLINES AND OXAZOLES HIGH DIMENSION MOLECULA...
IDENTIFICATION OF OUTLIERS IN OXAZOLINES AND OXAZOLES HIGH DIMENSION MOLECULA...IDENTIFICATION OF OUTLIERS IN OXAZOLINES AND OXAZOLES HIGH DIMENSION MOLECULA...
IDENTIFICATION OF OUTLIERS IN OXAZOLINES AND OXAZOLES HIGH DIMENSION MOLECULA...
 
USING GOOGLE’S KEYWORD RELATION IN MULTIDOMAIN DOCUMENT CLASSIFICATION
USING GOOGLE’S KEYWORD RELATION IN MULTIDOMAIN DOCUMENT CLASSIFICATIONUSING GOOGLE’S KEYWORD RELATION IN MULTIDOMAIN DOCUMENT CLASSIFICATION
USING GOOGLE’S KEYWORD RELATION IN MULTIDOMAIN DOCUMENT CLASSIFICATION
 
PATTERN GENERATION FOR COMPLEX DATA USING HYBRID MINING
PATTERN GENERATION FOR COMPLEX DATA USING HYBRID MININGPATTERN GENERATION FOR COMPLEX DATA USING HYBRID MINING
PATTERN GENERATION FOR COMPLEX DATA USING HYBRID MINING
 
Column store databases approaches and optimization techniques
Column store databases  approaches and optimization techniquesColumn store databases  approaches and optimization techniques
Column store databases approaches and optimization techniques
 

Semelhante a Stratification of clinical survey data

Running head CRITIQUE QUANTITATIVE, QUALITATIVE, OR MIXED METHODS.docx
Running head CRITIQUE QUANTITATIVE, QUALITATIVE, OR MIXED METHODS.docxRunning head CRITIQUE QUANTITATIVE, QUALITATIVE, OR MIXED METHODS.docx
Running head CRITIQUE QUANTITATIVE, QUALITATIVE, OR MIXED METHODS.docxtodd271
 
Reply DB5 w9 researchReply discussion boards 1-jauregui.docx
Reply DB5 w9 researchReply discussion boards 1-jauregui.docxReply DB5 w9 researchReply discussion boards 1-jauregui.docx
Reply DB5 w9 researchReply discussion boards 1-jauregui.docxcarlt4
 
Critical Appraisal Of Research Essay Example Paper.docx
Critical Appraisal Of Research Essay Example Paper.docxCritical Appraisal Of Research Essay Example Paper.docx
Critical Appraisal Of Research Essay Example Paper.docxstudywriters
 
Critical Appraisal Of Research Essay Example Paper.docx
Critical Appraisal Of Research Essay Example Paper.docxCritical Appraisal Of Research Essay Example Paper.docx
Critical Appraisal Of Research Essay Example Paper.docxstudywriters
 
Critical Research Appraisal AssignmentNUR501 Philosophi
Critical Research Appraisal AssignmentNUR501 PhilosophiCritical Research Appraisal AssignmentNUR501 Philosophi
Critical Research Appraisal AssignmentNUR501 PhilosophiMargenePurnell14
 
ANSWER TO MODULE 5 ASSIGNMENT Essay
ANSWER TO MODULE 5 ASSIGNMENT EssayANSWER TO MODULE 5 ASSIGNMENT Essay
ANSWER TO MODULE 5 ASSIGNMENT EssayTammy Moncrief
 
48  january 2  vol 27 no 18  2013  © NURSING STANDARD RC.docx
48  january 2  vol 27 no 18  2013  © NURSING STANDARD  RC.docx48  january 2  vol 27 no 18  2013  © NURSING STANDARD  RC.docx
48  january 2  vol 27 no 18  2013  © NURSING STANDARD RC.docxblondellchancy
 
Alcohol use and crash risk study
Alcohol use and crash risk studyAlcohol use and crash risk study
Alcohol use and crash risk studyMr Christia
 
9Studying Vulnerable PopulationsLearning Objectives.docx
9Studying Vulnerable PopulationsLearning Objectives.docx9Studying Vulnerable PopulationsLearning Objectives.docx
9Studying Vulnerable PopulationsLearning Objectives.docxblondellchancy
 
MEASUREMENT AND STATISTICS .docx
MEASUREMENT AND STATISTICS                                        .docxMEASUREMENT AND STATISTICS                                        .docx
MEASUREMENT AND STATISTICS .docxARIV4
 
Running head PLANNING STAGE 2-(DESIGN PHASE) OF A RESEARCH PROJEC.docx
Running head PLANNING STAGE 2-(DESIGN PHASE) OF A RESEARCH PROJEC.docxRunning head PLANNING STAGE 2-(DESIGN PHASE) OF A RESEARCH PROJEC.docx
Running head PLANNING STAGE 2-(DESIGN PHASE) OF A RESEARCH PROJEC.docxjeanettehully
 
Relationship Between Medication and Fatigue.docx
Relationship Between Medication and Fatigue.docxRelationship Between Medication and Fatigue.docx
Relationship Between Medication and Fatigue.docxwrite22
 
1Methods and Statistical AnalysisName xxx
1Methods and Statistical AnalysisName xxx1Methods and Statistical AnalysisName xxx
1Methods and Statistical AnalysisName xxxMerrileeDelvalle969
 
(Critical Appraisal Tools Worksheet Template)Evalua.docx
 (Critical Appraisal Tools Worksheet Template)Evalua.docx (Critical Appraisal Tools Worksheet Template)Evalua.docx
(Critical Appraisal Tools Worksheet Template)Evalua.docxShiraPrater50
 
Running Head Operationalizing VariableRunning head Methods P.docx
Running Head Operationalizing VariableRunning head Methods P.docxRunning Head Operationalizing VariableRunning head Methods P.docx
Running Head Operationalizing VariableRunning head Methods P.docxcharisellington63520
 
Protocol on burnout
Protocol on burnoutProtocol on burnout
Protocol on burnoutRosebenter
 
Detecting flawed meta analyses
Detecting flawed meta analysesDetecting flawed meta analyses
Detecting flawed meta analysesJames Coyne
 

Semelhante a Stratification of clinical survey data (20)

Running head CRITIQUE QUANTITATIVE, QUALITATIVE, OR MIXED METHODS.docx
Running head CRITIQUE QUANTITATIVE, QUALITATIVE, OR MIXED METHODS.docxRunning head CRITIQUE QUANTITATIVE, QUALITATIVE, OR MIXED METHODS.docx
Running head CRITIQUE QUANTITATIVE, QUALITATIVE, OR MIXED METHODS.docx
 
Reply DB5 w9 researchReply discussion boards 1-jauregui.docx
Reply DB5 w9 researchReply discussion boards 1-jauregui.docxReply DB5 w9 researchReply discussion boards 1-jauregui.docx
Reply DB5 w9 researchReply discussion boards 1-jauregui.docx
 
Critical Appraisal Of Research Essay Example Paper.docx
Critical Appraisal Of Research Essay Example Paper.docxCritical Appraisal Of Research Essay Example Paper.docx
Critical Appraisal Of Research Essay Example Paper.docx
 
Critical Appraisal Of Research Essay Example Paper.docx
Critical Appraisal Of Research Essay Example Paper.docxCritical Appraisal Of Research Essay Example Paper.docx
Critical Appraisal Of Research Essay Example Paper.docx
 
Critical Research Appraisal AssignmentNUR501 Philosophi
Critical Research Appraisal AssignmentNUR501 PhilosophiCritical Research Appraisal AssignmentNUR501 Philosophi
Critical Research Appraisal AssignmentNUR501 Philosophi
 
Sample Of Research Essay
Sample Of Research EssaySample Of Research Essay
Sample Of Research Essay
 
ANSWER TO MODULE 5 ASSIGNMENT Essay
ANSWER TO MODULE 5 ASSIGNMENT EssayANSWER TO MODULE 5 ASSIGNMENT Essay
ANSWER TO MODULE 5 ASSIGNMENT Essay
 
48  january 2  vol 27 no 18  2013  © NURSING STANDARD RC.docx
48  january 2  vol 27 no 18  2013  © NURSING STANDARD  RC.docx48  january 2  vol 27 no 18  2013  © NURSING STANDARD  RC.docx
48  january 2  vol 27 no 18  2013  © NURSING STANDARD RC.docx
 
Alcohol use and crash risk study
Alcohol use and crash risk studyAlcohol use and crash risk study
Alcohol use and crash risk study
 
9Studying Vulnerable PopulationsLearning Objectives.docx
9Studying Vulnerable PopulationsLearning Objectives.docx9Studying Vulnerable PopulationsLearning Objectives.docx
9Studying Vulnerable PopulationsLearning Objectives.docx
 
MEASUREMENT AND STATISTICS .docx
MEASUREMENT AND STATISTICS                                        .docxMEASUREMENT AND STATISTICS                                        .docx
MEASUREMENT AND STATISTICS .docx
 
Week 3 educational product puckett
Week 3 educational product puckettWeek 3 educational product puckett
Week 3 educational product puckett
 
Running head PLANNING STAGE 2-(DESIGN PHASE) OF A RESEARCH PROJEC.docx
Running head PLANNING STAGE 2-(DESIGN PHASE) OF A RESEARCH PROJEC.docxRunning head PLANNING STAGE 2-(DESIGN PHASE) OF A RESEARCH PROJEC.docx
Running head PLANNING STAGE 2-(DESIGN PHASE) OF A RESEARCH PROJEC.docx
 
Relationship Between Medication and Fatigue.docx
Relationship Between Medication and Fatigue.docxRelationship Between Medication and Fatigue.docx
Relationship Between Medication and Fatigue.docx
 
1Methods and Statistical AnalysisName xxx
1Methods and Statistical AnalysisName xxx1Methods and Statistical AnalysisName xxx
1Methods and Statistical AnalysisName xxx
 
(Critical Appraisal Tools Worksheet Template)Evalua.docx
 (Critical Appraisal Tools Worksheet Template)Evalua.docx (Critical Appraisal Tools Worksheet Template)Evalua.docx
(Critical Appraisal Tools Worksheet Template)Evalua.docx
 
Running Head Operationalizing VariableRunning head Methods P.docx
Running Head Operationalizing VariableRunning head Methods P.docxRunning Head Operationalizing VariableRunning head Methods P.docx
Running Head Operationalizing VariableRunning head Methods P.docx
 
Protocol on burnout
Protocol on burnoutProtocol on burnout
Protocol on burnout
 
CPT.BigHealthcareData.2016
CPT.BigHealthcareData.2016CPT.BigHealthcareData.2016
CPT.BigHealthcareData.2016
 
Detecting flawed meta analyses
Detecting flawed meta analysesDetecting flawed meta analyses
Detecting flawed meta analyses
 

Último

My Hashitalk Indonesia April 2024 Presentation
My Hashitalk Indonesia April 2024 PresentationMy Hashitalk Indonesia April 2024 Presentation
My Hashitalk Indonesia April 2024 PresentationRidwan Fadjar
 
"Debugging python applications inside k8s environment", Andrii Soldatenko
"Debugging python applications inside k8s environment", Andrii Soldatenko"Debugging python applications inside k8s environment", Andrii Soldatenko
"Debugging python applications inside k8s environment", Andrii SoldatenkoFwdays
 
What's New in Teams Calling, Meetings and Devices March 2024
What's New in Teams Calling, Meetings and Devices March 2024What's New in Teams Calling, Meetings and Devices March 2024
What's New in Teams Calling, Meetings and Devices March 2024Stephanie Beckett
 
Connect Wave/ connectwave Pitch Deck Presentation
Connect Wave/ connectwave Pitch Deck PresentationConnect Wave/ connectwave Pitch Deck Presentation
Connect Wave/ connectwave Pitch Deck PresentationSlibray Presentation
 
Transcript: New from BookNet Canada for 2024: BNC CataList - Tech Forum 2024
Transcript: New from BookNet Canada for 2024: BNC CataList - Tech Forum 2024Transcript: New from BookNet Canada for 2024: BNC CataList - Tech Forum 2024
Transcript: New from BookNet Canada for 2024: BNC CataList - Tech Forum 2024BookNet Canada
 
Vertex AI Gemini Prompt Engineering Tips
Vertex AI Gemini Prompt Engineering TipsVertex AI Gemini Prompt Engineering Tips
Vertex AI Gemini Prompt Engineering TipsMiki Katsuragi
 
Developer Data Modeling Mistakes: From Postgres to NoSQL
Developer Data Modeling Mistakes: From Postgres to NoSQLDeveloper Data Modeling Mistakes: From Postgres to NoSQL
Developer Data Modeling Mistakes: From Postgres to NoSQLScyllaDB
 
Integration and Automation in Practice: CI/CD in Mule Integration and Automat...
Integration and Automation in Practice: CI/CD in Mule Integration and Automat...Integration and Automation in Practice: CI/CD in Mule Integration and Automat...
Integration and Automation in Practice: CI/CD in Mule Integration and Automat...Patryk Bandurski
 
Are Multi-Cloud and Serverless Good or Bad?
Are Multi-Cloud and Serverless Good or Bad?Are Multi-Cloud and Serverless Good or Bad?
Are Multi-Cloud and Serverless Good or Bad?Mattias Andersson
 
Designing IA for AI - Information Architecture Conference 2024
Designing IA for AI - Information Architecture Conference 2024Designing IA for AI - Information Architecture Conference 2024
Designing IA for AI - Information Architecture Conference 2024Enterprise Knowledge
 
Advanced Test Driven-Development @ php[tek] 2024
Advanced Test Driven-Development @ php[tek] 2024Advanced Test Driven-Development @ php[tek] 2024
Advanced Test Driven-Development @ php[tek] 2024Scott Keck-Warren
 
Powerpoint exploring the locations used in television show Time Clash
Powerpoint exploring the locations used in television show Time ClashPowerpoint exploring the locations used in television show Time Clash
Powerpoint exploring the locations used in television show Time Clashcharlottematthew16
 
"ML in Production",Oleksandr Bagan
"ML in Production",Oleksandr Bagan"ML in Production",Oleksandr Bagan
"ML in Production",Oleksandr BaganFwdays
 
Artificial intelligence in cctv survelliance.pptx
Artificial intelligence in cctv survelliance.pptxArtificial intelligence in cctv survelliance.pptx
Artificial intelligence in cctv survelliance.pptxhariprasad279825
 
"Subclassing and Composition – A Pythonic Tour of Trade-Offs", Hynek Schlawack
"Subclassing and Composition – A Pythonic Tour of Trade-Offs", Hynek Schlawack"Subclassing and Composition – A Pythonic Tour of Trade-Offs", Hynek Schlawack
"Subclassing and Composition – A Pythonic Tour of Trade-Offs", Hynek SchlawackFwdays
 
Unraveling Multimodality with Large Language Models.pdf
Unraveling Multimodality with Large Language Models.pdfUnraveling Multimodality with Large Language Models.pdf
Unraveling Multimodality with Large Language Models.pdfAlex Barbosa Coqueiro
 
CloudStudio User manual (basic edition):
CloudStudio User manual (basic edition):CloudStudio User manual (basic edition):
CloudStudio User manual (basic edition):comworks
 
Nell’iperspazio con Rocket: il Framework Web di Rust!
Nell’iperspazio con Rocket: il Framework Web di Rust!Nell’iperspazio con Rocket: il Framework Web di Rust!
Nell’iperspazio con Rocket: il Framework Web di Rust!Commit University
 
Anypoint Exchange: It’s Not Just a Repo!
Anypoint Exchange: It’s Not Just a Repo!Anypoint Exchange: It’s Not Just a Repo!
Anypoint Exchange: It’s Not Just a Repo!Manik S Magar
 
"Federated learning: out of reach no matter how close",Oleksandr Lapshyn
"Federated learning: out of reach no matter how close",Oleksandr Lapshyn"Federated learning: out of reach no matter how close",Oleksandr Lapshyn
"Federated learning: out of reach no matter how close",Oleksandr LapshynFwdays
 

Último (20)

My Hashitalk Indonesia April 2024 Presentation
My Hashitalk Indonesia April 2024 PresentationMy Hashitalk Indonesia April 2024 Presentation
My Hashitalk Indonesia April 2024 Presentation
 
"Debugging python applications inside k8s environment", Andrii Soldatenko
"Debugging python applications inside k8s environment", Andrii Soldatenko"Debugging python applications inside k8s environment", Andrii Soldatenko
"Debugging python applications inside k8s environment", Andrii Soldatenko
 
What's New in Teams Calling, Meetings and Devices March 2024
What's New in Teams Calling, Meetings and Devices March 2024What's New in Teams Calling, Meetings and Devices March 2024
What's New in Teams Calling, Meetings and Devices March 2024
 
Connect Wave/ connectwave Pitch Deck Presentation
Connect Wave/ connectwave Pitch Deck PresentationConnect Wave/ connectwave Pitch Deck Presentation
Connect Wave/ connectwave Pitch Deck Presentation
 
Transcript: New from BookNet Canada for 2024: BNC CataList - Tech Forum 2024
Transcript: New from BookNet Canada for 2024: BNC CataList - Tech Forum 2024Transcript: New from BookNet Canada for 2024: BNC CataList - Tech Forum 2024
Transcript: New from BookNet Canada for 2024: BNC CataList - Tech Forum 2024
 
Vertex AI Gemini Prompt Engineering Tips
Vertex AI Gemini Prompt Engineering TipsVertex AI Gemini Prompt Engineering Tips
Vertex AI Gemini Prompt Engineering Tips
 
Developer Data Modeling Mistakes: From Postgres to NoSQL
Developer Data Modeling Mistakes: From Postgres to NoSQLDeveloper Data Modeling Mistakes: From Postgres to NoSQL
Developer Data Modeling Mistakes: From Postgres to NoSQL
 
Integration and Automation in Practice: CI/CD in Mule Integration and Automat...
Integration and Automation in Practice: CI/CD in Mule Integration and Automat...Integration and Automation in Practice: CI/CD in Mule Integration and Automat...
Integration and Automation in Practice: CI/CD in Mule Integration and Automat...
 
Are Multi-Cloud and Serverless Good or Bad?
Are Multi-Cloud and Serverless Good or Bad?Are Multi-Cloud and Serverless Good or Bad?
Are Multi-Cloud and Serverless Good or Bad?
 
Designing IA for AI - Information Architecture Conference 2024
Designing IA for AI - Information Architecture Conference 2024Designing IA for AI - Information Architecture Conference 2024
Designing IA for AI - Information Architecture Conference 2024
 
Advanced Test Driven-Development @ php[tek] 2024
Advanced Test Driven-Development @ php[tek] 2024Advanced Test Driven-Development @ php[tek] 2024
Advanced Test Driven-Development @ php[tek] 2024
 
Powerpoint exploring the locations used in television show Time Clash
Powerpoint exploring the locations used in television show Time ClashPowerpoint exploring the locations used in television show Time Clash
Powerpoint exploring the locations used in television show Time Clash
 
"ML in Production",Oleksandr Bagan
"ML in Production",Oleksandr Bagan"ML in Production",Oleksandr Bagan
"ML in Production",Oleksandr Bagan
 
Artificial intelligence in cctv survelliance.pptx
Artificial intelligence in cctv survelliance.pptxArtificial intelligence in cctv survelliance.pptx
Artificial intelligence in cctv survelliance.pptx
 
"Subclassing and Composition – A Pythonic Tour of Trade-Offs", Hynek Schlawack
"Subclassing and Composition – A Pythonic Tour of Trade-Offs", Hynek Schlawack"Subclassing and Composition – A Pythonic Tour of Trade-Offs", Hynek Schlawack
"Subclassing and Composition – A Pythonic Tour of Trade-Offs", Hynek Schlawack
 
Unraveling Multimodality with Large Language Models.pdf
Unraveling Multimodality with Large Language Models.pdfUnraveling Multimodality with Large Language Models.pdf
Unraveling Multimodality with Large Language Models.pdf
 
CloudStudio User manual (basic edition):
CloudStudio User manual (basic edition):CloudStudio User manual (basic edition):
CloudStudio User manual (basic edition):
 
Nell’iperspazio con Rocket: il Framework Web di Rust!
Nell’iperspazio con Rocket: il Framework Web di Rust!Nell’iperspazio con Rocket: il Framework Web di Rust!
Nell’iperspazio con Rocket: il Framework Web di Rust!
 
Anypoint Exchange: It’s Not Just a Repo!
Anypoint Exchange: It’s Not Just a Repo!Anypoint Exchange: It’s Not Just a Repo!
Anypoint Exchange: It’s Not Just a Repo!
 
"Federated learning: out of reach no matter how close",Oleksandr Lapshyn
"Federated learning: out of reach no matter how close",Oleksandr Lapshyn"Federated learning: out of reach no matter how close",Oleksandr Lapshyn
"Federated learning: out of reach no matter how close",Oleksandr Lapshyn
 

Stratification of clinical survey data

  • 1. International Journal of Data Mining & Knowledge Management Process (IJDKP) Vol.4, No.4, July 2014 DOI : 10.5121/ijdkp.2014.4401 1 STRATIFICATION OF CLINICAL SURVEY DATA USING CONTINGENCY TABLES Suzan Arslanturk1 , Mohammad-Reza Siadat1 , Theophilus Ogunyemi2 , Brendhan Givens1 , Ananias Diokno3 1 Dept of Comp Science and Engineering, Oakland University, Rochester, MI 48309, USA 2 Department of Mathematics and Statistics, Oakland University, Rochester, MI 48309, USA 3 Beaumont Health System, William Beaumont Hospital, Royal Oak, MI 48073, USA ABSTRACT Data stratification is the process of partitioning the data into distinct and non-overlapping groups since the study population consists of subpopulations that are of particular interest. In clinical data, once the data is stratified into sub populations based on a significant stratifying factor, different risk factors can be determined from each subpopulation. In this paper, the Fisher’s Exact Test is used to determine the significant stratifying factors. The experiments are conducted on a simulated study and the Medical, Epidemiological and Social Aspects of Aging (MESA) data constructed for prediction of urinary incontinence. Results show that, smoking is the most significant stratifying factor of MESA data, showing that the smokers and non-smokers indicates different risk factors towards urinary incontinence and should be treated differently. KEYWORDS Contingency Tables, Medical Survey Data, Stratification, Subgroup Analysis 1. INTRODUCTION In clinical survey data, it is common for subjects to have their own unique set of answers to the questionnaire. However, the subjects can be grouped into populations based on common answers to specific questions. It is important to divide the dataset into sub-populations based on these questions that have common answers for each population. This will help us to investigate heterogeneous results, or to answer specific questions about particular patients groups and to see whether and how risk factors vary across sub populations. This approach leads us to extract maximum amount of information from the data and gives the clinicians the possibility to apply different treatments for different groups of people. It is important based on what questions to divide (stratify) the population into groups, which we will refer as the stratifying factors throughout this paper. This study proposes a method that shows how to stratify a population based on a simulated study and a longitudinal clinical survey data.
  • 2. International Journal of Data Mining & Knowledge Management Process (IJDKP) Vol.4, No.4, July 2014 2 A survey data may instruct a respondent to skip some irrelevant questions based on the answer to a previous branching question. A branching question precedes sets of alternative questions and its response determines which alternative set of questions to be answered by a respondent. The questions in the unvisited alternative paths are referred to as skip patterns. Leaving a question unanswered about number of cigarettes smoked by a non-smoker respondent when the questionnaire instructs such person to skip this question is an example of a skip pattern. When the dataset of interest contains skip patterns, it is important to stratify the data based on the branching questions in order to evaluate each stratum independently. Su et al. have focused on a comparative study where two or more treatments are compared and how the treatment effect varies across subgroups induced by covariates. Treatment effect can be defined as the amount of change in a condition or symptom because of receiving a treatment compared to not receiving the treatment. They have considered a binary treatment effect (0 or 1), a continuous output and a number of covariates where the components are of mixed types (categorical and continuous). They have used a tree-structured subgroup analyses algorithm since; the tree algorithm is a well-known tool for determining the interactions between the treatment and the covariates. Their goal in subgroup analysis is to find out whether there exist subgroups of individuals in which the treatment shows heterogeneous effects, and if so, how the treatment effect varies across them. By recursively partitioning the data into two subgroups that show the greatest heterogeneity in the treatment effect, they were able to optimize the subgroup analyses. They have used simulated studies to validate their approach. Also, they have used the Current Population Survey (CPS) database conducted by the U.S Census Bureau for the Bureau of Labor and Statistics, in 2004. The CPS is a survey data of 60.000 households. The investigators were interested in specific subgroups of the working population where the pay gap between sexes is dominant. The questions in the survey were related to some demographic characteristics of the respondents, the employment status, hours worked and the income earned from their work. There were different covariates in the data such as gender, age, education, race, citizenship, tax status, etc. The results show that for most of the subgroups that constitute the majority of the population, women are paid significantly less than men. Also, the wage disparity between men and women varies with the industry, occupation and age. In our study, on the other hand, instead of recursively partitioning the data into sub populations, we are using the branching questions leading the skip patterns to occur as our stratifying factor. Subgroup analyses are a highly subjective process since the subgroups themselves as well as the number of subgroups are determined by the investigator beforehand (Assmann et al. 2000). It is important to determine which specific subgroup to use in the experiment. The incorrect selection of the subgroups may cause unreliable results. Therefore, significance testing is a common approach in subgroup analyses. That is, testing the numerous plausible possibilities to see which subgroup performs better. However, this approach cannot be considered as an efficient way of splitting the data. We are utilizing the wisdom of experts embedded in the data through the questionnaire design processes when selecting the branching questions as stratifying factors. There have been several studies on determining variables that are important for understanding the underlying phenomena of interest. It is important to reduce the dimension of original data prior to any modeling. Different attribute selection techniques have been used in order to reduce the dimensionality and the computational complexity (Azhagusundari et al.). The attributes that are significant can be extracted, ranked and weights can be assigned to each attribute to compare the significance. Decision trees based on information gain techniques have been widely used in order to perform feature selection. Decision trees divide the population into subgroups recursively until the leaf nodes represents the class labels. However, in this
  • 3. International Journal of Data Mining & Knowledge Management Process (IJDKP) Vol.4, No.4, July 2014 3 study the feature selection techniques cannot be directly used in order to determine the significant branching questions, since the class labels of individual subject is irrelevant. Instead high support and confidence for prospective extracted rules from each stratum is of interest. That is, a population with mixed class labels in a stratum would be favorable as long as it lends itself to rules with high confidence factor and support. For instance, smoking could be a significant branching question if the rules applied to smokers are different than those applied to non- smokers. However, there could be populations with mixed class labels in smokers and non- smokers groups. Risk stratification in clinical data is used to divide patients into different acuity levels and to determine a person's risk for suffering a particular condition and the need for preventive intervention. Haas et. al have used several risk stratification techniques to evaluate the performance in predicting healthcare utilization. They have studied 83 patients empanelled in 2009 and 2010 in a primary care practice. 7 different risk stratification techniques were used: Adjusted Clinical Groups (ACGs), Hierarchical Condition Categories (HCCs), Elder Risk Assessment, Chronic Co morbidity Count, Charlson Co morbidity Index, and Minnesota Health Care Home Tiering and a combination of Minnesota Tiering and ERA. To predict the healthcare utilization and cost, historical data (data from 2009) have been used by a logistic regression model using demographic characteristics and diagnosis such as emergency department visits, hospitalizations, 30 day readmissions. The results show that ACG model outperforms the other risk stratification methods. They have studied data stratification based on the acuity of each patient and generated different results for each stratum. However, in our study the stratifying factor is unknown beforehand and needs to be determined from the existing branching questions by using statistical methods. The Medical, Epidemiological and Social Aspects of Aging (MESA) data focuses on different aspects of aging including the Urinary Incontinence (UI) of elderly women. It is a longitudinal dataset containing a baseline and three follow-up surveys. In this study, we will consider the baseline and the first follow-up. The baseline of MESA is collected in 1983. The investigators surveyed 1957 respondents, 596 of whom were women aged 60 years and older. The respondents were interviewed for approximately 2 hours at home at baseline (1983-1984 interviews) and then re-interviewed at 1-2 year intervals. The respondents are interviewed on a variety of health related questions that may play a role in the prevalence of urinary incontinence (UI). The class labels of the MESA data are ‘continent’ and ‘incontinent’ indicating the respondent’s outcome. Although, the survey focused on the epidemiology of UI, many other attributes were also assessed including medical history, mobility, cognitive function, current health, and quality of life. The baseline of the MESA dataset contains 34 branching questions which are listed in the paper. The patients in the MESA dataset are stratified into different populations based on each branching question. A statistical method is used to determine the significant branching questions, i.e. the branching questions that split the dataset into two significantly diverse populations. Once the two sub-populations are explored, the index estimation and the risk factor analyses can be performed on those populations. This paper is organized as follows: In Section 2 the statistical method of identifying significant branching questions is examined. Section 3 describes the validation for the simulated data. Section 4 presents the results for the simulated data and the MESA data along with the risk factor analyses on each stratum. Finally, Section 5 presents our conclusion and future work.
  • 4. International Journal of Data Mining & Knowledge Management Process (IJDKP) Vol.4, No.4, July 2014 4 2. METHOD Fisher’s Exact Test is a statistical significance test used in the analysis of contingency tables. It is used for all sample sizes. The significance of the deviation from a null hypothesis can be calculated exactly. Therefore, it is not necessary to rely on an approximation that becomes exact in the limit as the sample size grows to infinity. The Fisher’s Exact Test is used to determine if there are nonrandom associations between the two variables. As mentioned before, the dataset is divided into sub populations (‫ܿ݊ܽݎܤ‬ℎଵ, ‫ܿ݊ܽݎܤ‬ℎଶ) based on each branching question. Even though, this method can be applied on each question, we limit the number of tests we are using by the branching questions for the following reason: when dividing the population into subgroups, the split is induced by a threshold which is determined by the expert knowledge for each branching question. However, for each non-branching question determining a threshold for each type of answer (categorical, binary, numeric) may lead to incorrect classifications. Table 1 shows a contingency table where the p values are calculated by the following formula: ܲ = ቀ ൫ࢇశ࢈ ࢇ ൯ ൫ࢉశࢊ ࢉ ൯ቁ ൫ ࢔ ࢇశࢉ൯ = ሺ௔ା௕ሻ!ሺ௖ାௗሻ!ሺ௔ା௖ሻ!ሺ௕ାௗሻ! ௔!௕!௖!ௗ!௡! Here, ܴଵ, ܴଶ, ܽ݊݀ ܴଷ are association rules extracted from datasets ‫ܿ݊ܽݎܤ‬ℎଵ or ‫ܿ݊ܽݎܤ‬ℎଶ. The values ܽ, ܾ, ܿ and ݀ are the number of subjects that support/contradict the extracted rules in those two datasets. A different contingency table needs to be generated for each branching question. Since MESA dataset contains 1957 subjects, the high values used in the formula above resulted in computational considerations. Therefore, the Fisher’s Exact Test calculation is modified as shown below. Table 1 – Contingency Table for Stratification ࡮࢘ࢇ࢔ࢉࢎ૚ ࡮࢘ࢇ࢔ࢉࢎ૛ Row Total ࡾ૚ # of subjects that support ܴଵ ܽ ܾ ܽ + ܾ # of subjects that contradict ܴଵ ܿ ݀ ܿ + ݀ Column Total ܽ + ܿ ܾ + ݀ ܽ + ܾ + ܿ + ݀ ࡾ૛ # of subjects that support ܴଶ # of subjects that contradict ܴଶ … … … ࡾ࢔ # of subjects that support ܴ௡ # of subjects that contradict ܴ௡ ‫ݐݑ݌݊ܫ‬ = ‫݁݊݋‬ ‫݈ܾ݁ܽ݅ݎܽݒ‬ ‫ݔ‬ − 2‫2ݔ‬ ݀ܽ‫ܽݐ‬ ݉ܽ‫ݔ݅ݎݐ‬ ‫݊ܭ‬ = ‫݉ݑݏ‬ሺ‫,ݔ‬ 2ሻ; ܵ݊ = ‫݉ݑݏ‬ሺ‫ݔ‬ሻ; ܰ = ‫݉ݑݏ‬ሺ‫݊ܭ‬ሻ; %ܴ݁ܽ‫݁݃݊ܽݎݎ‬ ‫ݐ‬ℎ݁ ‫ݐ‬ℎ‫݁݁ݎ‬ ݉ܽ‫ݏ݁ܿ݅ݎݐ‬ ݂݅ ݅‫ݐ‬ ݅‫ݏ‬ ݊݁ܿ݁‫.ݕݎܽݏݏ‬
  • 5. International Journal of Data Mining & Knowledge Management Process (IJDKP) Vol.4, No.4, July 2014 5 ‫ݐݎ݋ݏ‬ሺ‫݊ܭ‬ሻ ‫ݐݎ݋ݏ‬ሺܵ݊ሻ %‫݁ݐܽݎ݁݊݁ܩ‬ ‫ݐ‬ℎ݁ ݂‫݃݊݅ݓ݋݈݈݋‬ ݈‫.݌݋݋‬ ݅݊݀݁‫ݔ‬ = 0: 1: ݉݅݊ሺ‫݊ܭ‬ሺ1ሻ, ܵ݊ሺ1ሻሻ ‫ݖ‬ = [݅݊݀݁‫;ݔ‬ ‫݊ܭ‬ሺ2ሻ − ܵ݊ሺ1ሻ + ݅݊݀݁‫;ݔ‬ ‫݊ܭ‬ሺ1ሻ − ݅݊݀݁‫;ݔ‬ ܵ݊ሺ1ሻ − ݅݊݀݁‫;ݔ‬ ] ݊‫݌‬ = ‫ݏ݋ݎ݁ݖ‬ሺ1, ݈݁݊݃‫ݐ‬ℎሺ݅݊݀݁‫ݔ‬ሻሻ; ݈‫ݖ‬ = ݈‫݃݋‬ሺ‫ݖ‬ሻ %ܷ‫݁ݏ‬ ‫ݐ‬ℎ݁ ݈݃ܽ݉݉ܽ݊ሺሻ ݂‫݊݋݅ݐܿ݊ݑ‬ ‫݋ݐ‬ ‫݁ܿݑ݀݁ݎ‬ ‫ݐ‬ℎ݁ ܿ‫݈ܽ݊݋݅ݐܽݐݑ݌݉݋‬ ܿ‫ݕݐ݅ݔ݈݁݌݉݋‬ ݊‫݌‬ሺ1ሻ = ‫݉ݑݏ‬ሺ݈݃ܽ݉݉ܽ݊ሺ[‫݊ܭ‬ሺ2ሻ + 1 ܵ݊ሺ2ሻ + 1]ሻ − ݈݃ܽ݉݉ܽ݊ሺ[ܰ + 1 ‫ݖ‬ሺ2ሻ + 1]ሻሻ ݂ = ‫݉ݑݏ‬ሺ݈‫ݖ‬ሺ3: 4,1:݁݊݀ − 1ሻሻ − ‫݉ݑݏ‬ሺ݈‫ݖ‬ሺ1: 2,2: ݁݊݀ሻሻ ݊‫݌‬ሺ2: ݁݊݀ሻ = ݊‫݌‬ሺ1ሻ + ܿ‫݉ݑݏ݉ݑ‬ሺ݂ሻ %݁‫݌ݔ‬ሺሻ‫݀݁ݏݑ‬ ܾ݁ܿܽ‫݁ݏݑ‬ ‫݂݋‬ ݈݃ܽ݉݉ܽ݊ሺሻ ݊‫݌‬ = ݁‫݌ݔ‬ሺ݊‫݌‬ሻ; ܹ = ‫ݔ‬ሺ1ሻ + 1 %‫ݐ‬ℎ݁݊ ܿ‫݁ݐݑ݌݉݋‬ ‫ݐ‬ℎ݁ ‫݌‬ − ‫ݏ݁ݑ݈ܽݒ‬ ܲ‫݁ݑ݈ܽݒ‬ = [ ܲ 0.5 ∗ ݊‫݌‬ሺܹሻ + ‫݉ݑݏ‬ሺ݊‫݌‬ሺ݊‫݌‬ < ݊‫݌‬ሺܹሻሻሻ] Algorithm 1- Fisher’s Exact Test 3. SIMULATION The simulation is created by generating two independent binary datasets. The first dataset D1 and the second dataset D2 both contain 1000 subjects where ܵଵ = ሼܵଵଵ, ܵଶଵ, ܵଷଵ, … , ܵଵ଴଴଴ ଵሽ is the subject set of ‫ܦ‬ଵ and ܵଶ = ሼܵଵଶ, ܵଶଶ, ܵଷଶ, … , ܵଵ଴଴଴ ଶሽ is the subject set of ‫ܦ‬ଶ and 15 common attributes ሺ‫ܣ‬ = ሼ‫ܣ‬ଵ, ‫ܣ‬ଶ, ‫ܣ‬ଷ, … , ‫ܣ‬ଵହሽሻ. Three different rules are embedded to each dataset. The rules are generated in the sense that none of the rules contradict with another rule. There is no attribute being used in more than one rule. The class labels contain both the classes from the baseline and the first follow up. ‘‫ܥ‬ − ‫’ܫ‬ is an example of a response indicating that the subject was continent in the baseline and became incontinent in the first follow-up. The rules that are embedded to D1 are as follows: ܴଵଵ = ‫1ܣ‬ = 0 & ‫3ܣ‬ = 1 ⇒ ‫ܫ‬ − ‫ܥ‬ ܴଶଵ = ‫5ܣ‬ = 0 & ‫7ܣ‬ = 1 ⇒ ‫ܥ‬ − ‫ܫ‬ ܴଷଵ = ‫01ܣ‬ = 1 & ‫21ܣ‬ = 1 ⇒ ‫ܥ‬ − ‫ܫ‬ The rules that are embedded to D2 are as follows: ܴଵଶ = ‫2ܣ‬ = 0 & ‫11ܣ‬ = 0 ⇒ ‫ܥ‬ − ‫ܫ‬ ܴଶଶ = ‫4ܣ‬ = 1 & ‫9ܣ‬ = 0 ⇒ ‫ܥ‬ − ‫ܫ‬ ܴଷଶ = ‫6ܣ‬ = 0 & ‫8ܣ‬ = 1 ⇒ ‫ܫ‬ − ‫ܥ‬ The two datasets are then combined. The combination ሺ‫ܦ‬ଵ + ‫ܦ‬ଶሻ, have 2000 subjects ܵ஽భା஽మ = ሼܵଵଵ, ܵଶଵ, ܵଷଵ, … , ܵଵ଴଴଴ ଵ, ܵଵଶ, ܵଶଶ, ܵଷଶ, … , ܵଵ଴଴଴ ଶሽ and 15 attributes ሺ‫ܣ‬ = ሼ‫ܣ‬ଵ, ‫ܣ‬ଶ, ‫ܣ‬ଷ, … , ‫ܣ‬ଵହሽሻ. Three attributes are then added to the combined dataset. Those attributes each represent a branching question having binary values. First branching question ‫ܳܤ‬ଵ, takes value ‘0’ for each subject existing in ‫ܦ‬ଵ and value ‘1’ for each subject existing in ‫ܦ‬ଶ. The second and third branching questions, ‫ܳܤ‬ଶ and ‫ܳܤ‬ଷ take random binary values.
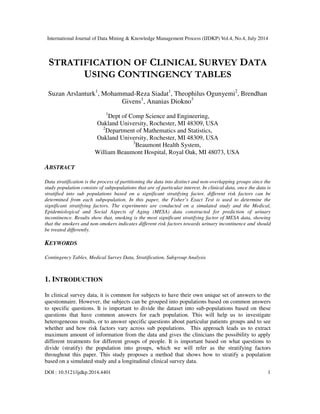
  • 6. International Journal of Data Mining & Knowledge Management Process (IJDKP) Vol.4, No.4, July 2014 6 Figure 1- Simulation of Stratification The combined dataset is then separated into two subsets based on the values of each branching question. The subset for ‫ܳܤ‬ଵ taking value ‘0’ is ‫ܦ‬஻ொభ బ and the subset for ‫ܳܤ‬ଵ taking value ‘1’ is ‫ܦ‬஻ொభ భ, similarly the subsets for ‫ܳܤ‬ଶ are ‫ܦ‬஻ொమ బ and ‫ܦ‬஻ொమ భ and the subsets for ‫ܳܤ‬ଷ are ‫ܦ‬஻ொయ బ and ‫ܦ‬஻ொయ భ. Figure 1 shows an example of the combined dataset with branching questions that are separated. The association rule mining algorithm, Apriori, is used to extract the rules of each subset. Apriori is an association rule that iteratively reduces the minimum support until it finds the required number of rules with the given minimum confidence (W. Cohen). Once the rules are extracted for each subset, a contingency table is created for each branching question. A contingency table is a matrix format that displays the frequency distribution of the variables. The rows of the contingency table denote the rules associated with that branching question. The columns are the subsets. For example, for ‫ܳܤ‬ଶ, the rows of the contingency table are the rules extracted from subset ࡰ࡮ࡽ૛ ૙ and ࡰ࡮ࡽ૛ ૚, respectively. The columns are the datasets ࡰ࡮ࡽ૛ ૙ and ࡰ࡮ࡽ૛ ૚. The contingency table is created to display the relative frequencies, i.e. the support/no support of each rule for each subset. Once the contingency table is created, the p-values are calculated using the Fisher’s Exact Test explained in the Methods Section. Based on the p-values that are calculated, we can determine the branching questions that are statistically significant. A branching question is a good stratifying factor when it is statistically significant, since different rules (hence different risk factors and predictive factors) are extracted from its sub populations. Therefore, those two sub populations cannot be treated the same. If data is not stratified into sub populations when the branching question is determined to be significant, one may skip some important risk factors and predictive factors.
  • 7. International Journal of Data Mining & Knowledge Management Process (IJDKP) Vol.4, No.4, July 2014 7 4. RESULTS 4.1 Simulation Results of Stratification The contingency tables for three branching questions for the simulated study are analyzed. Table 2 shows the simulation results of stratification with no noise. As mentioned before, the first three rules ሺܴଵଵ, ܴଶଵ, ܴଷଵሻ are extracted from the dataset that contains the subjects that have ‫ܳܤ‬ଵ ଵ = 0, denoted by ‫ܦ‬஻ொభ భ, and the last three rules ሺܴଵଶ, ܴଶଶ, ܴଷଶሻ are extracted from the dataset that contains the subjects that have ‫ܳܤ‬ଵ ଶ = 1, denoted by ‫ܦ‬஻ொభ మ. Since the first branching question, ‫ܳܤ‬ଵ, was designed to separate datasets ‫ܦ‬ଵ and ‫ܦ‬ଶ, it is expected to extract the same rules listed in Section 3 ሺܴଵଵ, ܴଶଵ, ܴଷଵ ܽ݊݀ ܴଵଶ, ܴଶଶ, ܴଷଶ ) for subsets, ‫ܦ‬஻ொభ భ and ‫ܦ‬஻ொభ మ. The rules extracted from ‫ܦ‬஻ொభ భ are the same as the rules extracted from ‫ܦ‬ଵ, and the rules extracted from ‫ܦ‬஻ொభ మ are the same as the rules extracted from ‫ܦ‬ଶ. Note that, the support of the first three rules ሺܴଵଵ, ܴଶଵ, ܴଷଵሻ of dataset ‫ܦ‬஻ொభ భ, is much higher than the support of the first three rules ሺܴଵଵ, ܴଶଵ, ܴଷଵሻ of dataset ‫ܦ‬஻ொభ మ and the non-support of the first three rules ሺܴଵଵ, ܴଶଵ, ܴଷଵሻ of dataset ‫ܦ‬஻ொభ భ is equal to 0. The reason of the non-support being 0 is that, the rules are generated in the sense that none of the rules contradict with any other. Likewise, for the second branch, ‫ܳܤ‬ଵ ଶ , we expect to see a lower support and a higher nonsupport compared to ‫ܳܤ‬ଵ ଵ , for the first three rules. Notice that, for the last three rules the support of ‫ܳܤ‬ଵ ଶ is higher than ‫ܳܤ‬ଵ ଵ and the nonsupport of ‫ܳܤ‬ଵ ଶ is lower than ‫ܳܤ‬ଵ ଵ , since the last three rules were extracted from ‫ܦ‬ଶ. Table 2- Significant Branching (OB) p-values for 0% Noise Association Rules Noise: 0% ‫ܦ‬஻ொభ బ ‫ܦ‬஻ொభ భ Row T. p-value A1T1='(-inf-0.25]' A3T1='(0.75-inf)' 200 ==> class=I-C 200 Support 200 17 217 3.224e-46 No Support 0 61 61 Column Total 200 78 556 A5T1='(-inf-0.25]' A7T1='(0.75-inf)' 200 ==> class=C-I Support 200 31 231 3.730e-25 No Support 0 34 34 Column Total 200 65 530 A10T1='(0.75-inf)' A12T1='(0.75-inf)' 200 ==> class=C-I 200 Support 200 33 233 7.54e-30 No Support 0 43 43 Column Total 200 76 552 A2T1='(-inf-0.25]' A11T1='(-inf-0.25]' 200 ==> class=C-I 200 Support 26 200 226 4.92e-29 No Support 38 0 38 Column Total 64 200 528 A4T1='(0.75-inf)' A9T1='(-inf-0.25]' 200 ==> class=C-I 200 Support 28 200 228 1.30e-29 No Support 40 0 40 Column Total 68 200 536
  • 8. International Journal of Data Mining & Knowledge Management Process (IJDKP) Vol.4, No.4, July 2014 8 A6T1='(-inf-0.25]' A8T1='(0.75-inf)' 200 ==> class=I-C 200 Support 10 200 210 2.74e-37 No Support 40 0 40 Column Total 50 200 500 The p-values are calculated and the results show that, for each rule, the association between the rules and two populations are considered to be extremely statistically significant. Therefore, we can define, ‫ܳܤ‬ଵ, as a significant branching question. That means, the two populations, ‫ܳܤ‬ଵ ଵ and ‫ܳܤ‬ଵ ଶ has different association rules hence; they have to be analyzed separately. Table 3, 4, and 5 show the same experiment with 10%, 20% and 30% noise, respectively. Note that, even if there is 30% noise in the data, the p-values are still considered to be very statistically significant. However, the comparison of the p-values with different noise levels also show that, the p-values become less significant when the noise level increases. Table 3- Significant Branching (OB) p-values for 10% Noise Association Rules Noise: 10% ‫ܦ‬஻ொభ బ ‫ܦ‬஻ொభ భ Row T. p-value A10T1='(0.75-inf)' A12T1='(0.75-inf)' 137 ==> class=C-I 129 Support 129 16 145 3.02e-17 NoSupport 8 33 41 Column Total 137 49 372 A5T1='(-inf-0.25]' A7T1='(0.75-inf)' 146 ==> class=C-I Support 135 24 159 3.94e-14 NoSupport 11 34 45 Column Total 146 58 408 A1T1='(-inf-0.25]' A3T1='(0.75-inf)' 143 ==> class=I-C 129 Support 129 7 136 1.57e-33 NoSupport 14 67 81 Column Total 143 74 434 A4T1='(0.75-inf)' A9T1='(-inf-0.25]' 150 ==> class=C-I 140 Support 26 140 166 2.70e-15 NoSupport 36 10 46 Column Total 62 150 424 A6T1='(-inf-0.25]' A8T1='(0.75-inf)' 147 ==> class=I-C 135 Support 12 135 147 5.12e-23 NoSupport 45 12 57 Column Total 57 147 408 A2T1='(-inf-0.25]' A11T1='(-inf-0.25]' 155 ==> class=C-I 141 Support 18 141 159 NoSupport 35 14 49 Column Total 53 155 416
  • 9. International Journal of Data Mining & Knowledge Management Process (IJDKP) Vol.4, No.4, July 2014 9 Table 4- Significant Branching (OB) p-values for 20% Noise Association Rules Noise: 20% ‫ܦ‬஻ொభ బ ‫ܦ‬஻ொభ భ Row T. p-value A5T1='(-inf-0.25]' 169 ==> class=C-I 126 Support 126 54 180 4.47e-9 No Support 43 78 121 Column Total 169 132 602 A5T1='(-inf-0.25]' A7T1='(0.75-inf)' 173 ==> class=C-I 128 Support 128 59 187 3.80e-9 No Support 45 84 129 Column Total 173 143 632 A5T1='(-inf-0.25]' A7T1='(0.75-inf)' 173 ==> class=C-I 124 Support 124 54 178 4.93e-7 No Support 49 73 122 Column Total 173 127 600 A2T1='(-inf-0.25]' A11T1='(-inf-0.25]' 149 ==> class=C-I 114 Support 46 114 160 3.06e-9 No Support 68 35 103 Column Total 114 149 526 A4T1='(0.75-inf)' A9T1='(-inf-0.25]' 151 ==> class=C-I 115 Support 42 115 157 4.96e-15 No Support 96 36 132 Column Total 138 151 578 A11T1='(-inf-0.25]' 161 ==> class=C-I 122 Support 43 122 165 1.36e-13 No Support 83 39 122 Column Total 126 161 574 Table 5- Significant Branching (OB) p-values for 30% Noise Association Rules Noise:30% ‫ܦ‬஻ொభ బ ‫ܦ‬஻ொభ భ Row T. p-value A12T1='(0.75-inf)' 263 ==> class=C-I 150 Support 150 105 255 0.0018 No Support 113 139 252 Column Total 263 244 1014 A10T1='(0.75-inf)' A12T1='(0.75-inf)' 257 ==> class=C-I 143 Support 143 90 233 7.24e-005 No Support 114 149 263 Column Total 257 239 992 A4T1='(0.75-inf)' 249 ==> class=C-I 145 Support 96 145 241 4.69e-005 No Support 146 104 250 Column Total 242 249 982 A9T1='(-inf-0.25]' 269 ==> class=C-I 152 Support 81 152 233 7.62e-005 No Support 131 117 248 Column Total 212 269 962
  • 10. International Journal of Data Mining & Knowledge Management Process (IJDKP) Vol.4, No.4, July 2014 10 Table 6 shows the contingency table for the second branching question, ‫ܳܤ‬ଶ. As mentioned before, the binary values of the second branching question were assigned randomly, and based on the binary values ‫ܳܤ‬ଶ have, the combined dataset (‫ܦ‬ଵ + ‫ܦ‬ଶ) is separated into ‫ܦ‬஻ொమ బ and ‫ܦ‬஻ொమ భ. Since ‫ܳܤ‬ଶ values are assigned randomly, once separated, ‫ܦ‬஻ொమ బ and ‫ܦ‬஻ொమ భ datasets each may contain subjects from both ‫ܦ‬ଵ and ‫ܦ‬ଶ. Therefore, the rule extraction technique will extract the rules or some attributes within the rules belonging to both ‫ܦ‬ଵ and ‫ܦ‬ଶ for each of the separated data. As a result, the rules will be corrupted and therefore the support of each extracted rule will decrease compared to the significant branching example given before.. Table 6 shows that the association between the rules and the population is considered to be not statistically significant. Table 7 shows the results with 10% noise where the p-values increase. Therefore, ‫ܳܤ‬ଶ is not considered as a significant branching question. Table 6- Bad Branching (BB) p-values for 0% Noise Association Rules Noise: 0% ‫ܦ‬஻ொమ బ ‫ܦ‬஻ொమ భ Row T. p-value A4T1='(0.75-inf)' A9T1='(-inf-0.25]' 136 ==> class=C-I 117 Support 117 111 128 0.7326 No Support 19 21 40 Column T. 136 132 436 A2T1='(-inf-0.25]' A11T1='(-inf-0.25]' 132 ==> class=C-I 112 Support 112 114 226 0.8610 No Support 20 18 38 Column Total 132 132 528 A5T1='(-inf-0.25]' A7T1='(0.75-inf)' 124 ==> class=C-I 107 Support 124 107 231 0.7160 No Support 17 17 34 Column Total 141 124 530 A10T1='(0.75-inf)' A12T1='(0.75-inf)' 123 ==> class=C-I 109 Support 124 109 233 0.0962 No Support 29 14 43 Column Total 153 123 552 Table 7- Bad Branching (BB) p-values for 10% Noise Association Rules Noise: 10% ‫ܦ‬஻ொమ బ ‫ܦ‬஻ொమ భ Row T. p-value A4T1='(0.75-inf)' A9T1='(-inf-0.25]' 152 ==> class=C-I 109 Support 109 109 218 0.3932 No Support 43 54 97 Column Total 152 163 630 A10T1='(0.75-inf)' A12T1='(0.75-inf)' 158 ==> class=C-I 108 Support 108 87 315 0.4590 No Support 50 49 99 Column Total 158 136 708 A4T1='(0.75-inf)' 156 ==> class=C-I 106 Support 106 97 203 0.4721 No Support 50 55 105 Column Total 156 152 616
  • 11. International Journal of Data Mining & Knowledge Management Process (IJDKP) Vol.4, No.4, July 2014 11 A5T1='(-inf-0.25]' A7T1='(0.75-inf)' 159 ==> class=C-I 110 Support 96 110 206 0.3361 No Support 55 49 104 Column Total 151 159 620 A2T1='(-inf-0.25]' A11T1='(-inf-0.25]' 152 ==> class=C-I 102 Support 104 102 206 1.0000 No Support 52 50 102 Column T. 156 152 616 As a result, ‫ܳܤ‬ଵ was defined as a significant stratifying factor that divides the dataset into two populations with different extracted rules, whereas ‫ܳܤ‬ଶ and ‫ܳܤ‬ଷ are not significant factors. Hence, this simulation validates that the Fisher’s Exact Test can be used to determine the significant branching questions. 4.1.1. MESA Results of Stratification The same experiment is then applied on the MESA dataset. The branching questions that are extracted from the MESA data are the following: Table 8- List of Branching Questions Label Branching Questions v32 Are you married, widowed, divorced, separated, or have you never married? v41 Do you sneeze often, sometimes, rarely or never? v53 Do you usually need to use a wheelchair, cane, crutches or walker to help you get around? v59 Do you have any health problems which make it difficult for you to leave your home and go visiting, shopping, or to the doctor’s? v87 Have you ever been told by a doctor that you had high blood pressure? v90 Have you ever been told by a doctor that you had a hernia in the groin or stomach area? v92 Have you ever had a stroke or cerebral brain hemorrhage? v95 Have you ever been told by a doctor that you occasionally have had transient ischemic attacks or poor blood flow to the brain, where you seem to lose track of things that are happening around you for up to a few minutes? v97 Have you ever had problems with any paralysis? v107 Have you ever had a heart attack? v111 Has any doctor ever told you that you have or have had arthritis or rheumatism? v125 Have you had any other disease of the nerves or muscles? v128 Have you ever been told by a doctor that you had cancer of any kind? v133 Have you lost any inches in height as you have gotten older? v135 In the last 12 months how many times have you become so dizzy that you fainted or nearly fainted? v138 Have you broken any bones in the last 12 months? v171 How many pregnancies have you had? v180 Have you ever had female surgery such as on your ovaries, vagina, fallopian tubes, uterus, rectum, or urethra? v193 Are you currently taking any female hormones? v207 Have you ever had any other operations on your bladder, kidneys, or any other organs in your pelvic area or area normally covered by underpants or undershorts? v219 Do you usually need help in getting into the bathroom or on or off of the toilet? v220 Do you use any aids like a grab bar, or special toilet or anything else to help you with using the toilet in your home?
  • 12. International Journal of Data Mining & Knowledge Management Process (IJDKP) Vol.4, No.4, July 2014 12 v224 Do you have your regular schedule that you usually use to get you to the toilet to urinate, for example every hour or so? v415 Have you ever had or have you been told by a doctor that you had any kidney or bladder problems we haven’t talked about already? v418 Do you usually drink any liquids of any kind before you go to bed at night? v422 Did your mother of father have a urine loss condition as an adult? v458 Do you have any health problems that require medical attention that you have not been able to get treated? v496 As you know some people experience memory problems as they get older. How about your memory? Has it become worse within the last five years? v540 Have you ever had to stay in a nursing home overnight or longer because of a health problem you had? v543 Have you ever had to stay in a mental health facility overnight or longer, because of a mental or emotional problem that you had? v725 Do you usually take one or more naps during the day? v737 Have you smoked at least 100 cigarettes in your entire life? v745 Do you drink wine, beer, or liquor? v776 Is this the same occupation that you had for most of your life? The data is stratified based on the branching questions listed above. For many of the branching questions there were not enough subjects for a rule to be generated (ex. not enough female subjects taking female hormones to generate a rule). For those branching questions, a contingency table could not be generated. Table 9 shows the contingency table for the subjects that have undergone female surgery and the ones that have not. The p-values show that the association between the rules and the data is not considered to be statistically significant. Therefore, female surgery cannot be considered as a significant branching question. Table 9-Contingecy Table of Female Surgery Female Surgery- Association Rules ‫ܦ‬ிௌ ‫ܦ‬ேிௌ Row T. p-value v124='(-inf-0.5]' v152='(-inf-0.5]' v178='(- inf-0.5]' v195='(-inf-0.5]' v230='(-inf-0.5]' v231='(-inf-0.5]' 78 ==> class=C-C 49 conf:(0.63) Support 49 38 87 0.4988 No Support 29 29 58 Column T. 78 67 145 v120='All' v124='(-inf-0.5]' v152='(-inf-0.5]' v178='(-inf-0.5]' v195='(-inf-0.5]' v230='(- inf-0.5]' v231='(-inf-0.5]' 78 ==> class=C-C 49 conf:(0.63) Support 49 38 87 0.4988 No Support 29 29 58 Column T. 78 67 145 v121='All' v124='(-inf-0.5]' v152='(-inf-0.5]' v178='(-inf-0.5]' v195='(-inf-0.5]' v230='(- inf-0.5]' v231='(-inf-0.5]' 78 ==> class=C-C 49 conf:(0.63) Support 49 38 87 0.4988 No Support 29 29 58 Column T. 78 67 145 v107='(-inf-0.5]' v125='(-inf-0.5]' v199='(- inf-0.5]' v432='(-inf-0.5]' 67 ==> class=C-I 43 conf:(0.64) Support 32 43 75 0.1135 No Support 33 24 57 Column T. 65 67 132 v78='(-inf-0.5]' v107='(-inf-0.5]' v125='(-inf- Support 30 43 73 0.0782
  • 13. International Journal of Data Mining & Knowledge Management Process (IJDKP) Vol.4, No.4, July 2014 13 0.5]' v199='(-inf-0.5]' v432='(-inf-0.5]' 67 ==> class=C-I 43 conf:(0.64) No Support 32 24 56 Column T. 62 67 129 v107='(-inf-0.5]' v120='All' v125='(-inf-0.5]' v199='(-inf-0.5]' v432='(-inf-0.5]' 67 ==> class=C-I 43 conf:(0.64) Support 32 43 75 0.1135 No Support 33 24 57 Column T. 65 67 132 Table 10 shows the contingency table for the smokers and non-smokers. Here, the association between the rules and the data is considered to be statistically significant for the rules whose p- values are underlined in the table. Therefore, smoking is considered to be a significant branching question. Similarly, sneezing and taking naps during the day are significant branching questions in MESA data. Table 10 – Contingency Table of Smoking Smoke- Association Rules ‫ܦ‬ௌ ‫ܦ‬ேௌ Row T. p-value v69='(-inf-0.5]' v80='(-inf-0.5]' v124='(-inf- 0.5]' v152='(-inf-0.5]' v230='(-inf-0.5]' 50 ==> class=C-C 37 conf:(0.74) Support 37 41 78 0.0064 No Support 13 42 55 Column T. 50 83 133 v69='(-inf-0.5]' v78='(-inf-0.5]' v80='(-inf- 0.5]' v124='(-inf-0.5]' v152='(-inf-0.5]' v230='(-inf-0.5]' 50 ==> class=C-C 37 conf:(0.74) Support 37 41 78 0.0064 No Support 13 42 55 Column T. 50 83 133 v69='(-inf-0.5]' v79='(-inf-0.5]' v80='(-inf- 0.5]' v124='(-inf-0.5]' v152='(-inf-0.5]' v230='(-inf-0.5]' 50 ==> class=C-C 37 conf:(0.74) Support 37 41 78 0.0064 No Support 13 42 55 Column T. 50 83 133 v78='(-inf-0.5]' v107='(-inf-0.5]' v138='(- inf-0.5]' v432='(-inf-0.5]' 98 ==> class=C-I 58 conf:(0.59) Support 24 58 82 0.1241 No Support 29 40 69 Column T. 53 98 151 v28='(-inf-0.5]' v78='(-inf-0.5]' v79='(-inf- 0.5]' v138='(-inf-0.5]' v432='(-inf-0.5]' 98 ==> class=C-I 58 conf:(0.59) Support 24 58 82 0.0461No Support 34 40 74 Column T. 58 98 156 v78='(-inf-0.5]' v107='(-inf-0.5]' v120='All' v138='(-inf-0.5]' v432='(-inf- 0.5]' 98 ==> class=C-I 58 conf:(0.59) Support 24 58 82 0.1241 No Support 29 40 69 Column T. 53 98 151 4.3. Analysis of the Stratums The extracted rules of the significant branching questions can be used for prediction. For example when a new patient comes into the clinic who meets the following rule v69='(-inf-0.5]' v80='(-inf- 0.5]' v124='(-inf-0.5]' v152='(-inf-0.5]' v230='(-inf-0.5]' 50 ==> class=C-C 37 conf:(0.74) , it can be concluded that, the patient will remain continent with 74% of probability.
  • 14. International Journal of Data Mining & Knowledge Management Process (IJDKP) Vol.4, No.4, July 2014 14 Next, the risk factors of different stratums (smokers/non-smokers for our case) need to be determined separately. Relieff attribute selection is used to determine the important attributes of each population, since our previous studies have shown that Relieff outperformed other attribute selection techniques on the analysis of MESA dataset. (Arslanturk et al.). The extracted attributes are defined as the risk factors. Table 11 shows the risk factors for smokers and non-smokers. Table 11- Risk Factors of Stratums RISKFACTORS SMOKERS NON-SMOKERS v211- Getting yourself wet v68- Being proud of yourself v128- Having Cancer v128- Having Cancer v229- Difficulties going to the bathroom on time v719- Having an active hobby v89- Diabetes v180- Undergone Female Surgery v69- Feeling lonely? v74- Things are going your way? 5. CONCLUSION AND FUTURE WORK The current study models the UI condition on the baseline using stratification based on branching questions. The questionnaire itself may instruct a respondent to skip some not applicable questions (skip patterns) based on the answer to a branching question. Using branching questions to stratify data makes sense as we utilize the wisdom of experts embedded in the data through questionnaire design processes for stratification of data by taking advantage of skip patterns’. The significance of a branching question is determined by the calculated p-values of the Fisher’s Exact Test. A branching question is referred as significant, when each stratum returns different rules/risk factors when population is stratified or some risk factors/rules is missed when population is not stratified. There may be buckets of questions not being answered by some subjects even though they are not constructed as skip patterns. The preceding question of those buckets can be treated as a branching question even though it is a non branching question. The next step of the analysis is to also stratify the population based on those non-branching questions to determine how the risk factors may vary across sub populations. ACKNOWLEDGMENT This work was supported in part by NIH Grant R01AG038673
  • 15. International Journal of Data Mining & Knowledge Management Process (IJDKP) Vol.4, No.4, July 2014 15 REFERENCES [1] A.C. Diokno, B.M. Brock, M.B. Brown, et. al., “Prevalence of urinary incontinence and other urological symptoms in the noninstutionalized elderly,” J Urol 1986; 136:1022. [2] A.C. Diokno, C.M. Sampselle, A.R. Herzog, et. al., “Prevention of urinary incontinence by behavioral modification program: a randomized, controlled trial among older women in the community,” J Urol 2004; 171: 1165. [3] A.C. Diokno, M.B. Brown, B.M. Brock, et. al., “Clinical and cystometric characteristics of continent and incontinent noninstitutionalized elderly,” J Urol 1988; 140: 567. [4] B.Azhagusundari, A.S. Thanamani, “Feature Selection based on Information Gain” International Journal of Innovative Technology and Exploring Engineering (IJITEE), ISSN: 2278-3075, Volume-2, Issue-2, January 2013. [5] J.Fagan, B. V. Greenberg, “Using Graph Theory to Analyze Skip Patterns in Questionnaires,” Bureau of the Census, Statistical Research Division Report Series, SRD Research Report Number: Census/SRD/RR-88/06, 1988. [6] Lindsey R. Haas, MPH; Paul Y. Takahashi, MD; Nilay D. Shah, PhD; Robert J. Stroebel, MD; Matthew E. Bernard, MD; Dawn M. Finnie, MPA; and James M. Naessens, ScD, “Risk-Stratification Methods for Identifying Patients for Care Coordination”, Am J Manag Care 2013;19(9):725-732 [7] M. A. Hall. “Correlation-based Feature Subset Selection for Machine Learning,” Hamilton, New Zealand, 1998 [8] S. Arslanturk, M. R. Siadat, T. Ogunyemi, I. Sethi, A.Diokno. “Comparison of Attribute Selection Techniques Using Fully Controlled Simulation Based Datasets”, 2nd International Conference on Information Management and Evaluation 2011, Toronto, Canada [9] S. Arslanturk, M-R. Siadat, T. Ogunyemi, K. Demirovic, A. Diokno, “Skip Pattern Analysis for Detection of Undetermined and Inconsistent Data”, 2012 5th International Conference on BioMedical Engineering and Informatics (BMEI 2012) [10] W. W. Cohen: “Fast Effective Rule Induction. In: Twelfth International Conference on Machine Learning,” 115-123, 1995. [11] X. Su, C-L. Tsai, H. Wang, D. M. Nickerson, B. Li, “Subgroup Analysis via Recursive Partitioning”, Journal of Machine Learning Research 10 (2009)141-158.