![Underground Water Prospecting In Rural Settings
124
||Issn||2250-3005|| (Online) ||March||2013|| ||www.ijceronline.com||
To measure resistivity of subsurface formation, four electrodes are required. A current [I] is introduced between
one pair of electrodes called current electrodes. The current electrodes can be identified as A and B or +I and –I
to denote source and sink.The potential difference measured as a result of current flow is measured with another
pair of electrodes called potential electrodes. These potential electrodes may be represented as M and N, and V
will represent the resultant potential difference.
Resistivity = K (
𝑉
𝐼
) where K is a geometrical constant
K = ([AB]/2) -([MN]/2)2
.
𝜋
2
[MN]/2
Where AB = distance between current electrodes
MN = distance between potential electrodes
The changes in the resistivity of geological strata may be measured by a method known as vertical electrical
sounding. In the field, a series of resistivity measurements are made at various electrode spacing entered at a
common point. Sampling depth is increased by increasing electrode spacing.The M and N electrode array is
held fixed while the A and B current electrodes are moved outwardly by constant length. This movement is
relative to the increase in depth of measurement as the current electrodes are moved further apart. The depth
measured is AB/2. When the current electrodes are moved further apart, the potential recorded from the M and
N electrodes will change as the current passes through different subsurface structures.The relationship V = IR
(Ohm’s law) holds for simple circuits as well as earth materials. However, resistance is not a material constant;
instead, resistivity is an intrinsic property of the medium describing the resistance of the flow of current in that
medium. In general resistivity is defined as a unit change in resistance scaled by the ratio of a unit cross –
sectional area and a unit length of the material through which the current is passing.Earth’s resistivity can range
over nine orders of magnitude from 1 to 108
ohm/m. Table 1 shows the common resistivity of different ground
earth types.
Table.1
Material value Resistivity range Typical
Igneous and Metamorphic rocks 102
– 108
104
Sedimentary 10 – 108
103
Ground Water 1 – 10 5
Pure water 103
Common soilresistivity
3. Soilresistivity Processing Circuit
The computation of the resistivity and the subsequent water table results are performed in the
microcontroller type PIC 16F877A. The choice of this particular type has been motivated by the fact that it is
readily available and reasonably priced. This microcontroller is relatively simply to program; its instructions set
has only 35 mnemonics yet performing very powerful operations.
3.1. Measuring resistivity at a depth of 20 meters.
The PIC 16F877A is used to perform the following computations under the control of the program
code.The current electrode spacing in this case is 40 meters and the voltage electrode spacing is set at 4 meters,
so that:
AB = 40 m
MN = 4m
Plugging these figures into the previously mentioned formula we get:
Resistivity = (40/2)2
– (4/2)2
.
𝜋
2
.𝑉/𝐼
(4/2)
= 202
– 4 .
𝜋
2
V/I
2
= 198
𝜋
2
.V/I
Taking π to be 22/7 we have 310V/I.](data:image/gif;base64,R0lGODlhAQABAIAAAAAAAP///yH5BAEAAAAALAAAAAABAAEAAAIBRAA7)
Recomendados
Recomendados
Mais conteúdo relacionado
Mais procurados
Mais procurados (19)
Semelhante a V03301230132
Semelhante a V03301230132 (20)
Último
Último (20)
V03301230132
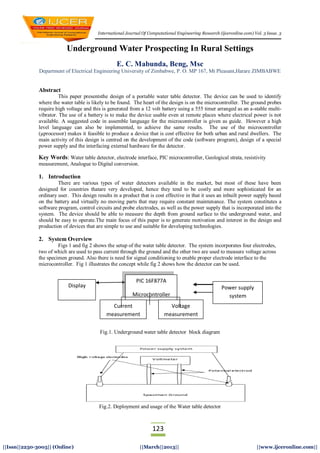
- 1. International Journal Of Computational Engineering Research (ijceronline.com) Vol. 3 Issue. 3 123 ||Issn||2250-3005|| (Online) ||March||2013|| ||www.ijceronline.com|| Underground Water Prospecting In Rural Settings E. C. Mabunda, Beng, Msc Department of Electrical Engineering University of Zimbabwe, P. O. MP 167, Mt Pleasant,Harare ZIMBABWE Abstract This paper presentsthe design of a portable water table detector. The device can be used to identify where the water table is likely to be found. The heart of the design is on the microcontroller. The ground probes require high voltage and this is generated from a 12 volt battery using a 555 timer arranged as an a-stable multi- vibrator. The use of a battery is to make the device usable even at remote places where electrical power is not available. A suggested code in assemble language for the microcontroller is given as guide. However a high level language can also be implemented, to achieve the same results. The use of the microcontroller (µprocessor) makes it feasible to produce a device that is cost effective for both urban and rural dwellers. The main activity of this design is centred on the development of the code (software program), design of a special power supply and the interfacing external hardware for the detector. Key Words: Water table detector, electrode interface, PIC microcontroller, Geological strata, resistivity measurement, Analogue to Digital conversion. 1. Introduction There are various types of water detectors available in the market, but most of these have been designed for countries thatare very developed, hence they tend to be costly and more sophisticated for an ordinary user. This design results in a product that is cost effective in that it uses an inbuilt power supply based on the battery and virtually no moving parts that may require constant maintenance. The system constitutes a software program, control circuits and probe electrodes, as well as the power supply that is incorporated into the system. The device should be able to measure the depth from ground surface to the underground water, and should be easy to operate.The main focus of this paper is to generate motivation and interest in the design and production of devices that are simple to use and suitable for developing technologies. 2. System Overview Figs 1 and fig 2 shows the setup of the water table detector. The system incorporates four electrodes, two of which are used to pass current through the ground and the other two are used to measure voltage across the specimen ground. Also there is need for signal conditioning to enable proper electrode interface to the microcontroller. Fig 1 illustrates the concept while fig 2 shows how the detector can be used. Fig.1. Underground water table detector block diagram Fig.2. Deployment and usage of the Water table detector Display PIC 16F877A Microcontroller Current measurement Voltage measurement Power supply system
- 2. Underground Water Prospecting In Rural Settings 124 ||Issn||2250-3005|| (Online) ||March||2013|| ||www.ijceronline.com|| To measure resistivity of subsurface formation, four electrodes are required. A current [I] is introduced between one pair of electrodes called current electrodes. The current electrodes can be identified as A and B or +I and –I to denote source and sink.The potential difference measured as a result of current flow is measured with another pair of electrodes called potential electrodes. These potential electrodes may be represented as M and N, and V will represent the resultant potential difference. Resistivity = K ( 𝑉 𝐼 ) where K is a geometrical constant K = ([AB]/2) -([MN]/2)2 . 𝜋 2 [MN]/2 Where AB = distance between current electrodes MN = distance between potential electrodes The changes in the resistivity of geological strata may be measured by a method known as vertical electrical sounding. In the field, a series of resistivity measurements are made at various electrode spacing entered at a common point. Sampling depth is increased by increasing electrode spacing.The M and N electrode array is held fixed while the A and B current electrodes are moved outwardly by constant length. This movement is relative to the increase in depth of measurement as the current electrodes are moved further apart. The depth measured is AB/2. When the current electrodes are moved further apart, the potential recorded from the M and N electrodes will change as the current passes through different subsurface structures.The relationship V = IR (Ohm’s law) holds for simple circuits as well as earth materials. However, resistance is not a material constant; instead, resistivity is an intrinsic property of the medium describing the resistance of the flow of current in that medium. In general resistivity is defined as a unit change in resistance scaled by the ratio of a unit cross – sectional area and a unit length of the material through which the current is passing.Earth’s resistivity can range over nine orders of magnitude from 1 to 108 ohm/m. Table 1 shows the common resistivity of different ground earth types. Table.1 Material value Resistivity range Typical Igneous and Metamorphic rocks 102 – 108 104 Sedimentary 10 – 108 103 Ground Water 1 – 10 5 Pure water 103 Common soilresistivity 3. Soilresistivity Processing Circuit The computation of the resistivity and the subsequent water table results are performed in the microcontroller type PIC 16F877A. The choice of this particular type has been motivated by the fact that it is readily available and reasonably priced. This microcontroller is relatively simply to program; its instructions set has only 35 mnemonics yet performing very powerful operations. 3.1. Measuring resistivity at a depth of 20 meters. The PIC 16F877A is used to perform the following computations under the control of the program code.The current electrode spacing in this case is 40 meters and the voltage electrode spacing is set at 4 meters, so that: AB = 40 m MN = 4m Plugging these figures into the previously mentioned formula we get: Resistivity = (40/2)2 – (4/2)2 . 𝜋 2 .𝑉/𝐼 (4/2) = 202 – 4 . 𝜋 2 V/I 2 = 198 𝜋 2 .V/I Taking π to be 22/7 we have 310V/I.
- 3. Underground Water Prospecting In Rural Settings 125 ||Issn||2250-3005|| (Online) ||March||2013|| ||www.ijceronline.com|| The condition for presence of the water table is that the value of the resistivity should lie in the range of 1 to 10 ohms per meter. Therefore the PIC is programmed to compute the following inequality and display a positive or negative result. 1Ω/m < 310V/I < 10Ω/m = I < 310V < 10I The denary number 310 when converted to binary is found to exceed 8 bits in size but the PIC microcontroller registershave got a maximum capacity of 8 bit numbers only. One way to alleviate this is to scale down by 2 so that the inequality becomes: 𝐼 2 < 155V < 5I To obtain 𝐼 2 at the input of the system two resistors in parallel are used as shown in fig 3. This procedure will make the new inequality to be I’ < 155V < 10I’ where I’ is 𝐼 2 3.2. Measuring resistivity at a depth of 40meters The procedure for measuring resistivity at the depth of 40 meters is the same as for 20 save for the current electrode spacing which is now 80m but the voltage electrode spacing remains at 4m. In this case AB = 80m.Resistivity becomes 1254V/I and the condition for presence of water remains the same i.e. between 1 and 10 Ω/m. The resulting inequality 1Ω/m < 1254V/I < 10Ω need to be scaled down to fit into the original range of I’ < 155V < 10I’ by switching in resistances at the input. Fig. 3 show the implementation circuit diagram of the detector. Fig.3.Circuit to measure resistivity The instrumentation amplifier number 1 samples the value of voltage across the 1.2 kΩ resistors. This gives a value of voltage that is directly proportional to the current passing through the resistor which is also half the current passing through the circuit. The current I/2 is the one used for computing the resistivity by the microcontroller. Instrumentation amplifier 2 measures the underground voltage value. The two values, current passing through the circuit and the voltage across the underground are used to calculate resistivity of the underground structure. Since the groundwater resistivity as shown in table 1 is in the rage of 1 to 10 ohms/m a positive result would be found out if the resistivity of the underground structure lies in this range.Microcontroller receives input voltage and current from which it calculates the resistivity and compares it with known range and gives an output signal to show the presence or absence of the water table. When the device is turned ON, one LED will light at any given moment. As long as the depth of measurement does not contain the water table it means that the red LED will be lighting. The lighting of these LEDs is done in software by the PIC microcontroller.
- 4. Underground Water Prospecting In Rural Settings 126 ||Issn||2250-3005|| (Online) ||March||2013|| ||www.ijceronline.com|| Fig 4 shows the detailed pin out diagram of the 16F877A microcontroller. The microcontroller makes use of an external clock which, for the purposes of this design uses a 4 MHz crystal oscillator connected to pins 9 and 10. Each instruction cycle takes 1µs to be executed. Fig.4. PIC 16F877A microcontroller pin out diagram 3.3 Analogue to Digital conversion The PIC microcontroller is capable of converting an analogue signal to a digital one. It performs this for one signal at a time. Before the analogue to digital conversion is done there are registers that need to be initialized. These are ADCON0 and ADCON1registers. 3.4 ADCON0 register The pins for ADCON0 are configured as shown below. This register controls the operation of the analogue to digital module. Bit 7-6 ADCS1:ADCS0: A/D conversions Clock select bits 00 = FOSC/2 01 = FOSC/8 10 = FOSC/32 11 = FRC (Clock derived from internal A/D module) Bit 5-3 CHS2:CHS0: Analogue Select bits 000 = channel 0 (RA0/AN0 001 = channel 1 (RA1/AN1) 010 = channel 2 (RA2/AN2) 011 = channel 3 (RA3/AN3) 100 = channel 4 (RA4/AN4) 101 = channel 5 (RA5/AN5) 110 = channel 6 (RA6/AN6) 111 = channel 7 (RA7/AN7) Bit 2 GO/DONE: A/D Conversion status bit If ADON = 1 1 = A/D Conversion in progress (setting the bit starts the A/D conversion) 0 = A/D Conversion not in progress (this bit is automatically cleared by hardware when A/D conversion is complete. Bit 1 Unimplemented: read as 0 Bit 0 ADON: A/D on bit 1 = A/D converter module is operating 0 = A/D converter module is shut off and consume no operating current. R/W-0 R/W-0 R/W-0 R/W-0 R/W-0 R/W-0 U/O R/W-0 ADC1 ADCS0 CHS2 CHS1 CHS0 GO/DONE --------- ADON
- 5. Underground Water Prospecting In Rural Settings 127 ||Issn||2250-3005|| (Online) ||March||2013|| ||www.ijceronline.com|| 3.5 ADCON1 Register This register initializes the control for analogue to digital conversion. The pins for ADCON1 register are configured as shown in the diagram below. The most significant bit selects the analogue to digital conversion format for reading the result. The next four bits are for Port configuration. Bit 7 ADFM: A/D Result Format Select bit 1 = Right justified. Six (6) most significant bits of ADRESH are read as ‘0’ 0 = Left justified six (6) least significant bits of ADRESL are read as ‘0’ Bit 6 ADCS2: A/D Conversion clock select bit The steps followed when doing the analogue to digital conversion are as follows: Configure the A/D module - Configure pins / voltage reference and digital input output (ADCON1) - Select A/D input channel (ADCON0) - Select A/D conversion clock (ADCON0) - Turn on A/D module (ADCON0) Configure the A/D interrupt if desired Wait the required acquisition time Start the conversion by setting the GO/DONE bit Wait for the A/D conversion to complete by either polling the GO/DONE (low) bit or with interrupt enable you wait for the A/D interrupt. Read A/D result register pair (ADRESH: ADRESL). The next page show shows the flow chart of the processes the microcontroller go through to achieve the measurement of the resistivity at 20m depth. R/W-0 R/W-0 U/O U/O R/W-0 R/W-0 R/W-0 R/W-0 ADFM ADCS2 -------- -------- PCFG3 PCGF2 PCGF1 PCFG0
- 6. Underground Water Prospecting In Rural Settings 128 ||Issn||2250-3005|| (Online) ||March||2013|| ||www.ijceronline.com|| Fig 5 Flow chart for measuring the resistivity at 20m depth START Is this value greater than I Is this value greater than V added to itself 155 times Convert the input values of voltage and current from analogue to digital Add value of voltage to itself 155 times Compare this value with the value of current I yes no Add the value of I to itself 10 times Compare this value with the value of V added to itself 155 times yes no Light the green LED Light the red LED END START Is this value < I
- 7. Underground Water Prospecting In Rural Settings 129 ||Issn||2250-3005|| (Online) ||March||2013|| ||www.ijceronline.com|| 4. Codefor20 M Depth Resistivity The listing below (listing 1) is the suggested code that controls the operation of microcontroller in the calculation of the resistivity hence the depth of the underground water table. Listing 1 Org 0x00 RP0 equ 5 RP1 equ 6 Vic 1 equ 20h Vic 2 equ 21h Vic 3 equ 22h DEC equ 23h DEC1 equ 24h ANS1 equ 25h ANS2 equ 26h Vic4 equ 27h Vic 5 equ 28h Vic6 equ 29h Init equ 2Ah C equ 2Bh RLED equ 2Bh DEC2 equ 2Ch GLED equ 2Dh Cham equ 2Eh STATUS equ 03h INTCON equ 8Bh ADCONO equ 1Fh ADCON1 equ 9Fh PORTA equ 05h PORTB equ 06h ADRESL equ 9Eh PIR1 equ 0Ch Org 0x00 Goto Main BCF STATUS,RPO MOVLW 0x80 ; all analogue input code MOVWF ADCON1 MOVLW 0x3F MOVWF PORTA BCF STATUS,RPO ; reset to bank 0 CLRF PORTB Volrcon CALL SelAN0 CALL AtoD CALL Volt Return Currcon CALL SelAN1 CALL AtoD CALL Curr return SelAN0 MOVLW b’01000001’ MOVWF ADCON0 Return
- 8. Underground Water Prospecting In Rural Settings 130 ||Issn||2250-3005|| (Online) ||March||2013|| ||www.ijceronline.com|| AtoD BSF ADCON0, 3 Z BTFSS PIR1, 6 goto Z return Volt MOVF ADRESL, W MOVWF vic1 MOVWF vic2 SelAN1 MOVLW b’01001001’ MOVWF ADCON0 return Curr MOVF ASRESL, W MOVWF vic4 MOVWF vic5 MOVWF vic6 return Cham Banksel ADCON1 CLRF ADCON1 MOVLW b’01000001’ Banksel ADCON0 BCF INTCON, 7 return main CALL Cham CALL Voltcon CALL Currcon MOVLW 0xFF MOVWF DEC MOVFW vic1 x ADDWF vic2, 0 DECFSZ DEC GOTO x MOVWF vic3 MOVLW b’00111000’ MOVWF DEC1 MOVFW vic3 y ADDWF vic2,0 DECFSZ DEC1 GOTO y MOVWF ANS1 MOVFW vic4 SUBWFANS1,1 ;ANS1-vic4 BTFSC STATUS,C GOT RLED MOVLW b’00001010’ MOVWF DEC2 MOVFW vic5 A ADDWF vic6,0
- 9. Underground Water Prospecting In Rural Settings 131 ||Issn||2250-3005|| (Online) ||March||2013|| ||www.ijceronline.com|| DECFSZ DEC2 GOTO A MOVWF ANS2 SUBWFANS1,0 BTFSC STATUS,C GOTO GLED GOTO RLED END 5. High Voltage Power Supply In order to make the device truly portable the necessary 220 volt supply must be generated from the 12volt battery. The power supply schematic is shown in fig. 6. To keep the cost of the device low readily available components that are not highly specialized have been chosen. The NE555 timer has been used to generate a high frequency that derives Q1 and Q2 which in turn derives the transformer Tr1. The output voltage is then available across terminals 3and4 of Tr. 1. 4 8 Tr1 1k 3 Q12N2907 10K 10k 2 220V 6 12vbat C1 1nF Q2 1 MPS6521 Fig.6 High voltage power supply With the timing components given the NE 555 timer generates a square wave at a frequency, 68 kHz. The output pin 3 of the timer is fed onto the transistors. A high output which is 2/3 of the supply voltage causes transistor Q2 to conduct while transistor Q1 is not conducting. This is because Q2 is active high transistor. A low at the base of Q1 ensures conduction of this transistor.The 68 kHz value was chosen to minimize the size of the transformer as well as conserving power consumption from the battery making the device truly portable. 6. Conclusion The design of a water table detector as shown here provides for an alternative way of constructing and production of a cheap and effective underground water table detector that is affordable, portable and can be useful in rural settings. This has been achieved by use of compact components such as the microcontroller, the NE555 timer and a high efficient transformer. The design is centred on three major components i.e. the PIC microcontroller, NE 555 and the program code. Further refinements in terms of packaging can make this device truly portable. The design objective is to provide for a simple and portable underground water detector that can be used by less sophisticated persons and this paper has successfully presented a possible solution to this end. Improvements to this device could be in making high voltage power supply that is more robust, by use of specialized components. However in so doing care must be exercised to avoid over pricing of the end device. References [1] 2D and 3D Subsurface Resistivity Imaging using a constrained Least – Squares Algorithm April 14/17/1999, by UniversitatPolitecnica de Catalunya. [2] Corrosion-doctors.org http://corrosion-doctors.org/Corrosion-Kinetics/Ohmic-drop-soil.htmaccessed 12/07/10 [3] Ground Resistance Testers: http://www.aemc.com/technfo/appnotes/Ground_Resistance_Testers/App- Ground-SoilResistivity.pdf 12/07/10 [4] Wileywater.com: http;//www.wileywater.com/Controbutors/Sample_2.htm NE555 3 4
- 10. Underground Water Prospecting In Rural Settings 132 ||Issn||2250-3005|| (Online) ||March||2013|| ||www.ijceronline.com|| [5] Ground Water: Volume 14 issue 1 page 6 – 10 published online 6 July 2006 [6] Groundwater NMR in conductive water: Geophysics Vol. 61 no. 4 July – August 1996. [7] Groundwater NMR: Geophysics Vol. 62 No 1 January – February 1997 [8] Geophysical Research letters Vol. 18 No. 6 pages 1127 – 1130 June 1991 [9] Ground Measuring Techniques: by Elvis R Sverko February 11, 1999, http://www.electro- specialities.com/techhnical/downloads/Grol accessed 16/07/10 [10] Soil resistance Measurement: http://www.eijkelkamp.com/Portals/2/Eijkelkamp/Presentatior accessed 16/07/10 Accessed 10/07/10 [11] Application of surface Geophysics to Ground-water investigations by A. A. R Zohdy, G. P. Eaton ans D.R. Mobey Book 2 published by Science for a changing world.