iHT² Health IT Summit San Francisco “Connecting the Data: Improving Outcomes and Quality with Clinical and Claims Data”

iHT² Health IT Summit San Francisco “Connecting the Data: Improving Outcomes and Quality with Clinical and Claims Data” There is a fundamental need in today’s healthcare system for the two largest constituents—payers and providers—to work together in alignment. Changing the thinking and actions to shift the dynamic of how payors and providers work and interact with each other is no small task. This session will address the challenges and opportunities for payors and providers to work together. Panelists will discuss examples of collaboration and lessons learned. Learning Objectives: ∙ Assess the structure of provider-payor collaborations reducing cost and improving outcomes ∙ Identify methods to combine clinical and claims data to glean insight ∙ Define clinical, economic and administrative opportunities for alignment Moderator: Jay Srini, Chief Strategist, SCS Ventures, Adjunct Faculty Assistant Professor, University of Pittsburgh, Senior Fellow and Innovation Chair, iHT² Advisory Board Member Betsy Thompson, MD, DrPH, Chief Medical Officer, Region IX, Centers for Medicare and Medicaid Services Brett Johnson, Associate Director, Medical and Regulatory Policy, California Medical Association (CMA)

Recomendados
Mais conteúdo relacionado
Mais procurados
Mais procurados (20)
Destaque
Destaque (10)
Semelhante a iHT² Health IT Summit San Francisco “Connecting the Data: Improving Outcomes and Quality with Clinical and Claims Data”
Semelhante a iHT² Health IT Summit San Francisco “Connecting the Data: Improving Outcomes and Quality with Clinical and Claims Data” (20)
Mais de Health IT Conference – iHT2
Mais de Health IT Conference – iHT2 (20)
Último
Último (20)
iHT² Health IT Summit San Francisco “Connecting the Data: Improving Outcomes and Quality with Clinical and Claims Data”
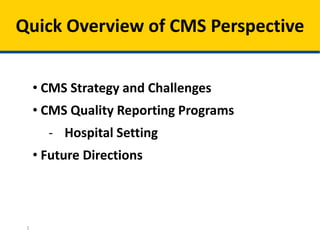
- 1. Quick Overview of CMS Perspective 1 • CMS Strategy and Challenges • CMS Quality Reporting Programs - Hospital Setting • Future Directions
- 3. CMS Quality Reporting and Performance Programs Hospital Quality •Medicare and Medicaid EHR Incentive Program •PPS-Exempt Cancer Hospitals •Inpatient Psychiatric Facilities •Inpatient Quality Reporting •HAC payment reduction program •Readmission reduction program •Outpatient Quality Reporting •Ambulatory Surgical Centers Physician Quality Reporting •Medicare and Medicaid EHR Incentive Program •PQRS •eRx quality reporting PAC and Other Setting Quality Reporting •Inpatient Rehabilitation Facility •Nursing Home Compare Measures •LTCH Quality Reporting •ESRD QIP •Hospice Quality Reporting •Home Health Quality Reporting Payment Model Reporting •Medicare Shared Savings Program •Hospital Value-based Purchasing •Physician Feedback/Value-based Modifier “Population” Quality Reporting •Medicaid Adult Quality Reporting •CHIPRA Quality Reporting •Health Insurance Exchange Quality Reporting •Medicare Part C •Medicare Part D 3
- 4. Hospital Acquired Conditions and the Affordable Care Act • Public reporting of HAC rates in Hospital Compare by 2015 • Adjustment to payments for HAC, FY 2015 – 1% decrease for high rates (risk adjusted) – top quartile compared to national average – finalized criteria for ranking 4
- 5. 5 13 Clinical Process of Care Measures 8 Patient Experience of Care Dimensions 1. AMI-7a Fibrinolytic Therapy Received within 30 Minutes of Hospital Arrival 2. AMI-8 Primary PCI Received within 90 Minutes of Hospital Arrival 3. HF-1 Discharge Instructions 4. PN-3b Blood Cultures Performed in the ED Prior to Initial Antibiotic Received in Hospital 5. PN-6 Initial Antibiotic Selection for CAP in Immunocompetent Patient 6. SCIP-Inf-1 Prophylactic Antibiotic Received within One Hour Prior to Surgical Incision 7. SCIP-Inf-2 Prophylactic Antibiotic Selection for Surgical Patients 8. SCIP-Inf-3 Prophylactic Antibiotics Discontinued within 24 Hours After Surgery 9. SCIP-Inf-4 Cardiac Surgery Patients with Controlled 6 a.m. Postoperative Serum Glucose 10. SCIP–Inf–9 Postoperative Urinary Catheter Removal on Postoperative Day 1 or 2. 11. SCIP-Card-2 Surgery Patients on a Beta Blocker Prior to Arrival That Received a Beta Blocker During the Perioperative Period 12. SCIP-VTE-1 Surgery Patients with Recommended Venous Thromboembolism Prophylaxis Ordered 13. SCIP-VTE-2 Surgery Patients Who Received Appropriate Venous Thromboembolism Prophylaxis within 24 Hours 3 Mortality Measures 1. MORT-30-AMI Acute Myocardial Infarction (AMI) 30-day mortality rate 2. MORT-30-HF Heart Failure (HF) 30-day mortality rate 3. MORT-30-PN Pneumonia (PN) 30-day mortality rate Represents a new measure for the FY 2014 Program not in the FY 2013 Program. Domain Weights 1. Nurse Communication 2. Doctor Communication 3. Hospital Staff Responsiveness 4. Pain Management 5. Medicine Communication 6. Hospital Cleanliness and Quietness 7. Discharge Information 8. Overall Hospital Rating
- 6. Hospital Readmissions Reduction Program • FY 2014, Based on readmissions for AMI, HF and Pneumonia – Algorithm introduced to account for planned readmissions • In FY2015, adding 3 conditions – Acute exacerbation of chronic obstructive pulmonary disease – Elective total hip arthroplasty – Total knee arthroplasty • Applies to hospital’s base DRG payments for Medicare discharges starting October 1, 2012 – FY 2014 no more than 2% reduction – FY 2015 no more than 3% reduction – Calculation methodology finalized in rule-making 6
- 7. partnershipforpatients.cms.gov 40% G O A L S : 20% Reduction in Preventable Hospital- Acquired Conditions 1.8 Million Fewer Injuries | 60,000 Lives Saved Reduction in 30-Day Readmissions 1.6 Million Patients Recover without Readmission $35 Billion Dollars Saved Status: • Over 3700 hospitals have signed the pledge • Hospital readmission rates down from 18.9% to 17.7% in first year (unpublished data)
- 8. Results Being Seen Nationally • Cost trends are down • Outcomes are improving • Adverse events are falling
- 9. Medicare Per Capita Spending Growth at Historic Lows Source: CMS Office of the Actuary 9.24% 5.99% 4.63% 7.64% 7.16% *27.59% 1.98% 4.91% 4.15% 1.36% 2.25% 1.13% 0.35% 0% 1% 2% 3% 4% 5% 6% 7% 8% 9% 10% 11% 12% 2001 2002 2003 2004 2005 2006 2007 2008 2009 2010 2011 2012 2013 Medicare Per Capita Growth Medical CPI Growth *Medicare Part D prescription drug benefit implementation, Jan 2006
- 10. Medicare FFS 30-Day All-Cause Readmission Rate, January 2010-May 2013 (all hospitals)
- 11. Reducing Early Elective Deliveries Nationally Improvement from Baseline Source: August 2013 HEN Submissions. Baseline and Current time periods vary by HEN.
- 12. 0 0.5 1 1.5 2 2.5 41 % Reduction 1.133 CLABSIsper1,000centrallinedays Quarters of participation by hospital cohorts, 2009–2012 Over 1,000 ICUs achieved an average 41% decline in CLABSI over 6 quarters (18 months), from 1.915 to 1.133 CLABSI per 1,000 central line days. National Bloodstream Infection Rate
- 13. Physician-Based Strategies 13 • CMS’ Physician “Toolbox” − Physician Quality Reporting System (PQRS) − ePrescribing Program − EHR Incentive Program − Value Based Payment Modifier (VM) − Accountable Care Organizations − Comprehensive Primary Care initiative • Progress and Next Steps • Questions and Comments
- 14. CMS Innovations Portfolio: Testing New Models to Improve Quality • • • • • • • • • • • • • • • • • • • • • 1414
- 15. Marketplace
- 16. Delivery system and payment transformation 16 PUBLIC SECTOR Future State – People-Centered Outcomes Driven Sustainable Coordinated Care New Payment Systems (and many more) Value-based purchasing ACOs, Shared Savings Episode-based payments Medical Homes and care mgmt. Data Transparency Current State – Producer-Centered Volume Driven Unsustainable Fragmented Care FFS Payment Systems PRIVATE SECTOR
- 17. San Francisco Regional Office Centers for Medicare & Medicaid Services 17 Betsy L. Thompson, MD, DrPH Regional Chief Medical Officer 415-744-3631 Betsy. Thompson@cms.hhs.gov