SlideShare uma empresa Scribd logo
1 de 6
Baixar para ler offline
Name: Simon Sohn
Enzyme Experiment
Name: Simon Sohn

Group members: Misaki, Hiroki

Date of experiment: Dec. 6th 2010

              Factors affecting the speed of a catalase reaction
                     <Concentration of the substrate>


Aim: To see if the concentration of the hydrogen peroxide can affect the speed of the
catalase reaction

Hypothesis: The higher concentration of the hydrogen peroxide, the faster the speed of
the catalase reaction. Thus, more oxygen will be produced during the reaction. This will
happen because more substrates will be there in higher concentration of hydrogen
peroxide, which are to be broken down by the enzyme in liver.

Variables:

       Input variable: The concentration of the hydrogen peroxide. I will change it by
using 0.5%, 1% and 1.5% hydrogen peroxide in the experiment.

      Output variable: The amount of oxygen produced in the catalase reaction. I will
measure the total amount of the solution (H202+liver+foam).

       Control variables:

              Control variable 1: The amount of liver. I will keep it the same by using
                          the exact same amount of liver by measuring its weight.
              Control variable 2: The temperature of the hydrogen peroxide. I will
                          keep it the same by keeping the same temperature in the
                          place where the experiment is conducted.
              Control variable 3: The type of liver. I will keep it the same by using the
                          same type of liver. (Chicken liver)
              Control variable 4: The length of time needed for measuring the catalase
                          reaction. I will keep it the same by measuring every reaction
                          for 1 minute.
              Control variable 5: The amount of the hydrogen peroxide. I will keep it
                          same by using the exact same amount of hydrogen peroxide
                          in each trial. (20ml)
Materials:

   •    150ml of 0.5% hydrogen peroxide
   •    150ml of 1.0% hydrogen peroxide
   •    150ml of 1.5% hydrogen peroxide
   •    45g of liver
   •    100ml Measuring Cylinder (x1)
   •    Stopwatch (x1)
   •    Electronic Balance (x1)
   •    Tweezer (x1)
   •    Scalpel (x1)
   •    Dissecting Dish (x1)
   •    Lab coat (x1)


Method:

   1.        Cut the liver into smaller pieces with scalpel and dissecting dish.
   2.        Measure 5g of liver by using electronic balance.
   3.        Pour 50ml of 0.5% hydrogen peroxide to cylinder.
   4.        Put 5g of liver into the cylinder.
   5.        Measure and record the total amount of solution (H202+liver+foam) after 1
             minute by using a stopwatch.
   6.        Repeat the method 1-5 twice.
   7.        Repeat the method 1-5 three times using 1% hydrogen peroxide instead of 0.5%
             hydrogen peroxide.
   8.        Repeat the method 1-5 three times using 1.5% hydrogen peroxide instead of
             0.5% hydrogen peroxide.
 
 
Data Table:

                   Total amount of the solution (H2O2+liver+foam) (ml)

H2O2
Concentration
(%)                Trial 1          Trial 2          Trial 3          Average
           0.5               29.0             30.0             30.0             29.7
           1.0               35.0             37.0             35.0             35.7
           1.5               45.0             40.0             38.0             41.0
Graph:


                                   H202 Concentra.on .vs. Amount of 
                                      Oxygen Produced (Average) 
                                  50.0 
   Total amount of the solu.on 
     (H2O2+liver+foam) (ml)  


                                  40.0 
                                  30.0 
                                  20.0 
                                  10.0 
                                   0.0 
                                          0.0    0.5             1.0             1.5          2.0 
                                                        H2O2 Concentra.on (%) 


Conclusion:
       As it can be seen in the table above, the higher concentration of H202 resulted in
more total amount of solution including H202, liver and foam. My data is reliable
because all the trials in each concentration show increasing total amount, as the
concentration of hydrogen peroxide gets higher. Moreover, the difference between
average values of all three concentrations is 6. Thus, my hypothesis “The higher
concentration of the hydrogen peroxide, the faster the speed of the catalase reaction”
was correct. The higher concentration results in the faster the speed of the catalase
reaction because increasing concentration of substrate in higher concentration of H2O2
increases the chances of substrates to join with enzyme. Thereby, in my case, more
oxygen foam is created in the reaction.


Evaluation:


Errors/Weaknesses in                                    Specific Effect on              Improvement to your
Your Method                                             Your Data                       method
1. In the beginning of the       The difference               We used 20ml of
experiment, we used              between each                 hydrogen peroxide
50ml of hydrogen                 concentration didn’t         instead of 50ml of
peroxide for each trial.         vary much. Therefore,        hydrogen peroxide and
However, 50ml of                 we couldn’t get any          this gave the obvious
hydrogen peroxide was            pattern or trend.            difference of amount of
too much to see the                                           oxygen produced
definite difference                                           between each
between each                                                  concentration.
concentration.

2. Livers were cut into          Some trials, in which        Cutting the liver into as
different size of pieces.        comparatively small          same size of pieces as
This created more                pieces of liver were         possible in order to
surface area of liver in         put into H2O2, would         create same surface
certain trials. In the           result in more oxygen        area of the liver.
certain trials, the speed        produced. In our
of catalase reaction             case, the total amount
could get faster.                of solution would be
                                 higher.
3. Livers often stuck to         When livers stuck to         Waiting till liver
the cylinder. It took more       the cylinder, it often       completely sinks into
time for liver to be sunk        resulted in less             H2O2, and then starting
into H202.                       oxygen produced in           the timing.
                                 that trial. This error
                                 reduced the reliability
                                 of the data.


Other areas of investigation:
If I get to do this experiment over, I want to change the input variable to different type of
organ. This is because if I use different type of organ as my input variable, this
experiment will give entirely different hypothesis and pattern from previous experiment
with different concentration of hydrogen peroxide. Therefore, I would obtain entirely new
scientific information.

Mais conteúdo relacionado

Mais procurados

Laboratory Manual for Physiology: MANIK
Laboratory Manual for Physiology: MANIKLaboratory Manual for Physiology: MANIK
Laboratory Manual for Physiology: MANIKImran Nur Manik
 
Comparison of the acidity of fruit juices
Comparison of the acidity of fruit juicesComparison of the acidity of fruit juices
Comparison of the acidity of fruit juicesadusmmangao
 
International baccalaureate biology sl investigation_osmosis by felix dyrek
International baccalaureate biology sl investigation_osmosis by felix dyrekInternational baccalaureate biology sl investigation_osmosis by felix dyrek
International baccalaureate biology sl investigation_osmosis by felix dyrekFelix Dyrek
 
Biochemistry and molecular biology lab MANIK
Biochemistry and molecular biology lab MANIKBiochemistry and molecular biology lab MANIK
Biochemistry and molecular biology lab MANIKImran Nur Manik
 
Osmosis lab report
Osmosis lab reportOsmosis lab report
Osmosis lab reportAbood Omar
 
B. Pharm. (Honours) Part-IV Practical, Pharmaceutical AnalysisII, MANIK
B. Pharm. (Honours) Part-IV Practical, Pharmaceutical AnalysisII, MANIKB. Pharm. (Honours) Part-IV Practical, Pharmaceutical AnalysisII, MANIK
B. Pharm. (Honours) Part-IV Practical, Pharmaceutical AnalysisII, MANIKImran Nur Manik
 
Rate of Reaction
Rate of ReactionRate of Reaction
Rate of ReactionM BR
 
Pharmaceutical analysis II (Practical) MANIK up
Pharmaceutical analysis II (Practical) MANIK upPharmaceutical analysis II (Practical) MANIK up
Pharmaceutical analysis II (Practical) MANIK upImran Nur Manik
 
Reducing the Effects of Sample Solvent on UHPLC Analyses
Reducing the Effects of Sample Solvent on UHPLC AnalysesReducing the Effects of Sample Solvent on UHPLC Analyses
Reducing the Effects of Sample Solvent on UHPLC AnalysesShimadzu Scientific Instruments
 
Diffusion lab
Diffusion labDiffusion lab
Diffusion lab14771
 
Elly lee effect of temperature on reaction rate
Elly lee   effect of temperature on reaction rateElly lee   effect of temperature on reaction rate
Elly lee effect of temperature on reaction ratejanlee97
 
Aprevised osmosis lab
Aprevised osmosis labAprevised osmosis lab
Aprevised osmosis labsbarkanic
 
0620 s09 qp_5
0620 s09 qp_50620 s09 qp_5
0620 s09 qp_5King Ali
 
Department of biochemistry cell ad molecular biology (1)
Department of biochemistry cell ad   molecular biology (1)Department of biochemistry cell ad   molecular biology (1)
Department of biochemistry cell ad molecular biology (1)Samuel Baffoe
 
Factors affecting rate of reaction (recovered)
Factors affecting rate of reaction (recovered)Factors affecting rate of reaction (recovered)
Factors affecting rate of reaction (recovered)Siti Alias
 
Optimization of Adol Adduct
Optimization of Adol AdductOptimization of Adol Adduct
Optimization of Adol AdductDan Betts
 

Mais procurados (20)

Laboratory Manual for Physiology: MANIK
Laboratory Manual for Physiology: MANIKLaboratory Manual for Physiology: MANIK
Laboratory Manual for Physiology: MANIK
 
Comparison of the acidity of fruit juices
Comparison of the acidity of fruit juicesComparison of the acidity of fruit juices
Comparison of the acidity of fruit juices
 
International baccalaureate biology sl investigation_osmosis by felix dyrek
International baccalaureate biology sl investigation_osmosis by felix dyrekInternational baccalaureate biology sl investigation_osmosis by felix dyrek
International baccalaureate biology sl investigation_osmosis by felix dyrek
 
Biochemistry and molecular biology lab MANIK
Biochemistry and molecular biology lab MANIKBiochemistry and molecular biology lab MANIK
Biochemistry and molecular biology lab MANIK
 
Osmosis lab report
Osmosis lab reportOsmosis lab report
Osmosis lab report
 
Chemistry Lab Report 1
Chemistry Lab Report 1Chemistry Lab Report 1
Chemistry Lab Report 1
 
B. Pharm. (Honours) Part-IV Practical, Pharmaceutical AnalysisII, MANIK
B. Pharm. (Honours) Part-IV Practical, Pharmaceutical AnalysisII, MANIKB. Pharm. (Honours) Part-IV Practical, Pharmaceutical AnalysisII, MANIK
B. Pharm. (Honours) Part-IV Practical, Pharmaceutical AnalysisII, MANIK
 
Chemistry Lab Report 3
Chemistry Lab Report 3Chemistry Lab Report 3
Chemistry Lab Report 3
 
Rate of Reaction
Rate of ReactionRate of Reaction
Rate of Reaction
 
Physical Pharmacy-I lab
Physical Pharmacy-I labPhysical Pharmacy-I lab
Physical Pharmacy-I lab
 
Pharmaceutical analysis II (Practical) MANIK up
Pharmaceutical analysis II (Practical) MANIK upPharmaceutical analysis II (Practical) MANIK up
Pharmaceutical analysis II (Practical) MANIK up
 
Reducing the Effects of Sample Solvent on UHPLC Analyses
Reducing the Effects of Sample Solvent on UHPLC AnalysesReducing the Effects of Sample Solvent on UHPLC Analyses
Reducing the Effects of Sample Solvent on UHPLC Analyses
 
Diffusion lab
Diffusion labDiffusion lab
Diffusion lab
 
Elly lee effect of temperature on reaction rate
Elly lee   effect of temperature on reaction rateElly lee   effect of temperature on reaction rate
Elly lee effect of temperature on reaction rate
 
Aprevised osmosis lab
Aprevised osmosis labAprevised osmosis lab
Aprevised osmosis lab
 
0620 s09 qp_5
0620 s09 qp_50620 s09 qp_5
0620 s09 qp_5
 
Department of biochemistry cell ad molecular biology (1)
Department of biochemistry cell ad   molecular biology (1)Department of biochemistry cell ad   molecular biology (1)
Department of biochemistry cell ad molecular biology (1)
 
Factors affecting rate of reaction (recovered)
Factors affecting rate of reaction (recovered)Factors affecting rate of reaction (recovered)
Factors affecting rate of reaction (recovered)
 
Cholinesterase
CholinesteraseCholinesterase
Cholinesterase
 
Optimization of Adol Adduct
Optimization of Adol AdductOptimization of Adol Adduct
Optimization of Adol Adduct
 

Destaque

Gene Therapy One World Essay
Gene Therapy One World EssayGene Therapy One World Essay
Gene Therapy One World Essayimdoldoli
 
Pe(basketball and volleyball)
Pe(basketball and volleyball)Pe(basketball and volleyball)
Pe(basketball and volleyball)hunny1126
 
Stem Cell Essay+Rubric
Stem Cell Essay+RubricStem Cell Essay+Rubric
Stem Cell Essay+Rubricmarlita101
 
Zoey Gleason RN-BSN Essay
Zoey Gleason RN-BSN EssayZoey Gleason RN-BSN Essay
Zoey Gleason RN-BSN EssayZoey Gleason
 
PSY209 Research Paper
PSY209 Research PaperPSY209 Research Paper
PSY209 Research PaperBridget Pody
 
SPK - Genetic OWE Graded
SPK - Genetic OWE GradedSPK - Genetic OWE Graded
SPK - Genetic OWE GradedMay Clyne
 
Stem cell one world essay
Stem cell one world essayStem cell one world essay
Stem cell one world essayhunny1126
 
Stem celldaeun
Stem celldaeunStem celldaeun
Stem celldaeuns08051
 
Hyoji genetic testing essay
Hyoji genetic testing essayHyoji genetic testing essay
Hyoji genetic testing essayHyoji
 
Ge christine
Ge christineGe christine
Ge christinecnaruto
 
Stemcell bonghee1
Stemcell bonghee1Stemcell bonghee1
Stemcell bonghee1hbong95
 
Huntington Modifier Gene Research Paper
Huntington Modifier Gene Research PaperHuntington Modifier Gene Research Paper
Huntington Modifier Gene Research PaperJustin Durland
 

Destaque (20)

Gene Therapy One World Essay
Gene Therapy One World EssayGene Therapy One World Essay
Gene Therapy One World Essay
 
Pe(basketball and volleyball)
Pe(basketball and volleyball)Pe(basketball and volleyball)
Pe(basketball and volleyball)
 
Bio 152 Paper
Bio 152 PaperBio 152 Paper
Bio 152 Paper
 
Essay 5- Mental
Essay 5- Mental Essay 5- Mental
Essay 5- Mental
 
Huntington's
Huntington'sHuntington's
Huntington's
 
Genetic engineering by vvr ias
Genetic engineering by vvr iasGenetic engineering by vvr ias
Genetic engineering by vvr ias
 
One World Essay
One World EssayOne World Essay
One World Essay
 
Gene therapy
Gene therapyGene therapy
Gene therapy
 
Bioinfo Project
Bioinfo ProjectBioinfo Project
Bioinfo Project
 
Stem Cell Essay+Rubric
Stem Cell Essay+RubricStem Cell Essay+Rubric
Stem Cell Essay+Rubric
 
DES. BABIES friday edit
DES. BABIES friday editDES. BABIES friday edit
DES. BABIES friday edit
 
Zoey Gleason RN-BSN Essay
Zoey Gleason RN-BSN EssayZoey Gleason RN-BSN Essay
Zoey Gleason RN-BSN Essay
 
PSY209 Research Paper
PSY209 Research PaperPSY209 Research Paper
PSY209 Research Paper
 
SPK - Genetic OWE Graded
SPK - Genetic OWE GradedSPK - Genetic OWE Graded
SPK - Genetic OWE Graded
 
Stem cell one world essay
Stem cell one world essayStem cell one world essay
Stem cell one world essay
 
Stem celldaeun
Stem celldaeunStem celldaeun
Stem celldaeun
 
Hyoji genetic testing essay
Hyoji genetic testing essayHyoji genetic testing essay
Hyoji genetic testing essay
 
Ge christine
Ge christineGe christine
Ge christine
 
Stemcell bonghee1
Stemcell bonghee1Stemcell bonghee1
Stemcell bonghee1
 
Huntington Modifier Gene Research Paper
Huntington Modifier Gene Research PaperHuntington Modifier Gene Research Paper
Huntington Modifier Gene Research Paper
 

Mais de hunny1126

Catalase simon
Catalase simonCatalase simon
Catalase simonhunny1126
 
Analysis of graffiti art
Analysis of graffiti artAnalysis of graffiti art
Analysis of graffiti arthunny1126
 
Architecture Tour Guide
Architecture Tour GuideArchitecture Tour Guide
Architecture Tour Guidehunny1126
 
The Forces That Flattened The World
The Forces That Flattened The WorldThe Forces That Flattened The World
The Forces That Flattened The Worldhunny1126
 
English reading test 2
English reading test 2English reading test 2
English reading test 2hunny1126
 
English reading test
English reading testEnglish reading test
English reading testhunny1126
 
Yeast experiment
Yeast experimentYeast experiment
Yeast experimenthunny1126
 
Stem cell-one world essay
Stem cell-one world essayStem cell-one world essay
Stem cell-one world essayhunny1126
 
Simon Position Paper
Simon Position PaperSimon Position Paper
Simon Position Paperhunny1126
 
Simon Resolution
Simon ResolutionSimon Resolution
Simon Resolutionhunny1126
 
Explorers+ +Living+Museum
Explorers+ +Living+MuseumExplorers+ +Living+Museum
Explorers+ +Living+Museumhunny1126
 
Travel Guide
Travel GuideTravel Guide
Travel Guidehunny1126
 

Mais de hunny1126 (12)

Catalase simon
Catalase simonCatalase simon
Catalase simon
 
Analysis of graffiti art
Analysis of graffiti artAnalysis of graffiti art
Analysis of graffiti art
 
Architecture Tour Guide
Architecture Tour GuideArchitecture Tour Guide
Architecture Tour Guide
 
The Forces That Flattened The World
The Forces That Flattened The WorldThe Forces That Flattened The World
The Forces That Flattened The World
 
English reading test 2
English reading test 2English reading test 2
English reading test 2
 
English reading test
English reading testEnglish reading test
English reading test
 
Yeast experiment
Yeast experimentYeast experiment
Yeast experiment
 
Stem cell-one world essay
Stem cell-one world essayStem cell-one world essay
Stem cell-one world essay
 
Simon Position Paper
Simon Position PaperSimon Position Paper
Simon Position Paper
 
Simon Resolution
Simon ResolutionSimon Resolution
Simon Resolution
 
Explorers+ +Living+Museum
Explorers+ +Living+MuseumExplorers+ +Living+Museum
Explorers+ +Living+Museum
 
Travel Guide
Travel GuideTravel Guide
Travel Guide
 

Catalase simon

  • 2.
  • 3. Name: Simon Sohn Group members: Misaki, Hiroki Date of experiment: Dec. 6th 2010 Factors affecting the speed of a catalase reaction <Concentration of the substrate> Aim: To see if the concentration of the hydrogen peroxide can affect the speed of the catalase reaction Hypothesis: The higher concentration of the hydrogen peroxide, the faster the speed of the catalase reaction. Thus, more oxygen will be produced during the reaction. This will happen because more substrates will be there in higher concentration of hydrogen peroxide, which are to be broken down by the enzyme in liver. Variables: Input variable: The concentration of the hydrogen peroxide. I will change it by using 0.5%, 1% and 1.5% hydrogen peroxide in the experiment. Output variable: The amount of oxygen produced in the catalase reaction. I will measure the total amount of the solution (H202+liver+foam). Control variables: Control variable 1: The amount of liver. I will keep it the same by using the exact same amount of liver by measuring its weight. Control variable 2: The temperature of the hydrogen peroxide. I will keep it the same by keeping the same temperature in the place where the experiment is conducted. Control variable 3: The type of liver. I will keep it the same by using the same type of liver. (Chicken liver) Control variable 4: The length of time needed for measuring the catalase reaction. I will keep it the same by measuring every reaction for 1 minute. Control variable 5: The amount of the hydrogen peroxide. I will keep it same by using the exact same amount of hydrogen peroxide in each trial. (20ml)
  • 4. Materials: • 150ml of 0.5% hydrogen peroxide • 150ml of 1.0% hydrogen peroxide • 150ml of 1.5% hydrogen peroxide • 45g of liver • 100ml Measuring Cylinder (x1) • Stopwatch (x1) • Electronic Balance (x1) • Tweezer (x1) • Scalpel (x1) • Dissecting Dish (x1) • Lab coat (x1) Method: 1. Cut the liver into smaller pieces with scalpel and dissecting dish. 2. Measure 5g of liver by using electronic balance. 3. Pour 50ml of 0.5% hydrogen peroxide to cylinder. 4. Put 5g of liver into the cylinder. 5. Measure and record the total amount of solution (H202+liver+foam) after 1 minute by using a stopwatch. 6. Repeat the method 1-5 twice. 7. Repeat the method 1-5 three times using 1% hydrogen peroxide instead of 0.5% hydrogen peroxide. 8. Repeat the method 1-5 three times using 1.5% hydrogen peroxide instead of 0.5% hydrogen peroxide.     Data Table: Total amount of the solution (H2O2+liver+foam) (ml) H2O2 Concentration (%) Trial 1 Trial 2 Trial 3 Average 0.5 29.0 30.0 30.0 29.7 1.0 35.0 37.0 35.0 35.7 1.5 45.0 40.0 38.0 41.0
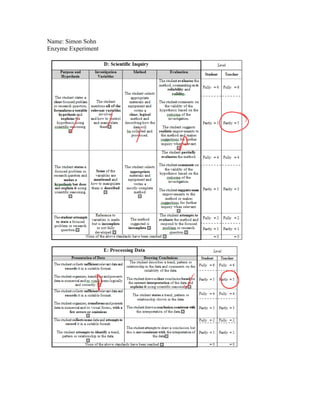
  • 5. Graph: H202 Concentra.on .vs. Amount of  Oxygen Produced (Average)  50.0  Total amount of the solu.on  (H2O2+liver+foam) (ml)   40.0  30.0  20.0  10.0  0.0  0.0  0.5  1.0  1.5  2.0  H2O2 Concentra.on (%)  Conclusion: As it can be seen in the table above, the higher concentration of H202 resulted in more total amount of solution including H202, liver and foam. My data is reliable because all the trials in each concentration show increasing total amount, as the concentration of hydrogen peroxide gets higher. Moreover, the difference between average values of all three concentrations is 6. Thus, my hypothesis “The higher concentration of the hydrogen peroxide, the faster the speed of the catalase reaction” was correct. The higher concentration results in the faster the speed of the catalase reaction because increasing concentration of substrate in higher concentration of H2O2 increases the chances of substrates to join with enzyme. Thereby, in my case, more oxygen foam is created in the reaction. Evaluation: Errors/Weaknesses in Specific Effect on Improvement to your Your Method Your Data method
  • 6. 1. In the beginning of the The difference We used 20ml of experiment, we used between each hydrogen peroxide 50ml of hydrogen concentration didn’t instead of 50ml of peroxide for each trial. vary much. Therefore, hydrogen peroxide and However, 50ml of we couldn’t get any this gave the obvious hydrogen peroxide was pattern or trend. difference of amount of too much to see the oxygen produced definite difference between each between each concentration. concentration. 2. Livers were cut into Some trials, in which Cutting the liver into as different size of pieces. comparatively small same size of pieces as This created more pieces of liver were possible in order to surface area of liver in put into H2O2, would create same surface certain trials. In the result in more oxygen area of the liver. certain trials, the speed produced. In our of catalase reaction case, the total amount could get faster. of solution would be higher. 3. Livers often stuck to When livers stuck to Waiting till liver the cylinder. It took more the cylinder, it often completely sinks into time for liver to be sunk resulted in less H2O2, and then starting into H202. oxygen produced in the timing. that trial. This error reduced the reliability of the data. Other areas of investigation: If I get to do this experiment over, I want to change the input variable to different type of organ. This is because if I use different type of organ as my input variable, this experiment will give entirely different hypothesis and pattern from previous experiment with different concentration of hydrogen peroxide. Therefore, I would obtain entirely new scientific information.