SlideShare uma empresa Scribd logo
1 de 3
Baixar para ler offline
July 2008

                                                                                                                                                                                                                                               Euro Class A-1
10-12 Cork Street                                     55 East 52nd Street, 33rd Floor
London W1S 3NP                                        New York, New York 10055                                             MTD:                              -4.43%
Phone: +44 207 534 9244                               Phone:      +1 212 319 6060                                          NAV:                              95.08
Fax:     +44 207 534 9245                             Fax:        +1 212 319 0450
Contact: Andres Piedrahita                            Email:      andres@fgguk.com                                         Benchmark 1:                                               MSCI World Index (USD) Price Index
Contact: Andrew Smith                                 Email:      andrews@fgguk.com                                        Benchmark 2:                                               HFRI Fund of Funds Composite Index

The Irongate Global Strategy Fund Limited (quot;Irongatequot;, or the quot;Fundquot;) is a fund of hedge funds that seeks to achieve capital preservation, long-term capital appreciation and superior risk-
adjusted returns with low correlation to traditional equity and fixed income markets. Irongate enables an investor to gain low volatility exposure to the alternative asset management arena
without relying on one strategy or manager. Irongate invests with experienced managers that have long term track records, that employ strict risk guidelines, and that have delivered strong
returns over time. These managers have exceptional reputations and are typically leaders in their sector. Irongate currently invests with managers employing the following strategies: Macro,
Long/Short Equities, Emerging Markets, Fixed Income Arbitrage, Quantitative Equities, Event Driven, Credit and Distressed, Convertible Arbitrage, Multi-Strategy, and Commodities Trading
Advisors. Irongate may leverage the equity of the Fund. Irongate employs constant qualitative, quantitative, and operational monitoring of all managers in the Fund.

*The monthly performance shown below represents the actual historical performance of Irongate Global Strategy Fund Ltd. Class A-2 (“Irongate”) after being adjusted to reflect the deduction
of all fees and expenses, including but not limited to the 1.15% annual management fee and 10% performance fee charged by Irongate Global Strategy Fund Ltd. Class A-1. Irongate launched
on July 1, 2004, and Class A-1 shares are offered as of March 1, 2008.


                                                     Growth of Initial $1000                                                                                                         Distribution of Returns
                                                                                                                                              12
                          70%
     Cumulative Return


                          60%                                                                                                                 10


                                                                                                                            Monthly Periods
                          50%
                                                                                                                                               8
                          40%
                          30%                                                                                                                  6
                          20%
                                                                                                                                               4
                          10%
                           0%                                                                                                                  2
                         -10%
                                                                                                                                               0
                           2004       2005               2006                     2007                   2008
                                                                                                                                                    < -10%


                                                                                                                                                             -9 to -8


                                                                                                                                                                          -7 to -6


                                                                                                                                                                                      -5 to -4


                                                                                                                                                                                                   -3 to -2


                                                                                                                                                                                                              -1 to 0


                                                                                                                                                                                                                          1 to 2


                                                                                                                                                                                                                                   3 to 4


                                                                                                                                                                                                                                              5 to 6


                                                                                                                                                                                                                                                       7 to 8


                                                                                                                                                                                                                                                                  9 to 10
                                                      Irongate Global Strategy Fund Limited (Euro Class-A1)
                                                      MSCI World Index (USD) Price Index
                                                      HFRI Fund of Funds Composite Index                                                                                                         Return Range (%)

                                                                            Monthly Performance (%) Net of Fees and Expenses
   Year                         Jan           Feb          Mar              Apr            May           Jun*       Jul                  Aug                            Sep                       Oct                    Nov                 Dec                  Year
   2008                    -3.17%            2.57%       -4.26%           0.43%           3.25%         0.21%     -4.43%                                                                                                                                         -5.57%
   2007                     1.86%            0.72%        1.75%           1.95%           2.71%         0.91%     0.63%          -3.34%                            2.47%                         4.24%                  -0.64%              0.99%                14.99%
   2006                     3.83%            0.14%        1.94%           2.27%          -2.94%         -0.33%    0.36%            0.59%                         -1.51%                          1.96%                  2.17%               2.49%                11.31%
   2005                     0.06%            2.23%       -0.53%           -2.73%         -0.31%         3.01%     2.84%            1.16%                           2.44%                         -3.08%                 2.19%               2.39%                9.84%
   2004                                                                                                                            0.12%                           1.05%                         1.31%                  3.65%               1.57%                7.91%
                                                                                         MSCI                                                                                                                                               MSCI
Statistical Analysis                                                       Fund                      HFRI FOF                                                                                                           Fund                                    HFRI FOF
                                                                                         World                                                                                                                                              World
Returns                                                                                                          Annual Returns
Compound ROR                                                              9.41%            7.41%        7.07%                                      2008-(YTD)                                                           -5.57%              -13.98%              -5.03%
Cumulative Return                                                        43.27%           33.08%       31.42%                                         2007                                                              14.99%               7.09%               10.25%
Cumulative VAMI                                                         $ 1,433          $ 1,331      $ 1,314                                         2006                                                              11.31%              17.95%               10.39%
Best Month                                                                4.24%            5.09%        3.07%                                         2005                                                               9.84%               7.56%                7.49%
Worst Month                                                              -4.43%           -8.10%       -2.90%                                         2004                                                               7.91%               13.86%               5.78%
Percent Profitable                                                       75.00%           62.50%       68.75%
Risk                                                                                                             Latest Returns
Standard Deviation                                                         7.46%          10.28%         5.19%                                      Last Month                                                          -4.43%               -2.53%              -2.73%
Sharpe Ratio (4.1%)                                                         0.71            0.36          0.58                                     Last 3 Months                                                        -1.12%               -9.43%              -1.83%
Sortino Ratio (10.0%)                                                      -0.09           -0.29         -0.61                                       Last Year                                                          -2.16%              -12.72%              -3.23%
Downside Deviation (10.0%)                                                5.94%            8.32%         4.47%                                         2-Year                                                           7.17%                1.48%               5.44%
Max Drawdown                                                              -5.57%         -18.76%        -6.04%                                         3-Year                                                           8.30%                4.78%               6.55%
Months In Maximum Drawdown                                                    7               9             9                                          4-Year                                                            9.41%                7.41%               7.07%
Months To Recover
Comparison To Benchmarks                                                                                         Drawdown Analysis
Alpha                                                                                     0.47%         -0.03%                                               1                                                          -5.57%              -18.76%              -6.04%
Annualized Alpha                                                                          5.74%         -0.35%                                               2                                                          -3.82%               -4.51%              -2.70%
Beta                                                                                       0.48          1.38                                                3                                                          -3.54%               -3.89%              -2.18%
Correlation                                                                                0.66          0.96                                                4                                                          -3.34%               -3.42%              -1.96%
July 2008

                                                                                                                                                                                                                       Euro Class A-1
                                     Annualized Return Vs. Annualized Standard Deviation                                                                                     Allocation By Strategy

                     25%
                                                                                                                                                                          Convertible
                                                                                                                                                                        Arbitrage, 0.00%                 Credit and
                                                                                                                                                                                                         Distressed,
                     20%                                                                                                              Multi-Strategy,                                                     20.14%
                                                                                                                                         26.05%
 Annualized Return


                     15%
#######                                                                                                                                                                                                                  Emerging
                                                                                                                                                                                                                       Markets, 8.21%
                                                                                                                              Commodities/
                     10%                                                                                                     Managed Futures,
                                                                                                                                 3.25%
                                                                                                                                                                                                                      Event-Driven,
                      5%                                                                                                                                                                                                 9.33%
                                                                                                                                                                                                                  Quantitative
                                                                                                                                     Long/Short
                                                                                                                                                                                                                 Equities, 3.32%
                                                                                                                                    Equity Hedge,
                      0%                                                                                                               16.74%
                           2%            4%                  6%           8%               10%               12%                                                                                Fixed Income
                                         Irongate Global Strategy Fund Limited (Euro Class-A1)
                                                                                                                                                        Global Macro,                          Arbitrage, 6.34%
                                         MSCI World Index (USD) Price Index                                                                                6.62%
                                         HFRI Fund of Funds Composite Index


                                            Monthly Performance Attribution By Strategy                                                                     YTD Performance Attribution By Strategy
                                             (contribution to monthly net performance)                                                                       (contribution to YTD net performance)


                             Quantitative Equities                                                                                      Quantitative Equities                                                             0.13%
                                                                                                             0.05%


                             Convertible Arbitrage                                                           0.00%                     Convertible Arbitrage                                                           0.02%


                                                                                                                                    Long/Short Equity Hedge                                                              0.01%
                                Emerging Markets                                                         -0.10%

                                                                                                                                     Managed Futures (CTAs)                                                  -0.02%
                           Fixed Income Arbitrage                                                        -0.10%

                                                                                                                                      Fixed Income Arbitrage                                        -0.33%
                                    Global Macro                                                    -0.25%

                                                                                                                                           Emerging Markets                                     -0.49%
                                     Event Driven                                          -0.47%

                                                                                                                                        Credit and Distressed                                  -0.57%
 Commodities/Managed Futures                                                               -0.50%

                                                                                                                                                  Global Macro                        -0.86%
                       Long/Short Equity Hedge                                         -0.64%

                                                                                                                                                  Event Driven                     -1.00%
                                    Multi-Strategy                        -0.97%
                                                                                                                                                                        -1.82%
                                                                                                                                                Multi-Strategy
                             Credit and Distressed       -1.45%

                                                                                                                                                              -2.0%         -1.5%       -1.0%       -0.5%         0.0%           0.5%     1.0%
                                                     -1.7%        -1.4%   -1.1%    -0.8%         -0.5%       -0.2%    0.1%

                                                                                                                     Top Ten Holdings

                     7.00%
                     6.00%
                     5.00%
                     4.00%          3.42%                3.32%
                                                                               2.83%                2.75%               2.73%             2.58%                 2.55%                2.46%               2.45%
                     3.00%                                                                                                                                                                                                       2.33%
                     2.00%
                     1.00%
                     0.00%
                                HARBINGER              MADOFF             MILLENNIUM             PAULSON             HEALTHCOR       TIGER GLOBAL          D.E. SHAW             KING STREET        KENSINGTON             III FUND LTD
                                                                                                ADVANTAGE                                                 COMPOSITE                                                        PTG USD0.01


                                                                                                                     Fund Information
Fund Name:                                                         Irongate Global Strategy Fund Limited                          Assets Under Management:                       $2.31 Billion
Manager Name:                                                      Fairfield Greenwich Advisors LLC                               Minimum Initial Investment:                    100,000
Investment Manager:                                                Fairfield Greenwich (UK) Limited                               Currencies:                                    US$, Euro€, GBP₤
Investment Advisor:                                                Union Bancaire Privée                                          Management Fee                                 1.15%
Administrator:                                                     Citco Fund Services (Europe) B.V.                              Performance Fee                                10.00%
Auditor:                                                           KPMG LLP                                                       High Water Mark:                               Yes
Custodian:                                                         Union Bancaire Privée                                          Redemptions                                    Quarterly
Legal Advisor (UK):                                                Schulte Roth and Zabel                                         Subscriptions                                  Monthly
Legal Advisor (Cayman):                                            Stuarts Walker Hersant                                         Notice:                                        65 Days
Inception Date:                                                    1-Jul-04                                                       Lockup:                                        6 months Hard/6 months Soft (3% fee)
Structure:                                                         Cayman Islands exempted company                                Reporting:                                     Monthly NAV
ISIN:                                                              KYG4948V1014
IMPORTANT NOTICE

Fund performance reflects the actual historical performance of Irongate Global Strategy Fund Ltd. Class A-2 (“Irongate”) after being adjusted to reflect the deduction of all
fees and expenses, including but not limited to the 1.15% annual management fee and 10% performance fee charged by Irongate Global Strategy Fund Ltd. Class A-1.
Irongate launched on March 1, 2003, and Class A-1 shares are offered as of March 1, 2008.

This document does not constitute an offering of any security, product, service or fund, including interests in the Irongate Global Strategy Fund Limited (the “Fund”),
which can only be made to qualified investors by the Fund’s Prospectus. This document is for informational purposes only and may not be relied upon by you in evaluating
the merits of investing in the Fund. It is qualified in its entirety by the Prospectus and no offering of interests in the Fund may be made by any literature, advertising, or
document in whatever form other than the Prospectus, which supersedes and may qualify, and differ from, the information and opinions contained herein.

The Prospectus contains important information regarding the Fund's investment objectives, risks, fees, liquidity, and other matters of interest and should be carefully read
prior to an investment in the Fund. There are no assurances that the stated investment objectives of the Fund will be met. The purchase of interests in the Fund is suitable
only for qualified investors for whom an investment in the Fund does not constitute a complete investment program and who fully understand and are willing to assume
the risks involved in the Fund’s investment program. The interests described herein will not be registered under the laws of any jurisdiction including the United States
Securities Act of 1933 or the United States Investment Company Act of 1940, the laws of any state of the United States or the laws of any foreign jurisdiction and may not
be offered or sold without compliance to applicable securities laws.

Hedge funds (or funds of hedge funds): Often engage in leveraging and other speculative investment practices that may increase the risk of investment loss; Can be highly
illiquid; Are not required to provide periodic pricing or valuation information to investors; May involve complex tax structures and delays in distributing important tax
information; Are not subject to the same regulatory requirements as registered investment companies; and Often charge high fees. An investor could lose all or substantially
all of his or her investment. Where securities are issued in a currency other than the investors’ currency of reference, changes in exchange rates may have an adverse effect
on the value of the investment. Further, any number of conflicts of interest may exist in the context of the management and/or operation of any hedge fund.

Securities are distributed by Fairfield Greenwich Limited, the Fund’s placement agent, and its subsidiaries: In the United States securities are offered through Fairfield
Heathcliff Capital LLC (“FHC”), a broker-dealer and member FINRA and SIPC. FHC is an affiliate of the Fund's Investment Manager and Manager. Investment management
services are offered by Fairfield Greenwich Advisors LLC. The Fund and the underlying managers of the Fund may employ leverage and the Fund's performance may be
volatile. There is no secondary market for the investor’s interest in the Fund and none is expected to develop. There may be restrictions on transferring interests in the
Fund. The Fund's fees and expenses may offset its trading profits. Unaffiliated placement agents may also place limited partnership interests of the Fund. Assets under
management represent the leveraged amount, which is approximately 1.5x, although Fund guidelines permit leverage up to 100% of equity.

The summary/prices/quotes/statistics in this document have been obtained from sources deemed to be reliable, but we do not guarantee their accuracy or completeness.
Information contained herein is subject to change without notice. Past performance is not a guarantee of future results. This document is confidential and may not be
reproduced or distributed without the prior written consent of Fairfield Greenwich Group. Fairfield Greenwich Group is the marketing name for the securities and
investment advisory businesses of Fairfield Greenwich Limited and its subsidiaries worldwide. Additional information is available upon request.

The index information is included merely to show the general trend in applicable markets in the periods indicated and is not intended to imply that the Fund was similar to
the index either in composition or element of risk. It is not possible to invest in an index. The MSCI World Index is a free float-adjusted market capitalization index that is
designed to measure global developed market equity performance. As of June 2006 it consisted of 23 developed market country indices. Hedge Fund Research Inc. (HFRI)
Fund of Funds index is an equally-weighted, unmanaged index comprised of domestic and offshore hedge fund of funds. HFRI Indices are based on information self-
reported by hedge fund managers that decide, on their own, at any time, whether or not they want to provide, or continue to provide, information to HFR Asset
Management, L.L.C. Results for funds that go out of business are included in the index until the date that they cease operations. Therefore, these indices may not be
complete or accurate representations of the hedge fund universe, and may be biased in several ways. YTD Performance Attribution By Strategy and Monthly Performance
Attribution By Strategy is calculated on a net basis. The attribution of cash and cash equivalents, are allocated on a prorata basis to the nine strategies. The managers to
whom the Fund allocates, some of which may be affiliated with the Fund's Investment Manager, generally charge a 2% management fee and a 20% performance fee,
though this can vary.

Mais conteúdo relacionado

Mais procurados

Rr results q3_2012_final
Rr results q3_2012_finalRr results q3_2012_final
Rr results q3_2012_finalRamirent Group
 
Anne Glover - Amadeus Capital - UK - Stanford - Jan 7 2013
Anne Glover - Amadeus Capital - UK - Stanford - Jan 7 2013Anne Glover - Amadeus Capital - UK - Stanford - Jan 7 2013
Anne Glover - Amadeus Capital - UK - Stanford - Jan 7 2013Burton Lee
 
Prospects and Challenges for the Global Economy and the MENA Region
Prospects and Challenges for the Global Economy and the MENA RegionProspects and Challenges for the Global Economy and the MENA Region
Prospects and Challenges for the Global Economy and the MENA RegionIMF
 
Bracing for Balance Sheet Repair Mode - Presentation: Christian Menegatti, Ro...
Bracing for Balance Sheet Repair Mode - Presentation: Christian Menegatti, Ro...Bracing for Balance Sheet Repair Mode - Presentation: Christian Menegatti, Ro...
Bracing for Balance Sheet Repair Mode - Presentation: Christian Menegatti, Ro...Investments Network marcus evans
 
Unemployment Charts November 2011
Unemployment Charts November 2011Unemployment Charts November 2011
Unemployment Charts November 2011mattbentley34
 
Optimum currency areas and European monetary union
Optimum currency areas and European monetary unionOptimum currency areas and European monetary union
Optimum currency areas and European monetary unionUniversity of Limerick
 
U ti investorday2011-freightforwarding
U ti investorday2011-freightforwardingU ti investorday2011-freightforwarding
U ti investorday2011-freightforwardingFrankie Coki
 
Credit suisse mexico breakfast meeting march v22012
Credit suisse mexico breakfast meeting march v22012Credit suisse mexico breakfast meeting march v22012
Credit suisse mexico breakfast meeting march v22012Octavio Aguilar
 
12 - Alberto Ades
12 - Alberto Ades12 - Alberto Ades
12 - Alberto AdesCityblog
 
RUSNANO's CEO Anatoly Chubais' presentation for Asian investors
RUSNANO's CEO Anatoly Chubais' presentation for Asian investorsRUSNANO's CEO Anatoly Chubais' presentation for Asian investors
RUSNANO's CEO Anatoly Chubais' presentation for Asian investorsSergey Lourie
 
16193713 T2 Partners Presentation On The Mortgage Crisis
16193713 T2 Partners Presentation On The Mortgage Crisis16193713 T2 Partners Presentation On The Mortgage Crisis
16193713 T2 Partners Presentation On The Mortgage CrisisChristopher R Anderson
 
IVI (Tom Nastas) Presentation At 3rd Moscow Venture Fair
IVI (Tom Nastas)  Presentation At 3rd  Moscow Venture FairIVI (Tom Nastas)  Presentation At 3rd  Moscow Venture Fair
IVI (Tom Nastas) Presentation At 3rd Moscow Venture FairThomas Nastas
 
T2 Partners Presentation On The Housing Crisis 11 9 09
T2 Partners Presentation On The Housing Crisis 11 9 09T2 Partners Presentation On The Housing Crisis 11 9 09
T2 Partners Presentation On The Housing Crisis 11 9 09mattd22556
 
the marketing shower: Randstad Rebranding
the marketing shower: Randstad Rebrandingthe marketing shower: Randstad Rebranding
the marketing shower: Randstad Rebrandingmarketmomenta
 

Mais procurados (20)

Rr results q3_2012_final
Rr results q3_2012_finalRr results q3_2012_final
Rr results q3_2012_final
 
Anne Glover - Amadeus Capital - UK - Stanford - Jan 7 2013
Anne Glover - Amadeus Capital - UK - Stanford - Jan 7 2013Anne Glover - Amadeus Capital - UK - Stanford - Jan 7 2013
Anne Glover - Amadeus Capital - UK - Stanford - Jan 7 2013
 
Prospects and Challenges for the Global Economy and the MENA Region
Prospects and Challenges for the Global Economy and the MENA RegionProspects and Challenges for the Global Economy and the MENA Region
Prospects and Challenges for the Global Economy and the MENA Region
 
EDM Strategy Sicav
EDM Strategy SicavEDM Strategy Sicav
EDM Strategy Sicav
 
Bracing for Balance Sheet Repair Mode - Presentation: Christian Menegatti, Ro...
Bracing for Balance Sheet Repair Mode - Presentation: Christian Menegatti, Ro...Bracing for Balance Sheet Repair Mode - Presentation: Christian Menegatti, Ro...
Bracing for Balance Sheet Repair Mode - Presentation: Christian Menegatti, Ro...
 
Comments on "Fifty Years of Distortions in World Food Markets"
Comments on "Fifty Years of Distortions in World Food Markets"Comments on "Fifty Years of Distortions in World Food Markets"
Comments on "Fifty Years of Distortions in World Food Markets"
 
Unemployment Charts November 2011
Unemployment Charts November 2011Unemployment Charts November 2011
Unemployment Charts November 2011
 
Optimum currency areas and European monetary union
Optimum currency areas and European monetary unionOptimum currency areas and European monetary union
Optimum currency areas and European monetary union
 
U ti investorday2011-freightforwarding
U ti investorday2011-freightforwardingU ti investorday2011-freightforwarding
U ti investorday2011-freightforwarding
 
Economic Outlook - May 2012
Economic Outlook - May 2012Economic Outlook - May 2012
Economic Outlook - May 2012
 
Credit suisse mexico breakfast meeting march v22012
Credit suisse mexico breakfast meeting march v22012Credit suisse mexico breakfast meeting march v22012
Credit suisse mexico breakfast meeting march v22012
 
The New Game in Town
The New Game in TownThe New Game in Town
The New Game in Town
 
12 - Alberto Ades
12 - Alberto Ades12 - Alberto Ades
12 - Alberto Ades
 
RUSNANO's CEO Anatoly Chubais' presentation for Asian investors
RUSNANO's CEO Anatoly Chubais' presentation for Asian investorsRUSNANO's CEO Anatoly Chubais' presentation for Asian investors
RUSNANO's CEO Anatoly Chubais' presentation for Asian investors
 
16193713 T2 Partners Presentation On The Mortgage Crisis
16193713 T2 Partners Presentation On The Mortgage Crisis16193713 T2 Partners Presentation On The Mortgage Crisis
16193713 T2 Partners Presentation On The Mortgage Crisis
 
IVI (Tom Nastas) Presentation At 3rd Moscow Venture Fair
IVI (Tom Nastas)  Presentation At 3rd  Moscow Venture FairIVI (Tom Nastas)  Presentation At 3rd  Moscow Venture Fair
IVI (Tom Nastas) Presentation At 3rd Moscow Venture Fair
 
T2 Partners Presentation On The Housing Crisis 11 9 09
T2 Partners Presentation On The Housing Crisis 11 9 09T2 Partners Presentation On The Housing Crisis 11 9 09
T2 Partners Presentation On The Housing Crisis 11 9 09
 
Q1 2009 Earning Report of Deutsche Bank Ag
Q1 2009 Earning Report of Deutsche Bank AgQ1 2009 Earning Report of Deutsche Bank Ag
Q1 2009 Earning Report of Deutsche Bank Ag
 
EDM STRATEGY SICAV
EDM STRATEGY SICAVEDM STRATEGY SICAV
EDM STRATEGY SICAV
 
the marketing shower: Randstad Rebranding
the marketing shower: Randstad Rebrandingthe marketing shower: Randstad Rebranding
the marketing shower: Randstad Rebranding
 

Semelhante a Irongate Global Strategy Fund

Telecom versus Online - Worlds in collision
Telecom versus Online - Worlds in collisionTelecom versus Online - Worlds in collision
Telecom versus Online - Worlds in collisionireijjhhjhut
 
2006:SADC Macroeconomic Convergence Programme
2006:SADC Macroeconomic Convergence Programme2006:SADC Macroeconomic Convergence Programme
2006:SADC Macroeconomic Convergence Programmeeconsultbw
 
Pine Technical report: CDI versus TJLP, volatility versus trend
Pine Technical report: CDI versus TJLP, volatility versus trendPine Technical report: CDI versus TJLP, volatility versus trend
Pine Technical report: CDI versus TJLP, volatility versus trendBanco Pine
 
May 18, Special Breakfast Roundtable – Federico Rubli Kaiser, Banco de Mexico
May 18, Special Breakfast Roundtable  – Federico Rubli Kaiser, Banco de MexicoMay 18, Special Breakfast Roundtable  – Federico Rubli Kaiser, Banco de Mexico
May 18, Special Breakfast Roundtable – Federico Rubli Kaiser, Banco de MexicoThe Paso del Norte Group
 
Strix Applications Case Studies
Strix  Applications  Case StudiesStrix  Applications  Case Studies
Strix Applications Case Studiestritv
 
2011 Annual Report Corporate Section
2011 Annual Report Corporate Section2011 Annual Report Corporate Section
2011 Annual Report Corporate SectionRecticel NV/SA
 
EVS full year 2011 earnings presentation
EVS full year 2011 earnings presentationEVS full year 2011 earnings presentation
EVS full year 2011 earnings presentationgdoultremont
 
alcoa 2008 meeting presentation
alcoa 2008 meeting presentationalcoa 2008 meeting presentation
alcoa 2008 meeting presentationfinance8
 
Step Zero: New Qualitative Assessment Allowed for Assessing Goodwill
Step Zero: New Qualitative Assessment Allowed for Assessing Goodwill Step Zero: New Qualitative Assessment Allowed for Assessing Goodwill
Step Zero: New Qualitative Assessment Allowed for Assessing Goodwill DecosimoCPAs
 
The Executive Centre Ppt
The Executive Centre   PptThe Executive Centre   Ppt
The Executive Centre Pptratanpriya
 
The Executive Centre - Gurgaon
The Executive Centre - GurgaonThe Executive Centre - Gurgaon
The Executive Centre - Gurgaonrjkapur
 
Angel Ron: Banco Popular Gs conference Crisis Junio 2010
Angel Ron: Banco Popular Gs conference Crisis Junio 2010Angel Ron: Banco Popular Gs conference Crisis Junio 2010
Angel Ron: Banco Popular Gs conference Crisis Junio 2010Banco Popular
 
Mike Short
Mike ShortMike Short
Mike Short3GDR
 
Ted Hart 11 Am June 15 2009 Digital Leap Success Online
Ted Hart 11 Am June 15 2009 Digital Leap Success OnlineTed Hart 11 Am June 15 2009 Digital Leap Success Online
Ted Hart 11 Am June 15 2009 Digital Leap Success OnlineDigital Leap
 
Intralinks Deal Flow Indicator 2009 Q3
Intralinks Deal Flow Indicator 2009 Q3Intralinks Deal Flow Indicator 2009 Q3
Intralinks Deal Flow Indicator 2009 Q3Alasdair Kilgour
 
Interim report 1 2010, Investor presentation, Nordea Bank
Interim report 1 2010, Investor presentation, Nordea BankInterim report 1 2010, Investor presentation, Nordea Bank
Interim report 1 2010, Investor presentation, Nordea BankNordea Bank
 

Semelhante a Irongate Global Strategy Fund (20)

Telecom versus Online - Worlds in collision
Telecom versus Online - Worlds in collisionTelecom versus Online - Worlds in collision
Telecom versus Online - Worlds in collision
 
2006:SADC Macroeconomic Convergence Programme
2006:SADC Macroeconomic Convergence Programme2006:SADC Macroeconomic Convergence Programme
2006:SADC Macroeconomic Convergence Programme
 
Pine Technical report: CDI versus TJLP, volatility versus trend
Pine Technical report: CDI versus TJLP, volatility versus trendPine Technical report: CDI versus TJLP, volatility versus trend
Pine Technical report: CDI versus TJLP, volatility versus trend
 
May 18, Special Breakfast Roundtable – Federico Rubli Kaiser, Banco de Mexico
May 18, Special Breakfast Roundtable  – Federico Rubli Kaiser, Banco de MexicoMay 18, Special Breakfast Roundtable  – Federico Rubli Kaiser, Banco de Mexico
May 18, Special Breakfast Roundtable – Federico Rubli Kaiser, Banco de Mexico
 
Strix Applications Case Studies
Strix  Applications  Case StudiesStrix  Applications  Case Studies
Strix Applications Case Studies
 
Snow White
Snow WhiteSnow White
Snow White
 
2011 Annual Report Corporate Section
2011 Annual Report Corporate Section2011 Annual Report Corporate Section
2011 Annual Report Corporate Section
 
Happiness initiative opt in survey results november 2011- april 2012
Happiness initiative opt in survey results november 2011- april 2012Happiness initiative opt in survey results november 2011- april 2012
Happiness initiative opt in survey results november 2011- april 2012
 
EVS full year 2011 earnings presentation
EVS full year 2011 earnings presentationEVS full year 2011 earnings presentation
EVS full year 2011 earnings presentation
 
alcoa 2008 meeting presentation
alcoa 2008 meeting presentationalcoa 2008 meeting presentation
alcoa 2008 meeting presentation
 
Step Zero: New Qualitative Assessment Allowed for Assessing Goodwill
Step Zero: New Qualitative Assessment Allowed for Assessing Goodwill Step Zero: New Qualitative Assessment Allowed for Assessing Goodwill
Step Zero: New Qualitative Assessment Allowed for Assessing Goodwill
 
Dr. Pay Tuohy: Enhancing the Health & Wellbeing of Children & Young People in...
Dr. Pay Tuohy: Enhancing the Health & Wellbeing of Children & Young People in...Dr. Pay Tuohy: Enhancing the Health & Wellbeing of Children & Young People in...
Dr. Pay Tuohy: Enhancing the Health & Wellbeing of Children & Young People in...
 
The Executive Centre Ppt
The Executive Centre   PptThe Executive Centre   Ppt
The Executive Centre Ppt
 
The Executive Centre - Gurgaon
The Executive Centre - GurgaonThe Executive Centre - Gurgaon
The Executive Centre - Gurgaon
 
Angel Ron: Banco Popular Gs conference Crisis Junio 2010
Angel Ron: Banco Popular Gs conference Crisis Junio 2010Angel Ron: Banco Popular Gs conference Crisis Junio 2010
Angel Ron: Banco Popular Gs conference Crisis Junio 2010
 
Investor Day 2012: Europe, Middle East & Africa
Investor Day 2012: Europe, Middle East & AfricaInvestor Day 2012: Europe, Middle East & Africa
Investor Day 2012: Europe, Middle East & Africa
 
Mike Short
Mike ShortMike Short
Mike Short
 
Ted Hart 11 Am June 15 2009 Digital Leap Success Online
Ted Hart 11 Am June 15 2009 Digital Leap Success OnlineTed Hart 11 Am June 15 2009 Digital Leap Success Online
Ted Hart 11 Am June 15 2009 Digital Leap Success Online
 
Intralinks Deal Flow Indicator 2009 Q3
Intralinks Deal Flow Indicator 2009 Q3Intralinks Deal Flow Indicator 2009 Q3
Intralinks Deal Flow Indicator 2009 Q3
 
Interim report 1 2010, Investor presentation, Nordea Bank
Interim report 1 2010, Investor presentation, Nordea BankInterim report 1 2010, Investor presentation, Nordea Bank
Interim report 1 2010, Investor presentation, Nordea Bank
 

Mais de hblodget

The Stimulus Bill
The Stimulus BillThe Stimulus Bill
The Stimulus Billhblodget
 
Harry Markopolos Testimony To Congress
Harry Markopolos Testimony To CongressHarry Markopolos Testimony To Congress
Harry Markopolos Testimony To Congresshblodget
 
Case Shiller November
Case Shiller NovemberCase Shiller November
Case Shiller Novemberhblodget
 
20090118 Medici
20090118 Medici20090118 Medici
20090118 Medicihblodget
 
Carol Bartz Evaluation
Carol Bartz EvaluationCarol Bartz Evaluation
Carol Bartz Evaluationhblodget
 
Madoff Jewel Heist
Madoff Jewel HeistMadoff Jewel Heist
Madoff Jewel Heisthblodget
 
Fairfield Sentry Letter January 5, 2009
Fairfield Sentry Letter   January 5, 2009Fairfield Sentry Letter   January 5, 2009
Fairfield Sentry Letter January 5, 2009hblodget
 
Fairfield Sigma Letter January 5, 2009
Fairfield Sigma Letter   January 5, 2009Fairfield Sigma Letter   January 5, 2009
Fairfield Sigma Letter January 5, 2009hblodget
 
Satyam Chairman Fraud Confession
Satyam Chairman Fraud ConfessionSatyam Chairman Fraud Confession
Satyam Chairman Fraud Confessionhblodget
 
Ubp Madoff 17 12 2008
Ubp Madoff 17 12 2008Ubp Madoff 17 12 2008
Ubp Madoff 17 12 2008hblodget
 
Fairfield Sentry Semi-Annual Review
Fairfield Sentry Semi-Annual ReviewFairfield Sentry Semi-Annual Review
Fairfield Sentry Semi-Annual Reviewhblodget
 
Nov 2008 Fgg Estimated Fund Na Vs
Nov 2008 Fgg Estimated Fund Na VsNov 2008 Fgg Estimated Fund Na Vs
Nov 2008 Fgg Estimated Fund Na Vshblodget
 
Dec 2008 Fgg Weekly Na Vs
Dec 2008 Fgg Weekly Na VsDec 2008 Fgg Weekly Na Vs
Dec 2008 Fgg Weekly Na Vshblodget
 
Fairfield Sentry Oct 2008
Fairfield Sentry Oct 2008Fairfield Sentry Oct 2008
Fairfield Sentry Oct 2008hblodget
 
Sosnik Bell: Aaron Foundation
Sosnik Bell: Aaron FoundationSosnik Bell: Aaron Foundation
Sosnik Bell: Aaron Foundationhblodget
 
Insider Trading Complaint
Insider Trading ComplaintInsider Trading Complaint
Insider Trading Complainthblodget
 
Madoff SEC Recommendation
Madoff SEC RecommendationMadoff SEC Recommendation
Madoff SEC Recommendationhblodget
 
Markopolos Madoff Complaint
Markopolos Madoff ComplaintMarkopolos Madoff Complaint
Markopolos Madoff Complainthblodget
 
Rye Select Broad Market Xl Fund Lp Ppm 2.1.07
Rye Select Broad Market Xl Fund Lp   Ppm 2.1.07Rye Select Broad Market Xl Fund Lp   Ppm 2.1.07
Rye Select Broad Market Xl Fund Lp Ppm 2.1.07hblodget
 

Mais de hblodget (20)

The Stimulus Bill
The Stimulus BillThe Stimulus Bill
The Stimulus Bill
 
Harry Markopolos Testimony To Congress
Harry Markopolos Testimony To CongressHarry Markopolos Testimony To Congress
Harry Markopolos Testimony To Congress
 
Case Shiller November
Case Shiller NovemberCase Shiller November
Case Shiller November
 
20090118 Medici
20090118 Medici20090118 Medici
20090118 Medici
 
Carol Bartz Evaluation
Carol Bartz EvaluationCarol Bartz Evaluation
Carol Bartz Evaluation
 
Madoff Jewel Heist
Madoff Jewel HeistMadoff Jewel Heist
Madoff Jewel Heist
 
Fairfield Sentry Letter January 5, 2009
Fairfield Sentry Letter   January 5, 2009Fairfield Sentry Letter   January 5, 2009
Fairfield Sentry Letter January 5, 2009
 
Fairfield Sigma Letter January 5, 2009
Fairfield Sigma Letter   January 5, 2009Fairfield Sigma Letter   January 5, 2009
Fairfield Sigma Letter January 5, 2009
 
Satyam Chairman Fraud Confession
Satyam Chairman Fraud ConfessionSatyam Chairman Fraud Confession
Satyam Chairman Fraud Confession
 
Ubp Madoff 17 12 2008
Ubp Madoff 17 12 2008Ubp Madoff 17 12 2008
Ubp Madoff 17 12 2008
 
Fairfield Sentry Semi-Annual Review
Fairfield Sentry Semi-Annual ReviewFairfield Sentry Semi-Annual Review
Fairfield Sentry Semi-Annual Review
 
Nov 2008 Fgg Estimated Fund Na Vs
Nov 2008 Fgg Estimated Fund Na VsNov 2008 Fgg Estimated Fund Na Vs
Nov 2008 Fgg Estimated Fund Na Vs
 
Dec 2008 Fgg Weekly Na Vs
Dec 2008 Fgg Weekly Na VsDec 2008 Fgg Weekly Na Vs
Dec 2008 Fgg Weekly Na Vs
 
Fif
FifFif
Fif
 
Fairfield Sentry Oct 2008
Fairfield Sentry Oct 2008Fairfield Sentry Oct 2008
Fairfield Sentry Oct 2008
 
Sosnik Bell: Aaron Foundation
Sosnik Bell: Aaron FoundationSosnik Bell: Aaron Foundation
Sosnik Bell: Aaron Foundation
 
Insider Trading Complaint
Insider Trading ComplaintInsider Trading Complaint
Insider Trading Complaint
 
Madoff SEC Recommendation
Madoff SEC RecommendationMadoff SEC Recommendation
Madoff SEC Recommendation
 
Markopolos Madoff Complaint
Markopolos Madoff ComplaintMarkopolos Madoff Complaint
Markopolos Madoff Complaint
 
Rye Select Broad Market Xl Fund Lp Ppm 2.1.07
Rye Select Broad Market Xl Fund Lp   Ppm 2.1.07Rye Select Broad Market Xl Fund Lp   Ppm 2.1.07
Rye Select Broad Market Xl Fund Lp Ppm 2.1.07
 

Último

Cybersecurity Awareness Training Presentation v2024.03
Cybersecurity Awareness Training Presentation v2024.03Cybersecurity Awareness Training Presentation v2024.03
Cybersecurity Awareness Training Presentation v2024.03DallasHaselhorst
 
PSCC - Capability Statement Presentation
PSCC - Capability Statement PresentationPSCC - Capability Statement Presentation
PSCC - Capability Statement PresentationAnamaria Contreras
 
MAHA Global and IPR: Do Actions Speak Louder Than Words?
MAHA Global and IPR: Do Actions Speak Louder Than Words?MAHA Global and IPR: Do Actions Speak Louder Than Words?
MAHA Global and IPR: Do Actions Speak Louder Than Words?Olivia Kresic
 
8447779800, Low rate Call girls in Saket Delhi NCR
8447779800, Low rate Call girls in Saket Delhi NCR8447779800, Low rate Call girls in Saket Delhi NCR
8447779800, Low rate Call girls in Saket Delhi NCRashishs7044
 
Ms Motilal Padampat Sugar Mills vs. State of Uttar Pradesh & Ors. - A Milesto...
Ms Motilal Padampat Sugar Mills vs. State of Uttar Pradesh & Ors. - A Milesto...Ms Motilal Padampat Sugar Mills vs. State of Uttar Pradesh & Ors. - A Milesto...
Ms Motilal Padampat Sugar Mills vs. State of Uttar Pradesh & Ors. - A Milesto...ShrutiBose4
 
International Business Environments and Operations 16th Global Edition test b...
International Business Environments and Operations 16th Global Edition test b...International Business Environments and Operations 16th Global Edition test b...
International Business Environments and Operations 16th Global Edition test b...ssuserf63bd7
 
8447779800, Low rate Call girls in New Ashok Nagar Delhi NCR
8447779800, Low rate Call girls in New Ashok Nagar Delhi NCR8447779800, Low rate Call girls in New Ashok Nagar Delhi NCR
8447779800, Low rate Call girls in New Ashok Nagar Delhi NCRashishs7044
 
India Consumer 2024 Redacted Sample Report
India Consumer 2024 Redacted Sample ReportIndia Consumer 2024 Redacted Sample Report
India Consumer 2024 Redacted Sample ReportMintel Group
 
IoT Insurance Observatory: summary 2024
IoT Insurance Observatory:  summary 2024IoT Insurance Observatory:  summary 2024
IoT Insurance Observatory: summary 2024Matteo Carbone
 
8447779800, Low rate Call girls in Tughlakabad Delhi NCR
8447779800, Low rate Call girls in Tughlakabad Delhi NCR8447779800, Low rate Call girls in Tughlakabad Delhi NCR
8447779800, Low rate Call girls in Tughlakabad Delhi NCRashishs7044
 
Memorándum de Entendimiento (MoU) entre Codelco y SQM
Memorándum de Entendimiento (MoU) entre Codelco y SQMMemorándum de Entendimiento (MoU) entre Codelco y SQM
Memorándum de Entendimiento (MoU) entre Codelco y SQMVoces Mineras
 
Kenya Coconut Production Presentation by Dr. Lalith Perera
Kenya Coconut Production Presentation by Dr. Lalith PereraKenya Coconut Production Presentation by Dr. Lalith Perera
Kenya Coconut Production Presentation by Dr. Lalith Pereraictsugar
 
Case study on tata clothing brand zudio in detail
Case study on tata clothing brand zudio in detailCase study on tata clothing brand zudio in detail
Case study on tata clothing brand zudio in detailAriel592675
 
8447779800, Low rate Call girls in Uttam Nagar Delhi NCR
8447779800, Low rate Call girls in Uttam Nagar Delhi NCR8447779800, Low rate Call girls in Uttam Nagar Delhi NCR
8447779800, Low rate Call girls in Uttam Nagar Delhi NCRashishs7044
 
Contemporary Economic Issues Facing the Filipino Entrepreneur (1).pptx
Contemporary Economic Issues Facing the Filipino Entrepreneur (1).pptxContemporary Economic Issues Facing the Filipino Entrepreneur (1).pptx
Contemporary Economic Issues Facing the Filipino Entrepreneur (1).pptxMarkAnthonyAurellano
 
8447779800, Low rate Call girls in Kotla Mubarakpur Delhi NCR
8447779800, Low rate Call girls in Kotla Mubarakpur Delhi NCR8447779800, Low rate Call girls in Kotla Mubarakpur Delhi NCR
8447779800, Low rate Call girls in Kotla Mubarakpur Delhi NCRashishs7044
 
Call Us 📲8800102216📞 Call Girls In DLF City Gurgaon
Call Us 📲8800102216📞 Call Girls In DLF City GurgaonCall Us 📲8800102216📞 Call Girls In DLF City Gurgaon
Call Us 📲8800102216📞 Call Girls In DLF City Gurgaoncallgirls2057
 
Kenya’s Coconut Value Chain by Gatsby Africa
Kenya’s Coconut Value Chain by Gatsby AfricaKenya’s Coconut Value Chain by Gatsby Africa
Kenya’s Coconut Value Chain by Gatsby Africaictsugar
 
Global Scenario On Sustainable and Resilient Coconut Industry by Dr. Jelfina...
Global Scenario On Sustainable  and Resilient Coconut Industry by Dr. Jelfina...Global Scenario On Sustainable  and Resilient Coconut Industry by Dr. Jelfina...
Global Scenario On Sustainable and Resilient Coconut Industry by Dr. Jelfina...ictsugar
 

Último (20)

Cybersecurity Awareness Training Presentation v2024.03
Cybersecurity Awareness Training Presentation v2024.03Cybersecurity Awareness Training Presentation v2024.03
Cybersecurity Awareness Training Presentation v2024.03
 
PSCC - Capability Statement Presentation
PSCC - Capability Statement PresentationPSCC - Capability Statement Presentation
PSCC - Capability Statement Presentation
 
MAHA Global and IPR: Do Actions Speak Louder Than Words?
MAHA Global and IPR: Do Actions Speak Louder Than Words?MAHA Global and IPR: Do Actions Speak Louder Than Words?
MAHA Global and IPR: Do Actions Speak Louder Than Words?
 
8447779800, Low rate Call girls in Saket Delhi NCR
8447779800, Low rate Call girls in Saket Delhi NCR8447779800, Low rate Call girls in Saket Delhi NCR
8447779800, Low rate Call girls in Saket Delhi NCR
 
Ms Motilal Padampat Sugar Mills vs. State of Uttar Pradesh & Ors. - A Milesto...
Ms Motilal Padampat Sugar Mills vs. State of Uttar Pradesh & Ors. - A Milesto...Ms Motilal Padampat Sugar Mills vs. State of Uttar Pradesh & Ors. - A Milesto...
Ms Motilal Padampat Sugar Mills vs. State of Uttar Pradesh & Ors. - A Milesto...
 
International Business Environments and Operations 16th Global Edition test b...
International Business Environments and Operations 16th Global Edition test b...International Business Environments and Operations 16th Global Edition test b...
International Business Environments and Operations 16th Global Edition test b...
 
8447779800, Low rate Call girls in New Ashok Nagar Delhi NCR
8447779800, Low rate Call girls in New Ashok Nagar Delhi NCR8447779800, Low rate Call girls in New Ashok Nagar Delhi NCR
8447779800, Low rate Call girls in New Ashok Nagar Delhi NCR
 
India Consumer 2024 Redacted Sample Report
India Consumer 2024 Redacted Sample ReportIndia Consumer 2024 Redacted Sample Report
India Consumer 2024 Redacted Sample Report
 
IoT Insurance Observatory: summary 2024
IoT Insurance Observatory:  summary 2024IoT Insurance Observatory:  summary 2024
IoT Insurance Observatory: summary 2024
 
8447779800, Low rate Call girls in Tughlakabad Delhi NCR
8447779800, Low rate Call girls in Tughlakabad Delhi NCR8447779800, Low rate Call girls in Tughlakabad Delhi NCR
8447779800, Low rate Call girls in Tughlakabad Delhi NCR
 
Memorándum de Entendimiento (MoU) entre Codelco y SQM
Memorándum de Entendimiento (MoU) entre Codelco y SQMMemorándum de Entendimiento (MoU) entre Codelco y SQM
Memorándum de Entendimiento (MoU) entre Codelco y SQM
 
Kenya Coconut Production Presentation by Dr. Lalith Perera
Kenya Coconut Production Presentation by Dr. Lalith PereraKenya Coconut Production Presentation by Dr. Lalith Perera
Kenya Coconut Production Presentation by Dr. Lalith Perera
 
Case study on tata clothing brand zudio in detail
Case study on tata clothing brand zudio in detailCase study on tata clothing brand zudio in detail
Case study on tata clothing brand zudio in detail
 
8447779800, Low rate Call girls in Uttam Nagar Delhi NCR
8447779800, Low rate Call girls in Uttam Nagar Delhi NCR8447779800, Low rate Call girls in Uttam Nagar Delhi NCR
8447779800, Low rate Call girls in Uttam Nagar Delhi NCR
 
Japan IT Week 2024 Brochure by 47Billion (English)
Japan IT Week 2024 Brochure by 47Billion (English)Japan IT Week 2024 Brochure by 47Billion (English)
Japan IT Week 2024 Brochure by 47Billion (English)
 
Contemporary Economic Issues Facing the Filipino Entrepreneur (1).pptx
Contemporary Economic Issues Facing the Filipino Entrepreneur (1).pptxContemporary Economic Issues Facing the Filipino Entrepreneur (1).pptx
Contemporary Economic Issues Facing the Filipino Entrepreneur (1).pptx
 
8447779800, Low rate Call girls in Kotla Mubarakpur Delhi NCR
8447779800, Low rate Call girls in Kotla Mubarakpur Delhi NCR8447779800, Low rate Call girls in Kotla Mubarakpur Delhi NCR
8447779800, Low rate Call girls in Kotla Mubarakpur Delhi NCR
 
Call Us 📲8800102216📞 Call Girls In DLF City Gurgaon
Call Us 📲8800102216📞 Call Girls In DLF City GurgaonCall Us 📲8800102216📞 Call Girls In DLF City Gurgaon
Call Us 📲8800102216📞 Call Girls In DLF City Gurgaon
 
Kenya’s Coconut Value Chain by Gatsby Africa
Kenya’s Coconut Value Chain by Gatsby AfricaKenya’s Coconut Value Chain by Gatsby Africa
Kenya’s Coconut Value Chain by Gatsby Africa
 
Global Scenario On Sustainable and Resilient Coconut Industry by Dr. Jelfina...
Global Scenario On Sustainable  and Resilient Coconut Industry by Dr. Jelfina...Global Scenario On Sustainable  and Resilient Coconut Industry by Dr. Jelfina...
Global Scenario On Sustainable and Resilient Coconut Industry by Dr. Jelfina...
 

Irongate Global Strategy Fund

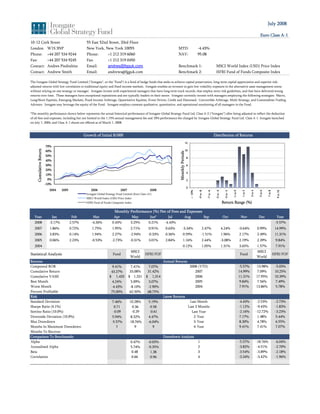
  • 1. July 2008 Euro Class A-1 10-12 Cork Street 55 East 52nd Street, 33rd Floor London W1S 3NP New York, New York 10055 MTD: -4.43% Phone: +44 207 534 9244 Phone: +1 212 319 6060 NAV: 95.08 Fax: +44 207 534 9245 Fax: +1 212 319 0450 Contact: Andres Piedrahita Email: andres@fgguk.com Benchmark 1: MSCI World Index (USD) Price Index Contact: Andrew Smith Email: andrews@fgguk.com Benchmark 2: HFRI Fund of Funds Composite Index The Irongate Global Strategy Fund Limited (quot;Irongatequot;, or the quot;Fundquot;) is a fund of hedge funds that seeks to achieve capital preservation, long-term capital appreciation and superior risk- adjusted returns with low correlation to traditional equity and fixed income markets. Irongate enables an investor to gain low volatility exposure to the alternative asset management arena without relying on one strategy or manager. Irongate invests with experienced managers that have long term track records, that employ strict risk guidelines, and that have delivered strong returns over time. These managers have exceptional reputations and are typically leaders in their sector. Irongate currently invests with managers employing the following strategies: Macro, Long/Short Equities, Emerging Markets, Fixed Income Arbitrage, Quantitative Equities, Event Driven, Credit and Distressed, Convertible Arbitrage, Multi-Strategy, and Commodities Trading Advisors. Irongate may leverage the equity of the Fund. Irongate employs constant qualitative, quantitative, and operational monitoring of all managers in the Fund. *The monthly performance shown below represents the actual historical performance of Irongate Global Strategy Fund Ltd. Class A-2 (“Irongate”) after being adjusted to reflect the deduction of all fees and expenses, including but not limited to the 1.15% annual management fee and 10% performance fee charged by Irongate Global Strategy Fund Ltd. Class A-1. Irongate launched on July 1, 2004, and Class A-1 shares are offered as of March 1, 2008. Growth of Initial $1000 Distribution of Returns 12 70% Cumulative Return 60% 10 Monthly Periods 50% 8 40% 30% 6 20% 4 10% 0% 2 -10% 0 2004 2005 2006 2007 2008 < -10% -9 to -8 -7 to -6 -5 to -4 -3 to -2 -1 to 0 1 to 2 3 to 4 5 to 6 7 to 8 9 to 10 Irongate Global Strategy Fund Limited (Euro Class-A1) MSCI World Index (USD) Price Index HFRI Fund of Funds Composite Index Return Range (%) Monthly Performance (%) Net of Fees and Expenses Year Jan Feb Mar Apr May Jun* Jul Aug Sep Oct Nov Dec Year 2008 -3.17% 2.57% -4.26% 0.43% 3.25% 0.21% -4.43% -5.57% 2007 1.86% 0.72% 1.75% 1.95% 2.71% 0.91% 0.63% -3.34% 2.47% 4.24% -0.64% 0.99% 14.99% 2006 3.83% 0.14% 1.94% 2.27% -2.94% -0.33% 0.36% 0.59% -1.51% 1.96% 2.17% 2.49% 11.31% 2005 0.06% 2.23% -0.53% -2.73% -0.31% 3.01% 2.84% 1.16% 2.44% -3.08% 2.19% 2.39% 9.84% 2004 0.12% 1.05% 1.31% 3.65% 1.57% 7.91% MSCI MSCI Statistical Analysis Fund HFRI FOF Fund HFRI FOF World World Returns Annual Returns Compound ROR 9.41% 7.41% 7.07% 2008-(YTD) -5.57% -13.98% -5.03% Cumulative Return 43.27% 33.08% 31.42% 2007 14.99% 7.09% 10.25% Cumulative VAMI $ 1,433 $ 1,331 $ 1,314 2006 11.31% 17.95% 10.39% Best Month 4.24% 5.09% 3.07% 2005 9.84% 7.56% 7.49% Worst Month -4.43% -8.10% -2.90% 2004 7.91% 13.86% 5.78% Percent Profitable 75.00% 62.50% 68.75% Risk Latest Returns Standard Deviation 7.46% 10.28% 5.19% Last Month -4.43% -2.53% -2.73% Sharpe Ratio (4.1%) 0.71 0.36 0.58 Last 3 Months -1.12% -9.43% -1.83% Sortino Ratio (10.0%) -0.09 -0.29 -0.61 Last Year -2.16% -12.72% -3.23% Downside Deviation (10.0%) 5.94% 8.32% 4.47% 2-Year 7.17% 1.48% 5.44% Max Drawdown -5.57% -18.76% -6.04% 3-Year 8.30% 4.78% 6.55% Months In Maximum Drawdown 7 9 9 4-Year 9.41% 7.41% 7.07% Months To Recover Comparison To Benchmarks Drawdown Analysis Alpha 0.47% -0.03% 1 -5.57% -18.76% -6.04% Annualized Alpha 5.74% -0.35% 2 -3.82% -4.51% -2.70% Beta 0.48 1.38 3 -3.54% -3.89% -2.18% Correlation 0.66 0.96 4 -3.34% -3.42% -1.96%
  • 2. July 2008 Euro Class A-1 Annualized Return Vs. Annualized Standard Deviation Allocation By Strategy 25% Convertible Arbitrage, 0.00% Credit and Distressed, 20% Multi-Strategy, 20.14% 26.05% Annualized Return 15% ####### Emerging Markets, 8.21% Commodities/ 10% Managed Futures, 3.25% Event-Driven, 5% 9.33% Quantitative Long/Short Equities, 3.32% Equity Hedge, 0% 16.74% 2% 4% 6% 8% 10% 12% Fixed Income Irongate Global Strategy Fund Limited (Euro Class-A1) Global Macro, Arbitrage, 6.34% MSCI World Index (USD) Price Index 6.62% HFRI Fund of Funds Composite Index Monthly Performance Attribution By Strategy YTD Performance Attribution By Strategy (contribution to monthly net performance) (contribution to YTD net performance) Quantitative Equities Quantitative Equities 0.13% 0.05% Convertible Arbitrage 0.00% Convertible Arbitrage 0.02% Long/Short Equity Hedge 0.01% Emerging Markets -0.10% Managed Futures (CTAs) -0.02% Fixed Income Arbitrage -0.10% Fixed Income Arbitrage -0.33% Global Macro -0.25% Emerging Markets -0.49% Event Driven -0.47% Credit and Distressed -0.57% Commodities/Managed Futures -0.50% Global Macro -0.86% Long/Short Equity Hedge -0.64% Event Driven -1.00% Multi-Strategy -0.97% -1.82% Multi-Strategy Credit and Distressed -1.45% -2.0% -1.5% -1.0% -0.5% 0.0% 0.5% 1.0% -1.7% -1.4% -1.1% -0.8% -0.5% -0.2% 0.1% Top Ten Holdings 7.00% 6.00% 5.00% 4.00% 3.42% 3.32% 2.83% 2.75% 2.73% 2.58% 2.55% 2.46% 2.45% 3.00% 2.33% 2.00% 1.00% 0.00% HARBINGER MADOFF MILLENNIUM PAULSON HEALTHCOR TIGER GLOBAL D.E. SHAW KING STREET KENSINGTON III FUND LTD ADVANTAGE COMPOSITE PTG USD0.01 Fund Information Fund Name: Irongate Global Strategy Fund Limited Assets Under Management: $2.31 Billion Manager Name: Fairfield Greenwich Advisors LLC Minimum Initial Investment: 100,000 Investment Manager: Fairfield Greenwich (UK) Limited Currencies: US$, Euro€, GBP₤ Investment Advisor: Union Bancaire Privée Management Fee 1.15% Administrator: Citco Fund Services (Europe) B.V. Performance Fee 10.00% Auditor: KPMG LLP High Water Mark: Yes Custodian: Union Bancaire Privée Redemptions Quarterly Legal Advisor (UK): Schulte Roth and Zabel Subscriptions Monthly Legal Advisor (Cayman): Stuarts Walker Hersant Notice: 65 Days Inception Date: 1-Jul-04 Lockup: 6 months Hard/6 months Soft (3% fee) Structure: Cayman Islands exempted company Reporting: Monthly NAV ISIN: KYG4948V1014
  • 3. IMPORTANT NOTICE Fund performance reflects the actual historical performance of Irongate Global Strategy Fund Ltd. Class A-2 (“Irongate”) after being adjusted to reflect the deduction of all fees and expenses, including but not limited to the 1.15% annual management fee and 10% performance fee charged by Irongate Global Strategy Fund Ltd. Class A-1. Irongate launched on March 1, 2003, and Class A-1 shares are offered as of March 1, 2008. This document does not constitute an offering of any security, product, service or fund, including interests in the Irongate Global Strategy Fund Limited (the “Fund”), which can only be made to qualified investors by the Fund’s Prospectus. This document is for informational purposes only and may not be relied upon by you in evaluating the merits of investing in the Fund. It is qualified in its entirety by the Prospectus and no offering of interests in the Fund may be made by any literature, advertising, or document in whatever form other than the Prospectus, which supersedes and may qualify, and differ from, the information and opinions contained herein. The Prospectus contains important information regarding the Fund's investment objectives, risks, fees, liquidity, and other matters of interest and should be carefully read prior to an investment in the Fund. There are no assurances that the stated investment objectives of the Fund will be met. The purchase of interests in the Fund is suitable only for qualified investors for whom an investment in the Fund does not constitute a complete investment program and who fully understand and are willing to assume the risks involved in the Fund’s investment program. The interests described herein will not be registered under the laws of any jurisdiction including the United States Securities Act of 1933 or the United States Investment Company Act of 1940, the laws of any state of the United States or the laws of any foreign jurisdiction and may not be offered or sold without compliance to applicable securities laws. Hedge funds (or funds of hedge funds): Often engage in leveraging and other speculative investment practices that may increase the risk of investment loss; Can be highly illiquid; Are not required to provide periodic pricing or valuation information to investors; May involve complex tax structures and delays in distributing important tax information; Are not subject to the same regulatory requirements as registered investment companies; and Often charge high fees. An investor could lose all or substantially all of his or her investment. Where securities are issued in a currency other than the investors’ currency of reference, changes in exchange rates may have an adverse effect on the value of the investment. Further, any number of conflicts of interest may exist in the context of the management and/or operation of any hedge fund. Securities are distributed by Fairfield Greenwich Limited, the Fund’s placement agent, and its subsidiaries: In the United States securities are offered through Fairfield Heathcliff Capital LLC (“FHC”), a broker-dealer and member FINRA and SIPC. FHC is an affiliate of the Fund's Investment Manager and Manager. Investment management services are offered by Fairfield Greenwich Advisors LLC. The Fund and the underlying managers of the Fund may employ leverage and the Fund's performance may be volatile. There is no secondary market for the investor’s interest in the Fund and none is expected to develop. There may be restrictions on transferring interests in the Fund. The Fund's fees and expenses may offset its trading profits. Unaffiliated placement agents may also place limited partnership interests of the Fund. Assets under management represent the leveraged amount, which is approximately 1.5x, although Fund guidelines permit leverage up to 100% of equity. The summary/prices/quotes/statistics in this document have been obtained from sources deemed to be reliable, but we do not guarantee their accuracy or completeness. Information contained herein is subject to change without notice. Past performance is not a guarantee of future results. This document is confidential and may not be reproduced or distributed without the prior written consent of Fairfield Greenwich Group. Fairfield Greenwich Group is the marketing name for the securities and investment advisory businesses of Fairfield Greenwich Limited and its subsidiaries worldwide. Additional information is available upon request. The index information is included merely to show the general trend in applicable markets in the periods indicated and is not intended to imply that the Fund was similar to the index either in composition or element of risk. It is not possible to invest in an index. The MSCI World Index is a free float-adjusted market capitalization index that is designed to measure global developed market equity performance. As of June 2006 it consisted of 23 developed market country indices. Hedge Fund Research Inc. (HFRI) Fund of Funds index is an equally-weighted, unmanaged index comprised of domestic and offshore hedge fund of funds. HFRI Indices are based on information self- reported by hedge fund managers that decide, on their own, at any time, whether or not they want to provide, or continue to provide, information to HFR Asset Management, L.L.C. Results for funds that go out of business are included in the index until the date that they cease operations. Therefore, these indices may not be complete or accurate representations of the hedge fund universe, and may be biased in several ways. YTD Performance Attribution By Strategy and Monthly Performance Attribution By Strategy is calculated on a net basis. The attribution of cash and cash equivalents, are allocated on a prorata basis to the nine strategies. The managers to whom the Fund allocates, some of which may be affiliated with the Fund's Investment Manager, generally charge a 2% management fee and a 20% performance fee, though this can vary.