Engineering materials (materials property chart)
•
2 gostaram•3,934 visualizações

structural materials properties chart. it has covered many different structural properties of most common engineering alloys and composite materials. it gives elastic modulus , yield, and densities and many more on engineering materials

Recomendados
Mais conteúdo relacionado
Mais procurados
Mais procurados (20)
Semelhante a Engineering materials (materials property chart)
Semelhante a Engineering materials (materials property chart) (20)
Mais de Hammad ur Rehman
Mais de Hammad ur Rehman (8)
Último
Último (20)
Engineering materials (materials property chart)
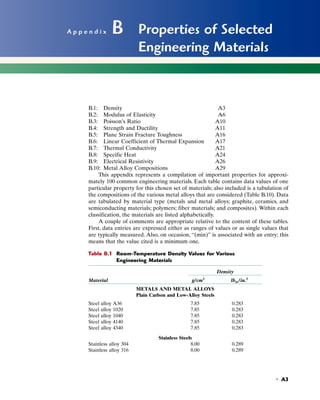
- 1. • A3 A p p e n d i x B Properties of Selected Engineering Materials B.1: Density A3 B.2: Modulus of Elasticity A6 B.3: Poisson’s Ratio A10 B.4: Strength and Ductility A11 B.5: Plane Strain Fracture Toughness A16 B.6: Linear Coefficient of Thermal Expansion A17 B.7: Thermal Conductivity A21 B.8: Specific Heat A24 B.9: Electrical Resistivity A26 B.10: Metal Alloy Compositions A29 This appendix represents a compilation of important properties for approxi- mately 100 common engineering materials. Each table contains data values of one particular property for this chosen set of materials; also included is a tabulation of the compositions of the various metal alloys that are considered (Table B.10). Data are tabulated by material type (metals and metal alloys; graphite, ceramics, and semiconducting materials; polymers; fiber materials; and composites). Within each classification, the materials are listed alphabetically. A couple of comments are appropriate relative to the content of these tables. First, data entries are expressed either as ranges of values or as single values that are typically measured. Also, on occasion, “(min)” is associated with an entry; this means that the value cited is a minimum one. Table B.1 Room-Temperature Density Values for Various Engineering Materials Density Material g/cm3 lbm/in.3 METALS AND METAL ALLOYS Plain Carbon and Low-Alloy Steels Steel alloy A36 7.85 0.283 Steel alloy 1020 7.85 0.283 Steel alloy 1040 7.85 0.283 Steel alloy 4140 7.85 0.283 Steel alloy 4340 7.85 0.283 Stainless Steels Stainless alloy 304 8.00 0.289 Stainless alloy 316 8.00 0.289 JWCL187_appB_A03-A30.qxd 11/14/09 5:35 AM Page A3
- 2. A4 • Appendix B / Properties of Selected Engineering Materials Table B.1 (Continued) Density Material g/cm3 lbm/in.3 Stainless alloy 405 7.80 0.282 Stainless alloy 440A 7.80 0.282 Stainless alloy 17-7PH 7.65 0.276 Cast Irons Gray irons • Grade G1800 7.30 0.264 • Grade G3000 7.30 0.264 • Grade G4000 7.30 0.264 Ductile irons • Grade 60-40-18 7.10 0.256 • Grade 80-55-06 7.10 0.256 • Grade 120-90-02 7.10 0.256 Aluminum Alloys Alloy 1100 2.71 0.0978 Alloy 2024 2.77 0.100 Alloy 6061 2.70 0.0975 Alloy 7075 2.80 0.101 Alloy 356.0 2.69 0.0971 Copper Alloys C11000 (electrolytic tough pitch) 8.89 0.321 C17200 (beryllium–copper) 8.25 0.298 C26000 (cartridge brass) 8.53 0.308 C36000 (free-cutting brass) 8.50 0.307 C71500 (copper–nickel, 30%) 8.94 0.323 C93200 (bearing bronze) 8.93 0.322 Magnesium Alloys Alloy AZ31B 1.77 0.0639 Alloy AZ91D 1.81 0.0653 Titanium Alloys Commercially pure (ASTM grade 1) 4.51 0.163 Alloy Ti–5Al–2.5Sn 4.48 0.162 Alloy Ti–6Al–4V 4.43 0.160 Precious Metals Gold (commercially pure) 19.32 0.697 Platinum (commercially pure) 21.45 0.774 Silver (commercially pure) 10.49 0.379 Refractory Metals Molybdenum (commercially pure) 10.22 0.369 Tantalum (commercially pure) 16.6 0.599 Tungsten (commercially pure) 19.3 0.697 Miscellaneous Nonferrous Alloys Nickel 200 8.89 0.321 Inconel 625 8.44 0.305 Monel 400 8.80 0.318 Haynes alloy 25 9.13 0.330 Invar 8.05 0.291 JWCL187_appB_A03-A30.qxd 11/3/09 1:35 PM Page A4
- 3. Appendix B / Properties of Selected Engineering Materials • A5 Table B.1 (Continued) Density Material g/cm3 lbm/in.3 Super invar 8.10 0.292 Kovar 8.36 0.302 Chemical lead 11.34 0.409 Antimonial lead (6%) 10.88 0.393 Tin (commercially pure) 7.17 0.259 Lead–tin solder (60Sn–40Pb) 8.52 0.308 Zinc (commercially pure) 7.14 0.258 Zirconium, reactor grade 702 6.51 0.235 GRAPHITE, CERAMICS, AND SEMICONDUCTING MATERIALS Aluminum oxide • 99.9% pure 3.98 0.144 • 96% pure 3.72 0.134 • 90% pure 3.60 0.130 Concrete 2.4 0.087 Diamond • Natural 3.51 0.127 • Synthetic 3.20–3.52 0.116–0.127 Gallium arsenide 5.32 0.192 Glass, borosilicate (Pyrex) 2.23 0.0805 Glass, soda–lime 2.5 0.0903 Glass-ceramic (Pyroceram) 2.60 0.0939 Graphite • Extruded 1.71 0.0616 • Isostatically molded 1.78 0.0643 Silica, fused 2.2 0.079 Silicon 2.33 0.0841 Silicon carbide • Hot pressed 3.3 0.119 • Sintered 3.2 0.116 Silicon nitride • Hot pressed 3.3 0.119 • Reaction bonded 2.7 0.0975 • Sintered 3.3 0.119 Zirconia, 3 mol% Y2O3, sintered 6.0 0.217 POLYMERS Elastomers • Butadiene-acrylonitrile (nitrile) 0.98 0.0354 • Styrene-butadiene (SBR) 0.94 0.0339 • Silicone 1.1–1.6 0.040–0.058 Epoxy 1.11–1.40 0.0401–0.0505 Nylon 6,6 1.14 0.0412 Phenolic 1.28 0.0462 Poly(butylene terephthalate) (PBT) 1.34 0.0484 Polycarbonate (PC) 1.20 0.0433 Polyester (thermoset) 1.04–1.46 0.038–0.053 Polyetheretherketone (PEEK) 1.31 0.0473 Polyethylene • Low density (LDPE) 0.925 0.0334 • High density (HDPE) 0.959 0.0346 JWCL187_appB_A03-A30.qxd 11/3/09 1:35 PM Page A5
- 4. A6 • Appendix B / Properties of Selected Engineering Materials Table B.1 (Continued) Density Material g/cm3 lbm/in.3 • Ultrahigh molecular weight (UHMWPE) 0.94 0.0339 Poly(ethylene terephthalate) (PET) 1.35 0.0487 Poly(methyl methacrylate) (PMMA) 1.19 0.0430 Polypropylene (PP) 0.905 0.0327 Polystyrene (PS) 1.05 0.0379 Polytetrafluoroethylene (PTFE) 2.17 0.0783 Poly(vinyl chloride) (PVC) 1.30–1.58 0.047–0.057 FIBER MATERIALS Aramid (Kevlar 49) 1.44 0.0520 Carbon (PAN precursor) • Standard modulus 1.78 0.0643 • Intermediate modulus 1.78 0.0643 • High modulus 1.81 0.0653 E-glass 2.58 0.0931 COMPOSITE MATERIALS Aramid fibers–epoxy matrix (Vf ϭ 0.60) 1.4 0.050 High-modulus carbon fibers–epoxy matrix (Vf ϭ 0.60) 1.7 0.061 E-glass fibers–epoxy matrix (Vf ϭ 0.60) 2.1 0.075 Wood • Douglas fir (12% moisture) 0.46–0.50 0.017–0.018 • Red oak (12% moisture) 0.61–0.67 0.022–0.024 Sources: ASM Handbooks, Volumes 1 and 2, Engineered Materials Handbook, Volume 4, Metals Handbook: Properties and Selection: Nonferrous Alloys and Pure Metals, Vol. 2, 9th edition, and Advanced Materials & Processes, Vol. 146, No. 4, ASM International, Materials Park, OH; Modern Plastics Encyclopedia ’96, The McGraw-Hill Companies, New York, NY; R. F. Floral and S. T. Peters, “Composite Structures and Technologies,” tutorial notes, 1989; and manufacturers’ technical data sheets. Table B.2 Room-Temperature Modulus of Elasticity Values for Various Engineering Materials Modulus of Elasticity Material GPa 106 psi METALS AND METAL ALLOYS Plain Carbon and Low-Alloy Steels Steel alloy A36 207 30 Steel alloy 1020 207 30 Steel alloy 1040 207 30 Steel alloy 4140 207 30 Steel alloy 4340 207 30 Stainless Steels Stainless alloy 304 193 28 Stainless alloy 316 193 28 JWCL187_appB_A03-A30.qxd 11/3/09 1:35 PM Page A6
- 5. Appendix B / Properties of Selected Engineering Materials • A7 Stainless alloy 405 200 29 Stainless alloy 440A 200 29 Stainless alloy 17-7PH 204 29.5 Cast Irons Gray irons • Grade G1800 66–97a 9.6–14a • Grade G3000 90–113a 13.0–16.4a • Grade G4000 110–138a 16–20a Ductile irons • Grade 60-40-18 169 24.5 • Grade 80-55-06 168 24.4 • Grade 120-90-02 164 23.8 Aluminum Alloys Alloy 1100 69 10 Alloy 2024 72.4 10.5 Alloy 6061 69 10 Alloy 7075 71 10.3 Alloy 356.0 72.4 10.5 Copper Alloys C11000 (electrolytic tough pitch) 115 16.7 C17200 (beryllium–copper) 128 18.6 C26000 (cartridge brass) 110 16 C36000 (free-cutting brass) 97 14 C71500 (copper–nickel, 30%) 150 21.8 C93200 (bearing bronze) 100 14.5 Magnesium Alloys Alloy AZ31B 45 6.5 Alloy AZ91D 45 6.5 Titanium Alloys Commercially pure (ASTM grade 1) 103 14.9 Alloy Ti–5Al–2.5Sn 110 16 Alloy Ti–6Al–4V 114 16.5 Precious Metals Gold (commercially pure) 77 11.2 Platinum (commercially pure) 171 24.8 Silver (commercially pure) 74 10.7 Refractory Metals Molybdenum (commercially pure) 320 46.4 Tantalum (commercially pure) 185 27 Tungsten (commercially pure) 400 58 Miscellaneous Nonferrous Alloys Nickel 200 204 29.6 Inconel 625 207 30 Monel 400 180 26 Haynes alloy 25 236 34.2 Invar 141 20.5 Super invar 144 21 Table B.2 (Continued) Modulus of Elasticity Material GPa 106 psi JWCL187_appB_A03-A30.qxd 11/3/09 1:35 PM Page A7
- 6. A8 • Appendix B / Properties of Selected Engineering Materials Kovar 207 30 Chemical lead 13.5 2 Tin (commercially pure) 44.3 6.4 Lead–tin solder (60Sn–40Pb) 30 4.4 Zinc (commercially pure) 104.5 15.2 Zirconium, reactor grade 702 99.3 14.4 GRAPHITE, CERAMICS, AND SEMICONDUCTING MATERIALS Aluminum oxide • 99.9% pure 380 55 • 96% pure 303 44 • 90% pure 275 40 Concrete 25.4–36.6a 3.7–5.3a Diamond • Natural 700–1200 102–174 • Synthetic 800–925 116–134 Gallium arsenide, single crystal • In the ͗100͘ direction 85 12.3 • In the ͗110͘ direction 122 17.7 • In the ͗111͘ direction 142 20.6 Glass, borosilicate (Pyrex) 70 10.1 Glass, soda–lime 69 10 Glass-ceramic (Pyroceram) 120 17.4 Graphite • Extruded 11 1.6 • Isostatically molded 11.7 1.7 Silica, fused 73 10.6 Silicon, single crystal • In the ͗100͘ direction 129 18.7 • In the ͗110͘ direction 168 24.4 • In the ͗111͘ direction 187 27.1 Silicon carbide • Hot pressed 207–483 30–70 • Sintered 207–483 30–70 Silicon nitride • Hot pressed 304 44.1 • Reaction bonded 304 44.1 • Sintered 304 44.1 Zirconia, 3 mol% Y2O3 205 30 POLYMERS Elastomers • Butadiene-acrylonitrile (nitrile) 0.0034b 0.00049b • Styrene-butadiene (SBR) 0.002–0.010b 0.0003–0.0015b Epoxy 2.41 0.35 Nylon 6,6 1.59–3.79 0.230–0.550 Phenolic 2.76–4.83 0.40–0.70 Poly(butylene terephthalate) (PBT) 1.93–3.00 0.280–0.435 Polycarbonate (PC) 2.38 0.345 Polyester (thermoset) 2.06–4.41 0.30–0.64 Polyetheretherketone (PEEK) 1.10 0.16 Table B.2 (Continued) Modulus of Elasticity Material GPa 106 psi JWCL187_appB_A03-A30.qxd 11/3/09 1:35 PM Page A8
- 7. Appendix B / Properties of Selected Engineering Materials • A9 Polyethylene • Low density (LDPE) 0.172–0.282 0.025–0.041 • High density (HDPE) 1.08 0.157 • Ultrahigh molecular weight (UHMWPE) 0.69 0.100 Poly(ethylene terephthalate) (PET) 2.76–4.14 0.40–0.60 Poly(methyl methacrylate) (PMMA) 2.24–3.24 0.325–0.470 Polypropylene (PP) 1.14–1.55 0.165–0.225 Polystyrene (PS) 2.28–3.28 0.330–0.475 Polytetrafluoroethylene (PTFE) 0.40–0.55 0.058–0.080 Poly(vinyl chloride) (PVC) 2.41–4.14 0.35–0.60 FIBER MATERIALS Aramid (Kevlar 49) 131 19 Carbon (PAN precursor) • Standard modulus 230 33.4 • Intermediate modulus 285 41.3 • High modulus 400 58 E-glass 72.5 10.5 COMPOSITE MATERIALS Aramid fibers–epoxy matrix (Vf ϭ 0.60) Longitudinal 76 11 Transverse 5.5 0.8 High-modulus carbon fibers–epoxy matrix (Vf ϭ 0.60) Longitudinal 220 32 Transverse 6.9 1.0 E-glass fibers–epoxy matrix (Vf ϭ 0.60) Longitudinal 45 6.5 Transverse 12 1.8 Wood • Douglas fir (12% moisture) Parallel to grain 10.8–13.6c 1.57–1.97c Perpendicular to grain 0.54–0.68c 0.078–0.10c • Red oak (12% moisture) Parallel to grain 11.0–14.1c 1.60–2.04c Perpendicular to grain 0.55–0.71c 0.08–0.10c a Secant modulus taken at 25% of ultimate strength. b Modulus taken at 100% elongation. c Measured in bending. Sources: ASM Handbooks, Volumes 1 and 2, Engineered Materials Handbooks, Volumes 1 and 4, Metals Handbook: Properties and Selection: Nonferrous Alloys and Pure Metals, Vol. 2, 9th edition, and Advanced Materials & Processes, Vol. 146, No. 4, ASM International, Materials Park, OH; Modern Plastics Encyclopedia ’96, The McGraw-Hill Companies, New York, NY; R. F. Floral and S. T. Peters, “Composite Structures and Technologies,” tutorial notes, 1989; and manufacturers’ technical data sheets. Table B.2 (Continued) Modulus of Elasticity Material GPa 106 psi JWCL187_appB_A03-A30.qxd 11/14/09 5:35 AM Page A9
- 8. A10 • Appendix B / Properties of Selected Engineering Materials Poisson’s Material Ratio METALS AND METAL ALLOYS Plain Carbon and Low-Alloy Steels Steel alloy A36 0.30 Steel alloy 1020 0.30 Steel alloy 1040 0.30 Steel alloy 4140 0.30 Steel alloy 4340 0.30 Stainless Steels Stainless alloy 304 0.30 Stainless alloy 316 0.30 Stainless alloy 405 0.30 Stainless alloy 440A 0.30 Stainless alloy 17-7PH 0.30 Cast Irons Gray irons • Grade G1800 0.26 • Grade G3000 0.26 • Grade G4000 0.26 Ductile irons • Grade 60-40-18 0.29 • Grade 80-55-06 0.31 • Grade 120-90-02 0.28 Aluminum Alloys Alloy 1100 0.33 Alloy 2024 0.33 Alloy 6061 0.33 Alloy 7075 0.33 Alloy 356.0 0.33 Copper Alloys C11000 (electrolytic tough pitch) 0.33 C17200 (beryllium–copper) 0.30 C26000 (cartridge brass) 0.35 C36000 (free-cutting brass) 0.34 C71500 (copper–nickel, 30%) 0.34 C93200 (bearing bronze) 0.34 Magnesium Alloys Alloy AZ31B 0.35 Alloy AZ91D 0.35 Titanium Alloys Commercially pure (ASTM grade 1) 0.34 Alloy Ti–5Al–2.5Sn 0.34 Alloy Ti–6Al–4V 0.34 Precious Metals Gold (commercially pure) 0.42 Platinum (commercially pure) 0.39 Silver (commercially pure) 0.37 Poisson’s Material Ratio Refractory Metals Molybdenum (commercially pure) 0.32 Tantalum (commercially pure) 0.35 Tungsten (commercially pure) 0.28 Miscellaneous Nonferrous Alloys Nickel 200 0.31 Inconel 625 0.31 Monel 400 0.32 Chemical lead 0.44 Tin (commercially pure) 0.33 Zinc (commercially pure) 0.25 Zirconium, reactor grade 702 0.35 GRAPHITE, CERAMICS, AND SEMICONDUCTING MATERIALS Aluminum oxide • 99.9% pure 0.22 • 96% pure 0.21 • 90% pure 0.22 Concrete 0.20 Diamond • Natural 0.10–0.30 • Synthetic 0.20 Gallium arsenide • ͗100͘ orientation 0.30 Glass, borosilicate (Pyrex) 0.20 Glass, soda–lime 0.23 Glass-ceramic (Pyroceram) 0.25 Silica, fused 0.17 Silicon • ͗100͘ orientation 0.28 • ͗111͘ orientation 0.36 Silicon carbide • Hot pressed 0.17 • Sintered 0.16 Silicon nitride • Hot pressed 0.30 • Reaction bonded 0.22 • Sintered 0.28 Zirconia, 3 mol% Y2O3 0.31 POLYMERS Nylon 6,6 0.39 Polycarbonate (PC) 0.36 Polyethylene • Low density (LDPE) 0.33–0.40 • High density (HDPE) 0.46 Poly(ethylene terephthalate) (PET) 0.33 Poly(methyl methacrylate) (PMMA) 0.37-0.44 Polypropylene (PP) 0.40 Table B.3 Room-Temperature Poisson’s Ratio Values for Various Engineering Materials JWCL187_appB_A03-A30.qxd 11/3/09 1:35 PM Page A10
- 9. Appendix B / Properties of Selected Engineering Materials • A11 Table B.3 (Continued) Sources: ASM Handbooks, Volumes 1 and 2, and Engineered Materials Handbooks, Volumes 1 and 4, ASM International, Materials Park, OH; R. F. Floral and S. T. Peters, “Composite Structures and Technologies,” tutorial notes, 1989; and manufacturers’ technical data sheets. Polystyrene (PS) 0.33 Polytetrafluoroethylene (PTFE) 0.46 Poly(vinyl chloride) (PVC) 0.38 FIBER MATERIALS E–glass 0.22 COMPOSITE MATERIALS Aramid fibers–epoxy matrix (Vf ϭ 0.6) 0.34 High-modulus carbon fibers–epoxy matrix (Vf ϭ 0.6) 0.25 E-glass fibers–epoxy matrix (Vf ϭ 0.6) 0.19 Yield Tensile Strength Strength Percent Material/Condition (MPa [ksi]) (MPa [ksi]) Elongation METALS AND METAL ALLOYS Plain Carbon and Low-Alloy Steels Steel alloy A36 • Hot rolled 220–250 (32–36) 400–500 (58–72.5) 23 Steel alloy 1020 • Hot rolled 210 (30) (min) 380 (55) (min) 25 (min) • Cold drawn 350 (51) (min) 420 (61) (min) 15 (min) • Annealed (@ 870ЊC) 295 (42.8) 395 (57.3) 36.5 • Normalized (@ 925ЊC) 345 (50.3) 440 (64) 38.5 Steel alloy 1040 • Hot rolled 290 (42) (min) 520 (76) (min) 18 (min) • Cold drawn 490 (71) (min) 590 (85) (min) 12 (min) • Annealed (@ 785ЊC) 355 (51.3) 520 (75.3) 30.2 • Normalized (@ 900ЊC) 375 (54.3) 590 (85) 28.0 Steel alloy 4140 • Annealed (@ 815ЊC) 417 (60.5) 655 (95) 25.7 • Normalized (@ 870ЊC) 655 (95) 1020 (148) 17.7 • Oil-quenched and tempered (@ 315ЊC) 1570 (228) 1720 (250) 11.5 Steel alloy 4340 • Annealed (@ 810ЊC) 472 (68.5) 745 (108) 22 • Normalized (@ 870ЊC) 862 (125) 1280 (185.5) 12.2 • Oil-quenched and tempered (@ 315ЊC) 1620 (235) 1760 (255) 12 Stainless Steels Stainless alloy 304 • Hot finished and annealed 205 (30) (min) 515 (75) (min) 40 (min) • Cold worked ( hard) 515 (75) (min) 860 (125) (min) 10 (min) Stainless alloy 316 • Hot finished and annealed 205 (30) (min) 515 (75) (min) 40 (min) • Cold drawn and annealed 310 (45) (min) 620 (90) (min) 30 (min) Stainless alloy 405 • Annealed 170 (25) 415 (60) 20 1 4 Table B.4 Typical Room-Temperature Yield Strength, Tensile Strength, and Ductility (Percent Elongation) Values for Various Engineering Materials Poisson’s Material Ratio Poisson’s Material Ratio JWCL187_appB_A03-A30.qxd 11/21/09 12:44 AM Page A11
- 10. A12 • Appendix B / Properties of Selected Engineering Materials Stainless alloy 440A • Annealed 415 (60) 725 (105) 20 • Tempered (@ 315ЊC) 1650 (240) 1790 (260) 5 Stainless alloy 17-7PH • Cold rolled 1210 (175) (min) 1380 (200) (min) 1 (min) • Precipitation hardened (@ 510ЊC) 1310 (190) (min) 1450 (210) (min) 3.5 (min) Cast Irons Gray irons • Grade G1800 (as cast) — 124 (18) (min) — • Grade G3000 (as cast) — 207 (30) (min) — • Grade G4000 (as cast) — 276 (40) (min) — Ductile irons • Grade 60-40-18 (annealed) 276 (40) (min) 414 (60) (min) 18 (min) • Grade 80-55-06 (as cast) 379 (55) (min) 552 (80) (min) 6 (min) • Grade 120-90-02 (oil quenched and tempered) 621 (90) (min) 827 (120) (min) 2 (min) Aluminum Alloys Alloy 1100 • Annealed (O temper) 34 (5) 90 (13) 40 • Strain hardened (H14 temper) 117 (17) 124 (18) 15 Alloy 2024 • Annealed (O temper) 75 (11) 185 (27) 20 • Heat-treated and aged (T3 temper) 345 (50) 485 (70) 18 • Heat-treated and aged (T351 temper) 325 (47) 470 (68) 20 Alloy 6061 • Annealed (O temper) 55 (8) 124 (18) 30 • Heat-treated and aged (T6 and T651 tempers) 276 (40) 310 (45) 17 Alloy 7075 • Annealed (O temper) 103 (15) 228 (33) 17 • Heat-treated and aged (T6 temper) 505 (73) 572 (83) 11 Alloy 356.0 • As cast 124 (18) 164 (24) 6 • Heat-treated and aged (T6 temper) 164 (24) 228 (33) 3.5 Copper Alloys C11000 (electrolytic tough pitch) • Hot rolled 69 (10) 220 (32) 45 • Cold worked (H04 temper) 310 (45) 345 (50) 12 C17200 (beryllium–copper) • Solution heat-treated 195–380 (28–55) 415–540 (60–78) 35–60 • Solution heat-treated and aged (@ 330ЊC) 965–1205 (140–175) 1140–1310 (165–190) 4–10 C26000 (cartridge brass) • Annealed 75–150 (11–22) 300–365 (43.5–53.0) 54–68 • Cold worked (H04 temper) 435 (63) 525 (76) 8 C36000 (free-cutting brass) • Annealed 125 (18) 340 (49) 53 • Cold worked (H02 temper) 310 (45) 400 (58) 25 C71500 (copper–nickel, 30%) • Hot rolled 140 (20) 380 (55) 45 • Cold worked (H80 temper) 545 (79) 580 (84) 3 Table B.4 (Continued) Yield Tensile Strength Strength Percent Material/Condition (MPa [ksi]) (MPa [ksi]) Elongation JWCL187_appB_A03-A30.qxd 11/3/09 1:35 PM Page A12
- 11. Appendix B / Properties of Selected Engineering Materials • A13 C93200 (bearing bronze) • Sand cast 125 (18) 240 (35) 20 Magnesium Alloys Alloy AZ31B • Rolled 220 (32) 290 (42) 15 • Extruded 200 (29) 262 (38) 15 Alloy AZ91D • As cast 97–150 (14–22) 165–230 (24–33) 3 Titanium Alloys Commercially pure (ASTM grade 1) • Annealed 170 (25) (min) 240 (35) (min) 24 Alloy Ti–5Al–2.5Sn • Annealed 760 (110) (min) 790 (115) (min) 16 Alloy Ti–6Al–4V • Annealed 830 (120) (min) 900 (130) (min) 14 • Solution heat-treated and aged 1103 (160) 1172 (170) 10 Precious Metals Gold (commercially pure) • Annealed nil 130 (19) 45 • Cold worked (60% reduction) 205 (30) 220 (32) 4 Platinum (commercially pure) • Annealed Ͻ13.8 (2) 125–165 (18–24) 30–40 • Cold worked (50%) — 205–240 (30–35) 1–3 Silver (commercially pure) • Annealed — 170 (24.6) 44 • Cold worked (50%) — 296 (43) 3.5 Refractory Metals Molybdenum (commercially pure) 500 (72.5) 630 (91) 25 Tantalum (commercially pure) 165 (24) 205 (30) 40 Tungsten (commercially pure) 760 (110) 960 (139) 2 Miscellaneous Nonferrous Alloys Nickel 200 (annealed) 148 (21.5) 462 (67) 47 Inconel 625 (annealed) 517 (75) 930 (135) 42.5 Monel 400 (annealed) 240 (35) 550 (80) 40 Haynes alloy 25 445 (65) 970 (141) 62 Invar (annealed) 276 (40) 517 (75) 30 Super invar (annealed) 276 (40) 483 (70) 30 Kovar (annealed) 276 (40) 517 (75) 30 Chemical lead 6–8 (0.9–1.2) 16–19 (2.3–2.7) 30–60 Antimonial lead (6%) (chill cast) — 47.2 (6.8) 24 Tin (commercially pure) 11 (1.6) — 57 Lead–tin solder (60Sn–40Pb) — 52.5 (7.6) 30–60 Zinc (commercially pure) • Hot rolled (anisotropic) — 134–159 (19.4–23.0) 50–65 • Cold rolled (anisotropic) — 145–186 (21–27) 40–50 Zirconium, reactor grade 702 • Cold worked and annealed 207 (30) (min) 379 (55) (min) 16 (min) Table B.4 (Continued) Yield Tensile Strength Strength Percent Material/Condition (MPa [ksi]) (MPa [ksi]) Elongation JWCL187_appB_A03-A30.qxd 11/3/09 1:35 PM Page A13
- 12. A14 • Appendix B / Properties of Selected Engineering Materials GRAPHITE, CERAMICS, AND SEMICONDUCTING MATERIALSa Aluminum oxide • 99.9% pure — 282–551 (41–80) — • 96% pure — 358 (52) — • 90% pure — 337 (49) — Concreteb — 37.3–41.3 (5.4–6.0) — Diamond • Natural — 1050 (152) — • Synthetic — 800–1400 (116–203) — Gallium arsenide • {100} orientation, polished surface — 66 (9.6)c — • {100} orientation, as-cut surface — 57 (8.3)c — Glass, borosilicate (Pyrex) — 69 (10) — Glass, soda–lime — 69 (10) — Glass-ceramic (Pyroceram) — 123–370 (18–54) — Graphite • Extruded (with the grain direction) — 13.8–34.5 (2.0–5.0) — • Isostatically molded — 31–69 (4.5–10) — Silica, fused — 104 (15) — Silicon • {100} orientation, as-cut surface — 130 (18.9) — • {100} orientation, laser scribed — 81.8 (11.9) — Silicon carbide • Hot pressed — 230–825 (33–120) — • Sintered — 96–520 (14–75) — Silicon nitride • Hot pressed — 700–1000 (100–150) — • Reaction bonded — 250–345 (36–50) — • Sintered — 414–650 (60–94) — Zirconia, 3 mol% Y2O3 (sintered) — 800–1500 (116–218) — POLYMERS Elastomers • Butadiene-acrylonitrile (nitrile) — 6.9–24.1 (1.0–3.5) 400–600 • Styrene-butadiene (SBR) — 12.4–20.7 (1.8–3.0) 450–500 • Silicone — 10.3 (1.5) 100–800 Epoxy — 27.6–90.0 (4.0–13) 3–6 Nylon 6,6 • Dry, as molded 55.1–82.8 (8–12) 94.5 (13.7) 15–80 • 50% relative humidity 44.8–58.6 (6.5–8.5) 75.9 (11) 150–300 Phenolic — 34.5–62.1 (5.0–9.0) 1.5–2.0 Poly(butylene terephthalate) (PBT) 56.6–60.0 (8.2–8.7) 56.6–60.0 (8.2–8.7) 50–300 Polycarbonate (PC) 62.1 (9) 62.8–72.4 (9.1–10.5) 110–150 Polyester (thermoset) — 41.4–89.7 (6.0–13.0) Ͻ2.6 Polyetheretherketone (PEEK) 91 (13.2) 70.3–103 (10.2–15.0) 30–150 Polyethylene • Low density (LDPE) 9.0–14.5 (1.3–2.1) 8.3–31.4 (1.2–4.55) 100–650 • High density (HDPE) 26.2–33.1 (3.8–4.8) 22.1–31.0 (3.2–4.5) 10–1200 • Ultrahigh molecular weight (UHMWPE) 21.4–27.6 (3.1–4.0) 38.6–48.3 (5.6–7.0) 350–525 Poly(ethylene terephthalate) (PET) 59.3 (8.6) 48.3–72.4 (7.0–10.5) 30–300 Table B.4 (Continued) Yield Tensile Strength Strength Percent Material/Condition (MPa [ksi]) (MPa [ksi]) Elongation JWCL187_appB_A03-A30.qxd 11/3/09 1:35 PM Page A14
- 13. Appendix B / Properties of Selected Engineering Materials • A15 Poly(methyl methacrylate) (PMMA) 53.8–73.1 (7.8–10.6) 48.3–72.4 (7.0–10.5) 2.0–5.5 Polypropylene (PP) 31.0–37.2 (4.5–5.4) 31.0–41.4 (4.5–6.0) 100–600 Polystyrene (PS) 25.0–69.0 (3.63–10.0) 35.9–51.7 (5.2–7.5) 1.2–2.5 Polytetrafluoroethylene (PTFE) 13.8–15.2 (2.0–2.2) 20.7–34.5 (3.0–5.0) 200–400 Poly(vinyl chloride) (PVC) 40.7–44.8 (5.9–6.5) 40.7–51.7 (5.9–7.5) 40–80 FIBER MATERIALS Aramid (Kevlar 49) — 3600–4100 (525–600) 2.8 Carbon (PAN precursor) • Standard modulus (longitudinal) — 3800–4200 (550–610) 2 • Intermediate modulus (longitudinal) — 4650–6350 (675–920) 1.8 • High modulus (longitudinal) — 2500–4500 (360–650) 0.6 E-glass — 3450 (500) 4.3 COMPOSITE MATERIALS Aramid fibers–epoxy matrix (aligned, Vf ϭ 0.6) • Longitudinal direction — 1380 (200) 1.8 • Transverse direction — 30 (4.3) 0.5 High-modulus carbon fibers–epoxy matrix (aligned, Vf ϭ 0.6) • Longitudinal direction — 760 (110) 0.3 • Transverse direction — 28 (4) 0.4 E-glass fibers–epoxy matrix (aligned, Vf ϭ 0.6) • Longitudinal direction — 1020 (150) 2.3 • Transverse direction — 40 (5.8) 0.4 Wood • Douglas fir (12% moisture) Parallel to grain — 108 (15.6) — Perpendicular to grain — 2.4 (0.35) — • Red oak (12% moisture) Parallel to grain — 112 (16.3) — Perpendicular to grain — 7.2 (1.05) — a The strength of graphite, ceramics, and semiconducting materials is taken as flexural strength. b The strength of concrete is measured in compression. c Flexural strength value at 50% fracture probability. Sources: ASM Handbooks, Volumes 1 and 2, Engineered Materials Handbooks, Volumes 1 and 4, Metals Handbook: Properties and Selection: Nonferrous Alloys and Pure Metals, Vol. 2, 9th edition, Advanced Materials & Processes, Vol. 146, No. 4, and Materials & Processing Databook (1985), ASM International, Materials Park, OH; Modern Plastics Encyclopedia ’96, The McGraw-Hill Companies, New York, NY; R. F. Floral and S. T. Peters, “Composite Structures and Technologies,” tutorial notes, 1989; and manufacturers’ technical data sheets. Table B.4 (Continued) Yield Tensile Strength Strength Percent Material/Condition (MPa [ksi]) (MPa [ksi]) Elongation JWCL187_appB_A03-A30.qxd 11/3/09 1:35 PM Page A15
- 14. A16 • Appendix B / Properties of Selected Engineering Materials Table B.5 Room-Temperature Plane Strain Fracture Toughness and Strength Values for Various Engineering Materials Fracture Toughness Strengtha Material (MPa) METALS AND METAL ALLOYS Plain Carbon and Low-Alloy Steels Steel alloy 1040 54.0 49.0 260 Steel alloy 4140 • Tempered @ 370ЊC 55–65 50–59 1375–1585 • Tempered @ 482ЊC 75–93 68.3–84.6 1100–1200 Steel alloy 4340 • Tempered @ 260ЊC 50.0 45.8 1640 • Tempered @ 425ЊC 87.4 80.0 1420 Stainless Steels Stainless alloy 17-7PH • Precipitation hardened @ 510ЊC 76 69 1310 Aluminum Alloys Alloy 2024-T3 44 40 345 Alloy 7075-T651 24 22 495 Magnesium Alloys Alloy AZ31B • Extruded 28.0 25.5 200 Titanium Alloys Alloy Ti–5Al–2.5Sn • Air cooled 71.4 65.0 876 Alloy Ti–6Al–4V • Equiaxed grains 44–66 40–60 910 GRAPHITE, CERAMICS, AND SEMICONDUCTING MATERIALS Aluminum oxide • 99.9% pure 4.2–5.9 3.8–5.4 282–551 • 96% pure 3.85–3.95 3.5–3.6 358 Concrete 0.2–1.4 0.18–1.27 — Diamond • Natural 3.4 3.1 1050 • Synthetic 6.0–10.7 5.5–9.7 800–1400 Gallium arsenide • In the {100} orientation 0.43 0.39 66 • In the {110} orientation 0.31 0.28 — • In the {111} orientation 0.45 0.41 — Glass, borosilicate (Pyrex) 0.77 0.70 69 Glass, soda–lime 0.75 0.68 69 Glass-ceramic (Pyroceram) 1.6–2.1 1.5–1.9 123–370 Silica, fused 0.79 0.72 104 Silicon • In the {100} orientation 0.95 0.86 — • In the {110} orientation 0.90 0.82 — • In the {111} orientation 0.82 0.75 — Silicon carbide • Hot pressed 4.8–6.1 4.4–5.6 230–825 • Sintered 4.8 4.4 96–520 ksi1in.MPa1m JWCL187_appB_A03-A30.qxd 11/3/09 1:35 PM Page A16
- 15. Appendix B / Properties of Selected Engineering Materials • A17 Silicon nitride • Hot pressed 4.1–6.0 3.7–5.5 700–1000 • Reaction bonded 3.6 3.3 250–345 • Sintered 5.3 4.8 414–650 Zirconia, 3 mol% Y2O3 7.0–12.0 6.4–10.9 800–1500 POLYMERS Epoxy 0.6 0.55 — Nylon 6,6 2.5–3.0 2.3–2.7 44.8–58.6 Polycarbonate (PC) 2.2 2.0 62.1 Polyester (thermoset) 0.6 0.55 — Poly(ethylene terephthalate) (PET) 5.0 4.6 59.3 Poly(methyl methacrylate) (PMMA) 0.7–1.6 0.6–1.5 53.8–73.1 Polypropylene (PP) 3.0–4.5 2.7–4.1 31.0–37.2 Polystyrene (PS) 0.7–1.1 0.6–1.0 — Poly(vinyl chloride) (PVC) 2.0–4.0 1.8–3.6 40.7–44.8 a For metal alloys and polymers, strength is taken as yield strength; for ceramic materials, flexural strength is used. Sources: ASM Handbooks, Volumes 1 and 19, Engineered Materials Handbooks, Volumes 2 and 4, and Advanced Materials & Processes, Vol. 137, No. 6, ASM International, Materials Park, OH. Table B.5 (Continued) Fracture Toughness Strengtha Material (MPa)ksi1in.MPa1m Table B.6 Room-Temperature Linear Coefficient of Thermal Expansion Values for Various Engineering Materials Coefficient of Thermal Expansion Material 10Ϫ6 (ЊC)Ϫ1 10Ϫ6 (ЊF)Ϫ1 METALS AND METAL ALLOYS Plain Carbon and Low-Alloy Steels Steel alloy A36 11.7 6.5 Steel alloy 1020 11.7 6.5 Steel alloy 1040 11.3 6.3 Steel alloy 4140 12.3 6.8 Steel alloy 4340 12.3 6.8 Stainless Steels Stainless alloy 304 17.2 9.6 Stainless alloy 316 16.0 8.9 Stainless alloy 405 10.8 6.0 Stainless alloy 440A 10.2 5.7 Stainless alloy 17-7PH 11.0 6.1 Cast Irons Gray irons • Grade G1800 11.4 6.3 • Grade G3000 11.4 6.3 • Grade G4000 11.4 6.3 JWCL187_appB_A03-A30.qxd 11/3/09 1:35 PM Page A17
- 16. A18 • Appendix B / Properties of Selected Engineering Materials Table B.6 (Continued) Coefficient of Thermal Expansion Material 10Ϫ6 (ЊC)Ϫ1 10Ϫ6 (ЊF)Ϫ1 Ductile irons • Grade 60-40-18 11.2 6.2 • Grade 80-55-06 10.6 5.9 Aluminum Alloys Alloy 1100 23.6 13.1 Alloy 2024 22.9 12.7 Alloy 6061 23.6 13.1 Alloy 7075 23.4 13.0 Alloy 356.0 21.5 11.9 Copper Alloys C11000 (electrolytic tough pitch) 17.0 9.4 C17200 (beryllium–copper) 16.7 9.3 C26000 (cartridge brass) 19.9 11.1 C36000 (free-cutting brass) 20.5 11.4 C71500 (copper–nickel, 30%) 16.2 9.0 C93200 (bearing bronze) 18.0 10.0 Magnesium Alloys Alloy AZ31B 26.0 14.4 Alloy AZ91D 26.0 14.4 Titanium Alloys Commercially pure (ASTM grade 1) 8.6 4.8 Alloy Ti–5Al–2.5Sn 9.4 5.2 Alloy Ti–6Al–4V 8.6 4.8 Precious Metals Gold (commercially pure) 14.2 7.9 Platinum (commercially pure) 9.1 5.1 Silver (commercially pure) 19.7 10.9 Refractory Metals Molybdenum (commercially pure) 4.9 2.7 Tantalum (commercially pure) 6.5 3.6 Tungsten (commercially pure) 4.5 2.5 Miscellaneous Nonferrous Alloys Nickel 200 13.3 7.4 Inconel 625 12.8 7.1 Monel 400 13.9 7.7 Haynes alloy 25 12.3 6.8 Invar 1.6 0.9 Super invar 0.72 0.40 Kovar 5.1 2.8 Chemical lead 29.3 16.3 Antimonial lead (6%) 27.2 15.1 Tin (commercially pure) 23.8 13.2 Lead–tin solder (60Sn–40Pb) 24.0 13.3 Zinc (commercially pure) 23.0–32.5 12.7–18.1 Zirconium, reactor grade 702 5.9 3.3 JWCL187_appB_A03-A30.qxd 11/3/09 1:35 PM Page A18
- 17. Appendix B / Properties of Selected Engineering Materials • A19 Table B.6 (Continued) Coefficient of Thermal Expansion Material 10Ϫ6 (ЊC)Ϫ1 10Ϫ6 (ЊF)Ϫ1 GRAPHITE, CERAMICS, AND SEMICONDUCTING MATERIALS Aluminum oxide • 99.9% pure 7.4 4.1 • 96% pure 7.4 4.1 • 90% pure 7.0 3.9 Concrete 10.0–13.6 5.6–7.6 Diamond (natural) 0.11–1.23 0.06–0.68 Gallium arsenide 5.9 3.3 Glass, borosilicate (Pyrex) 3.3 1.8 Glass, soda–lime 9.0 5.0 Glass-ceramic (Pyroceram) 6.5 3.6 Graphite • Extruded 2.0–2.7 1.1–1.5 • Isostatically molded 2.2–6.0 1.2–3.3 Silica, fused 0.4 0.22 Silicon 2.5 1.4 Silicon carbide • Hot pressed 4.6 2.6 • Sintered 4.1 2.3 Silicon nitride • Hot pressed 2.7 1.5 • Reaction bonded 3.1 1.7 • Sintered 3.1 1.7 Zirconia, 3 mol% Y2O3 9.6 5.3 POLYMERS Elastomers • Butadiene-acrylonitrile (nitrile) 235 130 • Styrene-butadiene (SBR) 220 125 • Silicone 270 150 Epoxy 81–117 45–65 Nylon 6,6 144 80 Phenolic 122 68 Poly(butylene terephthalate) (PBT) 108–171 60–95 Polycarbonate (PC) 122 68 Polyester (thermoset) 100–180 55–100 Polyetheretherketone (PEEK) 72–85 40–47 Polyethylene • Low density (LDPE) 180–400 100–220 • High density (HDPE) 106–198 59–110 • Ultrahigh molecular weight 234–360 130–200 (UHMWPE) Poly(ethylene terephthalate) (PET) 117 65 Poly(methyl methacrylate) (PMMA) 90–162 50–90 Polypropylene (PP) 146–180 81–100 Polystyrene (PS) 90–150 50–83 Polytetrafluoroethylene (PTFE) 126–216 70–120 Poly(vinyl chloride) (PVC) 90–180 50–100 JWCL187_appB_A03-A30.qxd 11/3/09 1:35 PM Page A19
- 18. A20 • Appendix B / Properties of Selected Engineering Materials Table B.6 (Continued) Coefficient of Thermal Expansion Material 10Ϫ6 (ЊC)Ϫ1 10Ϫ6 (ЊF)Ϫ1 FIBER MATERIALS Aramid (Kevlar 49) • Longitudinal direction Ϫ2.0 Ϫ1.1 • Transverse direction 60 33 Carbon (PAN precursor) • Standard modulus Longitudinal direction Ϫ0.6 Ϫ0.3 Transverse direction 10.0 5.6 • Intermediate modulus Longitudinal direction Ϫ0.6 Ϫ0.3 • High modulus Longitudinal direction Ϫ0.5 Ϫ0.28 Transverse direction 7.0 3.9 E-glass 5.0 2.8 COMPOSITE MATERIALS Aramid fibers–epoxy matrix (Vf ϭ 0.6) • Longitudinal direction Ϫ4.0 Ϫ2.2 • Transverse direction 70 40 High-modulus carbon fibers–epoxy matrix (Vf ϭ 0.6) • Longitudinal direction Ϫ0.5 Ϫ0.3 • Transverse direction 32 18 E-glass fibers–epoxy matrix (Vf ϭ 0.6) • Longitudinal direction 6.6 3.7 • Transverse direction 30 16.7 Wood • Douglas fir (12% moisture) Parallel to grain 3.8–5.1 2.2–2.8 Perpendicular to grain 25.4–33.8 14.1–18.8 • Red oak (12% moisture) Parallel to grain 4.6–5.9 2.6–3.3 Perpendicular to grain 30.6–39.1 17.0–21.7 Sources: ASM Handbooks, Volumes 1 and 2, Engineered Materials Handbooks, Volumes 1 and 4, Metals Handbook: Properties and Selection: Nonferrous Alloys and Pure Metals, Vol. 2, 9th edition, and Advanced Materials & Processes, Vol. 146, No. 4, ASM International, Materials Park, OH; Modern Plastics Encyclopedia ’96, The McGraw-Hill Companies, New York, NY; R. F. Floral and S. T. Peters, “Composite Structures and Technologies,” tutorial notes, 1989; and manufacturers’ technical data sheets. JWCL187_appB_A03-A30.qxd 11/3/09 1:35 PM Page A20
- 19. Appendix B / Properties of Selected Engineering Materials • A21 Table B.7 Room-Temperature Thermal Conductivity Values for Various Engineering Materials Thermal Conductivity Material W/m .K Btu/ft .h .؇F METALS AND METAL ALLOYS Plain Carbon and Low-Alloy Steels Steel alloy A36 51.9 30 Steel alloy 1020 51.9 30 Steel alloy 1040 51.9 30 Stainless Steels Stainless alloy 304 (annealed) 16.2 9.4 Stainless alloy 316 (annealed) 15.9 9.2 Stainless alloy 405 (annealed) 27.0 15.6 Stainless alloy 440A (annealed) 24.2 14.0 Stainless alloy 17-7PH (annealed) 16.4 9.5 Cast Irons Gray irons • Grade G1800 46.0 26.6 • Grade G3000 46.0 26.6 • Grade G4000 46.0 26.6 Ductile irons • Grade 60-40-18 36.0 20.8 • Grade 80-55-06 36.0 20.8 • Grade 120-90-02 36.0 20.8 Aluminum Alloys Alloy 1100 (annealed) 222 128 Alloy 2024 (annealed) 190 110 Alloy 6061 (annealed) 180 104 Alloy 7075-T6 130 75 Alloy 356.0-T6 151 87 Copper Alloys C11000 (electrolytic tough pitch) 388 224 C17200 (beryllium–copper) 105–130 60–75 C26000 (cartridge brass) 120 70 C36000 (free-cutting brass) 115 67 C71500 (copper–nickel, 30%) 29 16.8 C93200 (bearing bronze) 59 34 Magnesium Alloys Alloy AZ31B 96a 55a Alloy AZ91D 72a 43a Titanium Alloys Commercially pure (ASTM grade 1) 16 9.2 Alloy Ti–5Al–2.5Sn 7.6 4.4 Alloy Ti–6Al–4V 6.7 3.9 Precious Metals Gold (commercially pure) 315 182 Platinum (commercially pure) 71b 41b Silver (commercially pure) 428 247 JWCL187_appB_A03-A30.qxd 11/3/09 1:35 PM Page A21
- 20. A22 • Appendix B / Properties of Selected Engineering Materials Table B.7 (Continued) Thermal Conductivity Material W/m K Btu/ft h ؇F### Refractory Metals Molybdenum (commercially pure) 142 82 Tantalum (commercially pure) 54.4 31.4 Tungsten (commercially pure) 155 89.4 Miscellaneous Nonferrous Alloys Nickel 200 70 40.5 Inconel 625 9.8 5.7 Monel 400 21.8 12.6 Haynes alloy 25 9.8 5.7 Invar 10 5.8 Super invar 10 5.8 Kovar 17 9.8 Chemical lead 35 20.2 Antimonial lead (6%) 29 16.8 Tin (commercially pure) 60.7 35.1 Lead–tin solder (60Sn–40Pb) 50 28.9 Zinc (commercially pure) 108 62 Zirconium, reactor grade 702 22 12.7 GRAPHITE, CERAMICS, AND SEMICONDUCTING MATERIALS Aluminum oxide • 99.9% pure 39 22.5 • 96% pure 35 20 • 90% pure 16 9.2 Concrete 1.25–1.75 0.72–1.0 Diamond • Natural 1450–4650 840–2700 • Synthetic 3150 1820 Gallium arsenide 45.5 26.3 Glass, borosilicate (Pyrex) 1.4 0.81 Glass, soda–lime 1.7 1.0 Glass-ceramic (Pyroceram) 3.3 1.9 Graphite • Extruded 130–190 75–110 • Isostatically molded 104–130 60–75 Silica, fused 1.4 0.81 Silicon 141 82 Silicon carbide • Hot pressed 80 46.2 • Sintered 71 41 Silicon nitride • Hot pressed 29 17 • Reaction bonded 10 6 • Sintered 33 19.1 Zirconia, 3 mol% Y2O3 2.0–3.3 1.2–1.9 POLYMERS Elastomers • Butadiene-acrylonitrile (nitrile) 0.25 0.14 • Styrene-butadiene (SBR) 0.25 0.14 • Silicone 0.23 0.13 JWCL187_appB_A03-A30.qxd 11/3/09 1:35 PM Page A22
- 21. Appendix B / Properties of Selected Engineering Materials • A23 Table B.7 (Continued) Thermal Conductivity Material W/m K Btu/ft h ؇F### Epoxy 0.19 0.11 Nylon 6,6 0.24 0.14 Phenolic 0.15 0.087 Poly(butylene terephthalate) (PBT) 0.18–0.29 0.10–0.17 Polycarbonate (PC) 0.20 0.12 Polyester (thermoset) 0.17 0.10 Polyethylene • Low density (LDPE) 0.33 0.19 • High density (HDPE) 0.48 0.28 • Ultrahigh molecular weight (UHMWPE) 0.33 0.19 Poly(ethylene terephthalate) (PET) 0.15 0.087 Poly(methyl methacrylate) (PMMA) 0.17–0.25 0.10–0.15 Polypropylene (PP) 0.12 0.069 Polystyrene (PS) 0.13 0.075 Polytetrafluoroethylene (PTFE) 0.25 0.14 Poly(vinyl chloride) (PVC) 0.15–0.21 0.08–0.12 FIBER MATERIALS Carbon (PAN precursor), longitudinal • Standard modulus 11 6.4 • Intermediate modulus 15 8.7 • High modulus 70 40 E-glass 1.3 0.75 COMPOSITE MATERIALS Wood • Douglas fir (12% moisture) Perpendicular to grain 0.14 0.08 • Red oak (12% moisture) Perpendicular to grain 0.18 0.11 a At 100ЊC. b At 0ЊC. Sources: ASM Handbooks, Volumes 1 and 2, Engineered Materials Handbooks, Volumes 1 and 4, Metals Handbook: Properties and Selection: Nonferrous Alloys and Pure Metals, Vol. 2, 9th edition, and Advanced Materials & Processes, Vol. 146, No. 4, ASM International, Materials Park, OH; Modern Plastics Encyclopedia ’96 and Modern Plastics Encyclopedia 1977–1978, The McGraw-Hill Companies, New York, NY; and manufacturers’ technical data sheets. JWCL187_appB_A03-A30.qxd 11/3/09 1:35 PM Page A23
- 22. A24 • Appendix B / Properties of Selected Engineering Materials Table B.8 Room-Temperature Specific Heat Values for Various Engineering Materials Specific Heat Material J/kg .K 10؊2 Btu/lbm .؇F METALS AND METAL ALLOYS Plain Carbon and Low-Alloy Steels Steel alloy A36 486a 11.6a Steel alloy 1020 486a 11.6a Steel alloy 1040 486a 11.6a Stainless Steels Stainless alloy 304 500 12.0 Stainless alloy 316 502 12.1 Stainless alloy 405 460 11.0 Stainless alloy 440A 460 11.0 Stainless alloy 17-7PH 460 11.0 Cast Irons Gray irons • Grade G1800 544 13 • Grade G3000 544 13 • Grade G4000 544 13 Ductile irons • Grade 60-40-18 544 13 • Grade 80-55-06 544 13 • Grade 120-90-02 544 13 Aluminum Alloys Alloy 1100 904 21.6 Alloy 2024 875 20.9 Alloy 6061 896 21.4 Alloy 7075 960b 23.0b Alloy 356.0 963b 23.0b Copper Alloys C11000 (electrolytic tough pitch) 385 9.2 C17200 (beryllium–copper) 420 10.0 C26000 (cartridge brass) 375 9.0 C36000 (free-cutting brass) 380 9.1 C71500 (copper–nickel, 30%) 380 9.1 C93200 (bearing bronze) 376 9.0 Magnesium Alloys Alloy AZ31B 1024 24.5 Alloy AZ91D 1050 25.1 Titanium Alloys Commercially pure (ASTM grade 1) 528c 12.6c Alloy Ti–5Al–2.5Sn 470c 11.2c Alloy Ti–6Al–4V 610c 14.6c Precious Metals Gold (commercially pure) 128 3.1 Platinum (commercially pure) 132d 3.2d Silver (commercially pure) 235 5.6 JWCL187_appB_A03-A30.qxd 11/3/09 1:35 PM Page A24
- 23. Appendix B / Properties of Selected Engineering Materials • A25 Table B.8 (Continued) Specific Heat Material J/kg K 10؊2 Btu/lbm ؇F## Refractory Metals Molybdenum (commercially pure) 276 6.6 Tantalum (commercially pure) 139 3.3 Tungsten (commercially pure) 138 3.3 Miscellaneous Nonferrous Alloys Nickel 200 456 10.9 Inconel 625 410 9.8 Monel 400 427 10.2 Haynes alloy 25 377 9.0 Invar 500 12.0 Super invar 500 12.0 Kovar 460 11.0 Chemical lead 129 3.1 Antimonial lead (6%) 135 3.2 Tin (commercially pure) 222 5.3 Lead–tin solder (60Sn–40Pb) 150 3.6 Zinc (commercially pure) 395 9.4 Zirconium, reactor grade 702 285 6.8 GRAPHITE, CERAMICS, AND SEMICONDUCTING MATERIALS Aluminum oxide • 99.9% pure 775 18.5 • 96% pure 775 18.5 • 90% pure 775 18.5 Concrete 850–1150 20.3–27.5 Diamond (natural) 520 12.4 Gallium arsenide 350 8.4 Glass, borosilicate (Pyrex) 850 20.3 Glass, soda–lime 840 20.0 Glass-ceramic (Pyroceram) 975 23.3 Graphite • Extruded 830 19.8 • Isostatically molded 830 19.8 Silica, fused 740 17.7 Silicon 700 16.7 Silicon carbide • Hot pressed 670 16.0 • Sintered 590 14.1 Silicon nitride • Hot pressed 750 17.9 • Reaction bonded 870 20.7 • Sintered 1100 26.3 Zirconia, 3 mol% Y2O3 481 11.5 POLYMERS Epoxy 1050 25 Nylon 6,6 1670 40 Phenolic 1590–1760 38–42 Poly(butylene terephthalate) (PBT) 1170–2300 28–55 Polycarbonate (PC) 840 20 JWCL187_appB_A03-A30.qxd 11/3/09 1:35 PM Page A25
- 24. A26 • Appendix B / Properties of Selected Engineering Materials Table B.8 (Continued) Specific Heat Material J/kg K 10؊2 Btu/lbm ؇F## Polyester (thermoset) 710–920 17–22 Polyethylene • Low density (LDPE) 2300 55 • High density (HDPE) 1850 44.2 Poly(ethylene terephthalate) (PET) 1170 28 Poly(methyl methacrylate) (PMMA) 1460 35 Polypropylene (PP) 1925 46 Polystyrene (PS) 1170 28 Polytetrafluoroethylene (PTFE) 1050 25 Poly(vinyl chloride) (PVC) 1050–1460 25–35 FIBER MATERIALS Aramid (Kevlar 49) 1300 31 E-glass 810 19.3 COMPOSITE MATERIALS Wood • Douglas fir (12% moisture) 2900 69.3 • Red oak (12% moisture) 2900 69.3 a At temperatures between 50ЊC and 100ЊC. b At 100ЊC. c At 50ЊC. d At 0ЊC. Sources: ASM Handbooks, Volumes 1 and 2, Engineered Materials Handbooks, Volumes 1, 2, and 4, Metals Handbook: Properties and Selection: Nonferrous Alloys and Pure Metals, Vol. 2, 9th edition, and Advanced Materials & Processes, Vol. 146, No. 4, ASM International, Materials Park, OH; Modern Plastics Encyclopedia 1977–1978, The McGraw-Hill Companies, New York, NY; and manufacturers’ technical data sheets. Table B.9 Room-Temperature Electrical Resistivity Values for Various Engineering Materials Material Electrical Resistivity, ⍀.m METALS AND METAL ALLOYS Plain Carbon and Low-Alloy Steels Steel alloy A36a 1.60 ϫ 10Ϫ7 Steel alloy 1020 (annealed)a 1.60 ϫ 10Ϫ7 Steel alloy 1040 (annealed)a 1.60 ϫ 10Ϫ7 Steel alloy 4140 (quenched and tempered) 2.20 ϫ 10Ϫ7 Steel alloy 4340 (quenched and tempered) 2.48 ϫ 10Ϫ7 Stainless Steels Stainless alloy 304 (annealed) 7.2 ϫ 10Ϫ7 Stainless alloy 316 (annealed) 7.4 ϫ 10Ϫ7 Stainless alloy 405 (annealed) 6.0 ϫ 10Ϫ7 Stainless alloy 440A (annealed) 6.0 ϫ 10Ϫ7 Stainless alloy 17-7PH (annealed) 8.3 ϫ 10Ϫ7 JWCL187_appB_A03-A30.qxd 11/3/09 1:35 PM Page A26
- 25. Appendix B / Properties of Selected Engineering Materials • A27 Table B.9 (Continued) Material Electrical Resistivity, ⍀ m# Cast Irons Gray irons • Grade G1800 15.0 ϫ 10Ϫ7 • Grade G3000 9.5 ϫ 10Ϫ7 • Grade G4000 8.5 ϫ 10Ϫ7 Ductile irons • Grade 60-40-18 5.5 ϫ 10Ϫ7 • Grade 80-55-06 6.2 ϫ 10Ϫ7 • Grade 120-90-02 6.2 ϫ 10Ϫ7 Aluminum Alloys Alloy 1100 (annealed) 2.9 ϫ 10Ϫ8 Alloy 2024 (annealed) 3.4 ϫ 10Ϫ8 Alloy 6061 (annealed) 3.7 ϫ 10Ϫ8 Alloy 7075 (T6 treatment) 5.22 ϫ 10Ϫ8 Alloy 356.0 (T6 treatment) 4.42 ϫ 10Ϫ8 Copper Alloys C11000 (electrolytic tough pitch, annealed) 1.72 ϫ 10Ϫ8 C17200 (beryllium–copper) 5.7 ϫ 10Ϫ8 –1.15 ϫ 10Ϫ7 C26000 (cartridge brass) 6.2 ϫ 10Ϫ8 C36000 (free-cutting brass) 6.6 ϫ 10Ϫ8 C71500 (copper–nickel, 30%) 37.5 ϫ 10Ϫ8 C93200 (bearing bronze) 14.4 ϫ 10Ϫ8 Magnesium Alloys Alloy AZ31B 9.2 ϫ 10Ϫ8 Alloy AZ91D 17.0 ϫ 10Ϫ8 Titanium Alloys Commercially pure (ASTM grade 1) 4.2 ϫ 10Ϫ7 –5.2 ϫ 10Ϫ7 Alloy Ti–5Al–2.5Sn 15.7 ϫ 10Ϫ7 Alloy Ti–6Al–4V 17.1 ϫ 10Ϫ7 Precious Metals Gold (commercially pure) 2.35 ϫ 10Ϫ8 Platinum (commercially pure) 10.60 ϫ 10Ϫ8 Silver (commercially pure) 1.47 ϫ 10Ϫ8 Refractory Metals Molybdenum (commercially pure) 5.2 ϫ 10Ϫ8 Tantalum (commercially pure) 13.5 ϫ 10Ϫ8 Tungsten (commercially pure) 5.3 ϫ 10Ϫ8 Miscellaneous Nonferrous Alloys Nickel 200 0.95 ϫ 10Ϫ7 Inconel 625 12.90 ϫ 10Ϫ7 Monel 400 5.47 ϫ 10Ϫ7 Haynes alloy 25 8.9 ϫ 10Ϫ7 Invar 8.2 ϫ 10Ϫ7 Super invar 8.0 ϫ 10Ϫ7 Kovar 4.9 ϫ 10Ϫ7 Chemical lead 2.06 ϫ 10Ϫ7 Antimonial lead (6%) 2.53 ϫ 10Ϫ7 Tin (commercially pure) 1.11 ϫ 10Ϫ7 Lead–tin solder (60Sn–40Pb) 1.50 ϫ 10Ϫ7 JWCL187_appB_A03-A30.qxd 11/3/09 1:35 PM Page A27
- 26. A28 • Appendix B / Properties of Selected Engineering Materials Table B.9 (Continued) Material Electrical Resistivity, ⍀ m# Zinc (commercially pure) 62.0 ϫ 10Ϫ7 Zirconium, reactor grade 702 3.97 ϫ 10Ϫ7 GRAPHITE, CERAMICS, AND SEMICONDUCTING MATERIALS Aluminum oxide • 99.9% pure Ͼ1013 • 96% pure Ͼ1012 • 90% pure Ͼ1012 Concrete (dry) 109 Diamond • Natural 10–1014 • Synthetic 1.5 ϫ 10Ϫ2 Gallium arsenide (intrinsic) 106 Glass, borosilicate (Pyrex) ϳ1013 Glass, soda–lime 1010 –1011 Glass-ceramic (Pyroceram) 2 ϫ 1014 Graphite • Extruded (with grain direction) 7 ϫ 10Ϫ6 –20 ϫ 10Ϫ6 • Isostatically molded 10 ϫ 10Ϫ6 –18 ϫ 10Ϫ6 Silica, fused Ͼ1018 Silicon (intrinsic) 2500 Silicon carbide • Hot pressed 1.0–109 • Sintered 1.0–109 Silicon nitride • Hot isostatic pressed Ͼ1012 • Reaction bonded Ͼ1012 • Sintered Ͼ1012 Zirconia, 3 mol% Y2O3 1010 POLYMERS Elastomers • Butadiene-acrylonitrile (nitrile) 3.5 ϫ 108 • Styrene-butadiene (SBR) 6 ϫ 1011 • Silicone 1013 Epoxy 1010 –1013 Nylon 6,6 1012 –1013 Phenolic 109 –1010 Poly(butylene terephthalate) (PBT) 4 ϫ 1014 Polycarbonate (PC) 2 ϫ 1014 Polyester (thermoset) 1013 Polyetheretherketone (PEEK) 6 ϫ 1014 Polyethylene • Low density (LDPE) 1015 –5 ϫ 1016 • High density (HDPE) 1015 –5 ϫ 1016 • Ultrahigh molecular weight (UHMWPE) Ͼ5 ϫ 1014 Poly(ethylene terephthalate) (PET) 1012 Poly(methyl methacrylate) (PMMA) Ͼ1012 Polypropylene (PP) Ͼ1014 Polystyrene (PS) Ͼ1014 Polytetrafluoroethylene (PTFE) 1017 Poly(vinyl chloride) (PVC) Ͼ1014 JWCL187_appB_A03-A30.qxd 11/14/09 5:35 AM Page A28
- 27. Appendix B / Properties of Selected Engineering Materials • A29 Table B.9 (Continued) Material Electrical Resistivity, ⍀.m FIBER MATERIALS Carbon (PAN precursor) • Standard modulus 17 ϫ 10Ϫ6 • Intermediate modulus 15 ϫ 10Ϫ6 • High modulus 9.5 ϫ 10Ϫ6 E-glass 4 ϫ 1014 COMPOSITE MATERIALS Wood • Douglas fir (oven dry) Parallel to grain 1014 –1016 Perpendicular to grain 1014 –1016 • Red oak (oven dry) Parallel to grain 1014 –1016 Perpendicular to grain 1014 –1016 a At 0ЊC. Sources: ASM Handbooks, Volumes 1 and 2, Engineered Materials Handbooks, Volumes 1, 2, and 4, Metals Handbook: Properties and Selection: Nonferrous Alloys and Pure Metals, Vol. 2, 9th edition, and Advanced Materials & Processes, Vol. 146, No. 4, ASM International, Materials Park, OH; Modern Plastics Encyclopedia 1977–1978, The McGraw-Hill Companies, New York, NY; and manufacturers’ technical data sheets. Table B.10 Compositions of Metal Alloys for Which Data Are Included in Tables B.1 through B.9 Alloy (UNS Designation) Composition (wt%) PLAIN CARBON AND LOW-ALLOY STEELS A36 (ASTM A36) 98.0 Fe (min), 0.29 C, 1.0 Mn, 0.28 Si 1020 (G10200) 99.1 Fe (min), 0.20 C, 0.45 Mn 1040 (G10400) 98.6 Fe (min), 0.40 C, 0.75 Mn 4140 (G41400) 96.8 Fe (min), 0.40 C, 0.90 Cr, 0.20 Mo, 0.9 Mn 4340 (G43400) 95.2 Fe (min), 0.40 C, 1.8 Ni, 0.80 Cr, 0.25 Mo, 0.7 Mn STAINLESS STEELS 304 (S30400) 66.4 Fe (min), 0.08 C, 19.0 Cr, 9.25 Ni, 2.0 Mn 316 (S31600) 61.9 Fe (min), 0.08 C, 17.0 Cr, 12.0 Ni, 2.5 Mo, 2.0 Mn 405 (S40500) 83.1 Fe (min), 0.08 C, 13.0 Cr, 0.20 Al, 1.0 Mn 440A (S44002) 78.4 Fe (min), 0.70 C, 17.0 Cr, 0.75 Mo, 1.0 Mn 17-7PH (S17700) 70.6 Fe (min), 0.09 C, 17.0 Cr, 7.1 Ni, 1.1 Al, 1.0 Mn CAST IRONS Grade G1800 (F10004) Fe (bal), 3.4–3.7 C, 2.8–2.3 Si, 0.65 Mn, 0.15 P, 0.15 S Grade G3000 (F10006) Fe (bal), 3.1–3.4 C, 2.3–1.9 Si, 0.75 Mn, 0.10 P, 0.15 S Grade G4000 (F10008) Fe (bal), 3.0–3.3 C, 2.1–1.8 Si, 0.85 Mn, 0.07 P, 0.15 S Grade 60-40-18 (F32800) Fe (bal), 3.4–4.0 C, 2.0–2.8 Si, 0–1.0 Ni, 0.05 Mg Grade 80-55-06 (F33800) Fe (bal), 3.3–3.8 C, 2.0–3.0 Si, 0–1.0 Ni, 0.05 Mg Grade 120-90-02 (F36200) Fe (bal), 3.4–3.8 C, 2.0–2.8 Si, 0–2.5 Ni, 0–1.0 Mo, 0.05 Mg JWCL187_appB_A03-A30.qxd 11/3/09 1:35 PM Page A29