Drought information exchange platform activity
•
1 gostou•589 visualizações

Drought Information exchange Platform

Recomendados
Recomendados
Mais conteúdo relacionado
Mais procurados
Mais procurados (20)
Destaque
Destaque (20)
Semelhante a Drought information exchange platform activity
Semelhante a Drought information exchange platform activity (20)
Mais de Global Water Partnership Central and Eastern Europe
Mais de Global Water Partnership Central and Eastern Europe (20)
Último
Último (20)
Drought information exchange platform activity
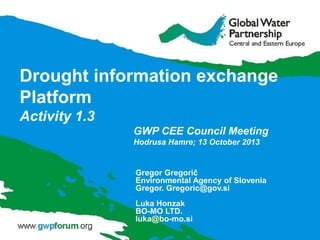
- 1. Drought information exchange Platform Activity 1.3 GWP CEE Council Meeting Hodrusa Hamre; 13 October 2013 Gregor Gregorič Environmental Agency of Slovenia Gregor. Gregoric@gov.si Luka Honzak BO-MO LTD. luka@bo-mo.si
- 2. What is “platform” • An information architecture and an intelligent infrastructure that enables exchange of data, relevant for drought analysis, as well as continous automated sensing, monitoring and decision support for drought risk management operations. • Act. 1.3: review existing platforms and make a proposal for an integration of IDMP products and data into one of them in order to design a common concept of capacity development and knowledge transfer.
- 3. Examples – WMO network
- 4. Drought monitors Bureau of Meteorology – Australia (http://www.bom.gov.au/climate/drought/) IGAD Climate Prediction and Applications Centre (http://www.icpac.net/) U. S. Drought Monitor (http://droughtmonitor.unl.edu) European Drought Observatory – EDO (http://edo.jrc.ec.europa.eu) Products/monitors Basic indicators Complex indicators Remote sensing data Field reports Impact data Bulletins BOM Australia ICPAC Africa SPI NDVI NDMC USA SPI, CMI, PDSI VegDRI, NDVI EDO SPI, CDI fAPAR, NDWI
- 5. U. S. Drought Monitor Tmap is updated weekly by combining a variety of databased drought indices and indicators and local expert input into a single composite drought indicator.
- 6. U. S. Drought Monitor IImpact reporter ccommitment of stake holders Sstandardization of response
- 7. Joint Research Centre • Directorate-General of the European Commission (the “in-house science service”), providing independent scientific and technological support for EU policy-making • 7 different locations; Institute for Environment and sustanability (IES) located in Ispra, Italy
- 8. European Drought Observatory (EDO) edo.jrc.ec.europa.eu EDO provides: Continental overview of information on drought Visualization and analysis Seamless access to regional and national drought information
- 9. Why EDO? • Long term commitment to European countries (not limited to EU members!) • Continuity of outcomes of the projects • Large past investments into infrastructure
- 10. European Drought Observatory (EDO) Information on current droughts (reports, “drought in media”) Data and tools – “factsheets”
- 11. EDO Mapviewer • A web-based Map Viewer, available on EDO webpage (DATA&TOOLS->EDO MapViewer) • It enables the visualisation, overlay/comparison and interrogation of spatial datasets over the Internet using WMS (Web Map Service) protocol.
- 12. EDO Mapviewer - overview
- 13. EDO Mapviewer – multiscale approach
- 14. EDO Mapviewer – compare indicators
- 15. EDO Mapviewer – compare indicators
- 16. EDO Drought Metadata Catalogue • Web application for searching and updating the drought catalog (http://vap-xjedo.jrc.it/Search/Search.html), developed by the University of Zaragoza for EuroGEOSS Project. • Metadata adjustments have been made to ensure ISO (19115, 19119, 19139) and INSPIRE compliancy. • The catalogue functionalities were improved including a “Drought Vocabulary”, defined and implemented during the project. • The catalogue provides search, discovery and preview facilities of spatial and non – spatial metadata.
- 17. EDO Drought Metadata Catalogue
- 18. EDO Drought Metadata Catalogue
- 19. GWP IDMP project and EDO • Example of successfull story: EUROGEOSS project, where we made DMCSEE drought products available in EDO Mapviewer. • EUROGEOSS (http://www.eurogeoss.eu/) – FP7 project , focused on three strategic areas: drought, forestry and biodiversity – Demonstrates the added value to the scientific community and society of making existing systems and applications interoperable and used within the GEOSS and INSPIRE frameworks.
- 20. EUROGEOSS – EDO DMCSEE GIS application DMCSEE WMS server (UNM Mapserver) EDO http://www.dmcse e.org/en/drought_ monitor/
- 21. EUROGEOSS - EDO PProject destription under Home > Projects (http://edo.jrc.ec.eur opa.eu/edov2/php/i ndex.php?id=1004)
- 22. OWS (OGC Web Services) • Standards defined by Open Geospatial Consortium (OGC). • • • • • WMS – Web Map Service WCS – Web Coverage Service WFS – Web Feature Service WPS – Web Processing Service CSW – Catalogue Service for the Web
- 23. WMS – Web Map Service • Service used to display geospatial information in a raster format; it is mainly a view service. http://www.dmcsee.org/cgibin/mapserv?map=/var/www/tmp/dmcsee_wms/dmcsee_wms.map&SERVICE=WMS&VERSION= 1.0.0&REQUEST=GetMap&SRS=EPSG:4326&HEIGHT=360&WIDTH=760&FORMAT=image/png&BB OX=11,33.995,47.005,50&LAYERS=SPI6&TIME=19991001
- 24. WMS – how does it work? server spatial data user Spatial presentation WMS server Client 1. Invoke »GetCapabilities« operation Return WMS capabilities in XML document 2. Invoke »GetMap« operation Return map image in .gif, .png, or .svg. format WMS Server
- 25. Future work - Implementation guide • In work, final version end of November. DATA – country participation – – – – Proposed set of drought indicators. SPI 1,2,3,6,12. Description of indicator, base period … Rasted data prepared in georeferenced format. EDO – Raster data – WMS (Web Map Service) – Vector data – WFS (Web Feature Service) • Technical support - next workshop