SlideShare a Scribd company logo
1 of 8
Download to read offline
and farming duration, from the negative side (farmers aged
less than 50 years) to the positive side (farmers aged more
than 50 years). Furthermore, part-time and hobby farmers,
as well as farmers living in a family are located on the
negative side of this axis; farmers living in couples and
pensioners are located on the positive side of the axis.
The two classifications resulted in five PLU types and
seven SE types (details can be seen in Tables A1 and A2
in Appendix A). It is seen from the PLU types (Fig. 4 or
Table A2) that a high percentage (52%) of the farms in
the area is of more extensive types (PLU1 and PLU5).
The very extensive nature of the SOP farming is
surprising as Danish agriculture in general is perceived
and characterized by modern and intensive farming
systems (high percentage of arable land and/or intensive
livestock).
Additionally, in order to include the farm-size in the
analysis, a specific FS typology has been constructed
containing six FS classes (Table 1).
4.3. Building of a factorial plane displaying the pattern of
farm and farmer characteristics
The first axis of a correspondence analysis is, by
definition, the best reduction to one dimension of the
multifactorial space. In the case of the two analyses (PLU
and SE analyses), the importance of the first axis is
reinforced by the fact that the second axis essentially
Fig. 4. The socio-economic (SE), the production/land use (PLU) and the farm-size (FS) types on the factorial plane (PLUf1/SEf1).
L.S Kristensen et al. / Journal of Environmental Management 71 (2004) 231–244 237
segregates the extreme individual farm characteristics from
the medium ones (Gu¨ttman effect, see Legendre and
Legendre, 1998). An ‘artificial plane’ built with the first
factorial axis of each analysis, thus gives a satisfying
representation of the main structure (main gradient) of the
farm population regarding PLU characteristics on the one
side, and SE characteristics on the other. This artificial plane
is used in the following analysis as a ‘reference’ plane called
the PLUf1/SEf1 plane. The plane is represented in Figs. 4
and 5, with a description in the margin of the SE and PLU
gradients it displays.
4.4. Relationships between farm characteristics:
FS, SE and PLU characteristics
In order to explore the internal relationship between
the three groups (SE, PLU, and FS) of individual
farm characteristics, these groups were employed as
supplementary variables in the PLU analysis and the SE
analysis. The individual farm characteristics were plotted
on the PLUf1/ SEf1 plane, at the crossing point of their
co-ordinates along these two axes.
The internal relationships among these characteristics
were interpreted in two complementary ways: (1) the location
of the farm types along each gradient (for example: the
location of the PLU farm types along the SE gradient), (2) the
proximity of different farm types to one another (for example,
the proximity between certain PLU types and certain SE
types) along the first or the second axis. Obviously, the PLU
types and the SE types are well distributed along the PLUf1
axis and the SEf1 axis, respectively, as they are defined
according to these axes (Fig. 4).
The FS types are mainly distributed along the PLUf1
axis, i.e. the PLU gradient. The distance between the FS
types and the PLU types along the PLUf1 axis confirms
this relationship further. Farms with permanent land uses
Fig. 5. The landscape change types (PC) on the factorial plane (PLUf1/SEf1).
L.S Kristensen et al. / Journal of Environmental Management 71 (2004) 231–244238
and unused land (PLU1) appear to be the smallest farms
(FS1: less than 10 ha). Intensive crop farms with 70–80% of
arable land (PLU3) appear to be linked to farms of 10–30 ha
(FS2, FS3). The location of PLU3 at the origin of the PLUf1
axis can be explained by the fact that these farms have either
no or few animals, or a high percentage of arable land: thus
this group is between the two main tendencies expressed by
each side of this axis. In the group of mixed crop–livestock
farms (negative side of the PLUf1 axis), the FS increases
from 30 to 50 ha (FS4) for the extensive livestock farms
with 45–55% of arable land (PLU5) and the intensive
crop–livestock farms with 60–70% of arable land (PLU2),
50–100 ha (FS5) for the very intensive crop–livestock
(dairy) farms with 75–80% of arable land (PLU4). Finally,
the farm population also includes a few very large farms of
more than 100 ha (FS6). These seven farms are distributed
among all the PLU types, but three of them belong to the
type PLU5 (extensive livestock farms with 45–55% of
arable land), explaining the location of FS6 close to PLU5
along the PLUf1 axis.
Along the production/land use gradient (PLUf1 axis), we
observe a segregation of the SE types of farms into two main
groups. The positive side of the PLUf1 axis, corresponding
to production systems with no or few animals and less than
40% of arable land, contains the oldest farmers with a long
ownership duration (SE1) and the more recently established
hobby farmers (SE4, SE6). The negative side of the PLUf1
axis, corresponding to a mixture of crop–livestock farms
with more than 40% of arable land, contains the other SE
types, which are primary full-time farmers of different
ownership duration. The location of the farm types
regarding FS and production systems along the SEf1 axis
(SE gradient) do not add much information. The largest
farms (FS6) and the intensive crop–livestock farms with
60–70% of arable land (PLU2), situated on the negative
side of the axis, seem to be more associated with farmers
younger than those of the intensive crop farms of 70–80%
of arable land (PLU3), situated on the positive side.
These results indicate that there are no unique types of
PLU systems specifically associated with certain SE farm
types. Rather, a diversity of production systems is found on
farms exhibiting similar SE ‘profiles’. However, a relation-
ship between SE and PLU characteristics exists at a more
general level: full-time farmers appear to manage the largest
farms, with a higher percentage of arable land, and crop–
livestock farm systems, while the youngest hobby farmers
and the oldest farmers appear to have more extensive and
diverse farm systems, on smaller farms with or without
livestock.
4.5. Relationships between landscape changes
and farm and farmer characteristics
The relationship between patterns of landscape changes
at the farm level and farm and farmer characteristics has
been assessed in the same way as described previously, i.e.
by using the PC types as supplementary variables in the
MCA ‘PLU’ and ‘SE’. The PC types are then plotted at the
intersection of their co-ordinates along the PLUf1 and
the SEf1 axis (Fig. 5).
In the following interpretation, we have not accounted
for the landscape change type PC2, which corresponds to
only one farmer. The proximity of the different PC types to
the origin of the two axes indicates that farms with diverse
characteristics implement any combination of landscape
changes. However, the two gradients of farm characteristics
appear to segregate the PC types into a number of distinct
groups.
The PC types presenting no change (PC0) or land use
abandonment (PC5, PC6) are located on the positive side of
the SEf1 axis, which corresponds with the middle aged and
older farmers. These types are segregated again by the
PLUf1 axis. The PC5 type, dominated by land use
abandonment, is located on the positive side of the PLUf1
axis and hence more related to small farms with a small
percentage of arable land and no or few animals. On the
contrary, the PC6 type, characterised by land use abandon-
ment accompanied by hedgerow changes, is situated on the
negative side of the PLUf1 axis, and hence more related to
larger mixed crop–livestock farms. Finally, the group of no
change (PC0) appears to be more related to SE factors than
to PLU systems.
The PC farm types mainly representing the hedgerow
activities (PC1, PC3) are located on the negative side of
this SEf1 axis, which corresponds to the younger farmers.
It should be noticed that the type representing a higher
rate of hedgerow change (PC1) is more significantly
related to younger farmers than the type representing a
lower rate hedgerows changes (PC3). These two types are
also located in different places along the PLUf1 axis. The
type representing the higher rate of hedgerow changes
(PC1) is situated on the negative side of the PLUf1 axis
and therefore related to the largest mixed crop–livestock
farms (Fig. 4). In contrast, PC3 type, representing a lower
rate of hedgerow change, is close to the origin of this
axis, indicating that it is present in a variety of production
systems.
The remaining landscape change type, PC4, represents
few diverse changes, the most notably being the conversion
of arable land to permanent grassland. This activity appears
to be related to the smaller farms with a low percentage of
arable land and no or little livestock (location on the
positive side of the PLUf1 axis). The location of this type
close to the origin of the SEf1 axis indicates that this kind
of change is linked to a diversity of SE profiles. A closer
examination of the SE profile farmers of the PC4 type
shows that a majority of the farmers are pensioners, hobby
farmers and part-time farmers, half of them older than
50 years.
L.S Kristensen et al. / Journal of Environmental Management 71 (2004) 231–244 239
5. Discussion
5.1. Landscape changes and the landscape change typology
in SOP
During the period investigated, we observed an overall
increase in the wooded area (woods, small woodlands and
Christmas tree plantations), permanent grassland and
uncultivated land. The majority of these changes involved
a conversion of arable land; the others involved abandon-
ment of permanent land uses. These changes indicate an
extensification of land use, as the changes were from higher
input/output land use to lower input/output land use. In this
context, it may be mentioned that extensification does not
necessarily leads to an improvement of landscape from a
nature conservation point of view. Extensification in the
form of abandonment of permanent grassland may, for
example, have damaging consequences for the biodiversity
in farmed landscapes like SOP and this loss is not
compensated for by the creation of new permanent
grasslands.
Intensification of land use has also taken place in the
form of re-grassing/reuse of abandoned permanent grass-
land, and ploughing up of permanent grassland. However,
these changes made up a minor part (69 ha) compared to the
total amount of patch changes (365 ha). In addition, the total
length of hedgerows has increased, as has the number of
ponds.
Extensification trends and increases in the area and
number of semi-natural landscape elements have been
reported in other studies of Danish agricultural landscapes
in the 1990s (Brandt et al., 2001; Kristensen, 1999;
Kristensen et al., 2001; Primdahl, 1999). These results
indicate that certain areas in Denmark are faced with a
development more linked to post-productivism than pro-
ductivism. However, none of these studies have demon-
strated levels of landscape changes as high as in SOP.
Whether the observed landscape changes in SOP may be
interpreted as a response to the new farming conditions
solely and thus indicate a change from productivism to post-
productivism may, however, be questionable. On the one
hand, extensification was found to dominate the landscape
changes and some of these changes may obviously be
interpreted as a kind of market/policy adjustments, e.g. the
planting of Christmas trees (farm income diversification)
and the conversion of arable land to grassland. Also land
abandonment may be seen as an adjustment to the new
farming condition; however, in the present case, it seems
likely as well that these change processes are linked to
retirement processes or redeployment of human resources
outside the farm. Furthermore, the planting of very broad
hedgerows, 4–6 rows (not needed to fulfil a shelter
demand), as well as the creation of small woodlands, and
ponds (without any agricultural purpose) suggest that a new
kind of environmental interest exists among modern
farmers.
On the other hand, we know from analysis of
topographical maps that afforestation and planting of
small woodlands on arable land as well as hedgerow
planting have taken place at least since the Second World
War, so these trends are in fact not new. This suggests that
some of the observed changes may be a part of a tradition of
the area, probably linked to poor soil conditions and to a
lesser degree a response to the current changes in the
agricultural and environmental policies. High levels of
wildlife habitat creation on poor soil types have also been
reported by Battershill and Gilg (1996). They largely saw
this as results of the agricultural marginality of these areas
and the resulted tendency towards more extensive farming
systems. The dominance of more extensive farm systems is
also recognized in SOP, where the livestock density is low
compared to the Danish average and a high percentage of
the total agricultural land (30%) is covered by more
extensive land uses.
The patterns of landscape changes on farms are not very
well structured among the whole population, meaning that
the same kind of change is represented in more landscape
change groups. This may be due to the fact that hedgerow
activities are much more dominant than other changes and
that most farmers are involved in only one (if planting and
removal of hedgerow is seen as one activity) or two
landscape changes, instead of a combination of changes.
5.2. Farm and farmer characteristics and their
inter-relationships
The most obvious result of the analysis of the
relationships between different farm and farmer character-
istics is the close relationship between FS and the PLU
characteristics of farms. We observe a gradient of increasing
FS, which closely follows the main gradient of farming (an
increase in the amount of arable land). This gradient ranges
from farms with a land use consisting of permanent land use
and unused land (farms of less than 10 ha), to mixed crop–
livestock farms with 75–80% of arable land (farms of 50–
100 ha). A similar relationship between FS and the amount
of arable land has been reported by Adams et al. (1994).
The gradient of PLU characteristics and related FS
segregates the SE farmer types into two main groups: a
group predominated by the youngest hobby farmers and the
pensioners corresponding to small to medium extensive
farms, and a group including full-time farmers of different
ages and middle aged hobby farmers (40–60 years), who
run more intensive farms. The relationship between hobby
farmers and pensioners and more extensive farms may be
explained by the fact that these groups often implement a
more extensive farming system, because their human capital
is reduced (due to work off the farm or old age) (Potter and
Lobley, 1992).
These results show that relationships between the main
production/FS characteristics and SE characteristics of the
farm population can be identified. However, we did not find
L.S Kristensen et al. / Journal of Environmental Management 71 (2004) 231–244240
close relationships between specific types of production
systems and related FS, and specific SE types: hobby
farmers, for example, manage all types of farms, but small
farms are mostly managed by hobby farmers or pensioners.
This may be due to a great variation in FS for pensioners,
hobby farmers and full-time farmers, a result also reported
by Gasson (1986).
5.3. Relationships between landscape changes
and farm and farmer characteristics
The landscape change types are segregated according to
the main SE and PLU gradients of the farm population.
However, no strong and unique (simple) relationship could
be identified (Fig. 5).
The age of the farms and farmers, which characterises the
main SE gradient of the farm population, seems generally to
have the major influence on landscape changes. ‘No change’
and land use abandonment (PC5 and PC6) are common
among middle aged and older farmers, while planting and
removal of hedgerows are more common among younger
farmers. ‘No change’ and land use abandonment performed
by farmers close to retirement may be linked to the fact that
these farmers often wish to reduce the working time on the
farm and reduce the scale of operations (Potter and Lobley,
1992). In contrast, hedgerow activity is performed by
younger farmers and farmers with shorter ownership
duration, who still organise/re-organise their farms in
order to meet their production and amenity needs. These
results support earlier studies of, for example Wilson (1992)
and Potter and Lobley (1992), who found that landscape
changes were linked to the age of farmers and the duration
of the farm ownership.
There seems to be certain kind of links between the main
SE features of the farm population and the PLU system and
the undertaken landscape changes. Farmers in the same age
category are engaged in different combinations of landscape
changes that correspond to different kinds of PLU profiles.
For example, for the older farmers (PC5 and PC6), the
amount of land abandonment is higher on small extensive
farms (up to 8 ha) (PC5) than on more intensive mixed crop–
livestock farms (no more than 5 ha). This means that the most
extensive farms are becoming even more extensive.
In addition the landscape change type PC4, correspond-
ing to diverse changes (mainly conversion of arable to
permanent grassland, but also the reverse), is most
commonly found on farms with a more extensive production
system, owned by both young hobby farmers and pen-
sioners. This landscape change type may be interpreted
differently depending on the farmers’ SE profile: as a trend
towards extensification for most of the young hobby farmers
and the pensioners and as a trend towards intensification for
a few hobby farmers, probably those who intend to make a
living from farming.
The PC1 and PC3 landscape change types, dominated by
hedgerow planting and removal, are related to intensive
mixed crop–livestock farms managed by younger farmers.
Within these groups, the size of the hedgerow changes is
positively related to the FS.
These results indicate that landscape changes to a certain
degree are influenced by the SE environment of the farmers,
but it also appears that many of the changes are
implemented in order to fit into already existing farm
territories, which have been designed for the purpose of
certain management and production objectives by farmers.
The lack of a general and strong relationship between the
different farm level characteristics and landscape changes in
the present study, is in contrast to results of other studies,
e.g. Munton et al. (1989) who found that hobby/part-time
farmers did less harm to the landscape than full-time
farmers. This inconsistency may partly be linked to the
earlier mentioned tradition of hedgerow planting in the area,
which includes nearly all different types of farmers and
farms. In addition, modern full-time farmers may be more
aware of the non-production functions of the landscape due
to the general attention these issues have obtained recently,
which makes their behaviour less different from hobby
farmers. Such concordance of objectives of different farmer
groups may explain why we are unable to identify a strong
correlation between farm level characteristics and landscape
changes.
5.4. The statistical methods
As other multivariate analyses of the same family, MCA
are able to analyse gradients of information and their
relationships. Gradients are very common in situations
where no great contrasts exist in the physical environment,
or in the SE and production profiles of farms, and where
many factors are partly correlated (Thenail, 2002). In these
situations, it is difficult to find one or few variables such as
younger–older farmer or full-time hobby farmer (Potter and
Lobley, 1992; Munton et al., 1989, Wilson, 1997) that
significantly summarise the relationships between farms and
the landscape and to find significant correlations between
pairs of variables, by the use of cross-tabulations and chi-
square test.
A general limitation of the MCA method is the difficulty
in interpretation of the visualisation of the information on
the different planes, especially if the objects are close to
each other and to the axes on the planes. However, at the
same time it is an asset of the method that it enables the
observation and analysis of even low structured relation-
ships. The combinations of clustering and MCA, with the
superposition of the clusters (the types) as supplementary
variables on the planes they come from, greatly facilitate
the interpretation of the planes (Lebart et al., 1995). In the
present study, the use of supplementary variables on the
planes, which they do not participate to the building of,
allowed the assessment of linkages between the different
sets of information (Lebart et al., 1995). The significance
of the distance between the supplementary variables
L.S Kristensen et al. / Journal of Environmental Management 71 (2004) 231–244 241
and the axes of the planes can be assessed with a test value
(Lebart et al., 1995), which has been used successfully in
Kristensen et al. (2001) and Thenail (2002). Assessment
with a test value has not been done in the present study, as
the number of farms were too few, regarding the structure of
relationships between farm characteristics and landscape
changes.
6. Conclusions
The post-productivist transition includes the creation of
environmental goods and extensification of the land use on a
general level. The results of this study show that
extensification is the dominant land use trend, and that
creation of landscape elements like hedgerows and ponds
are much more widespread than their removal. Despite these
general trends, however, important landscape elements such
as permanent grassland are still being destroyed as a result
of abandonment or cultivation. This indicates that new
public efforts are needed, if such landscape elements are to
be sustained.
It cannot be concluded from the survey that the observed
landscape changes are a unique result of a change from
productivism to post-productivism in farming. On the
contrary, it seems likely that a combination of factors,
some of which are outside the range of investigated farm
level characteristics, have influenced farmers’ decision-
making process. A long tradition in the study area for
hedgerow planting and creation of woods and small
woodlands, probably related to the poor soil condition of
the area, is an example of such factors outside the farm level
characteristics, which may have influenced the observed
landscape changes.
We hypothesized from the outset of the study that a
relationship between farm characteristics and patterns of
landscape changes could be identified. However, despite a
successful identification of a variety of farm and farmer
types and landscape changes, the analysis of the relationship
between farm level characteristics and landscape changes
shows no strong relationship. On this background, we
conclude that the observed landscape changes take place on
a variety of farms and by a variety of farmers. This suggests
that information campaigns, incentives schemes and other
initiatives implemented within the domain of the public
Table A2
Description of farm types according to the production and the land use
characteristic
Type Description of production and land use
PLU1 very
extensive farms
These farms correspond to small farms with a very
extensive land use. The land use is mainly
permanent grassland, woodland and unused areas.
The proportion of unused area is 20–50% of the
farm area. The farm size is 5–20 ha. Among the
seven farms having Christmas trees in Sønder
Omme, three belong to this group. They have
mainly no animals. However, if they have animals
they are beef cattle or sheep (six sheep herds on a
total of 10 belong to farms of this type)
PLU2 medium
sized intensive
livestock or
crop farms
These farms correspond to medium crop–livestock
farms with 60–70% of arable land. The proportion
of permanent grassland is less than 20%, and the
proportion of cereals is of 40–70%. 55% of farms
have livestock, mainly dairy cows and beef cattle
(partly on pasture). The farm size is medium,
ranging from 25 to 50 ha
PLU3 small
intensive
crop farms
This group mainly corresponds to smaller specialised
crop farms (cereal-growing). In general, the farms
are without animals, but in cases of animals the
livestock is pigs or beef cattle reared in buildings.
All farms have very high percentage of arable land
(70–80% of the farm area). The farm size is 20–30 ha
PLU4 intensive
livestock farms
The farm type corresponds to large livestock (dairy)-
crop farms of more than 70% of arable land. The crop
production is cereals (40–50% of the land), but also
8–20% of other cash crops. The proportion of
permanent grassland in these farms is low (5–12%).
Only 4% of these farms have no livestock. Fifty-six
percent are dairy farms and 17% have beef
production. The proportion of grass and green
fodder is variable (0–35%), meaning that the feeding
of the animal is completed by purchased fodder
PLU5 extensive
livestock
or other extensive
farms
This farm type corresponds to livestock-crop farms
of less than 50% of arable land. The proportion
of permanent grassland is more than 20%, and the
proportion of cereals is 25–45%. The livestock farms
are mainly dairy farms and beef production farms
(partly on permanent grassland). The variations in
farm size big, ranging from 20 to 75 ha
Table A1
Description of farmer types according to the socio-economic characteristics
Type Socio-economic characteristics
SE1 Mainly pensioners, 65–75 years old, established for 30–40
years and with a household of two persons. Mostly grown
up in the countryside
SE2 Pre-pensioners, 60–65 years old and established for 20–30
years. Their occupation is diverse with 47% full time
farmers and 32% part time/hobby farmers. Half
of the group has a household of two persons
SE3 Middle-age farmers, 50–60 years, established for 20–30
years. Partly full time, partly hobby farmers living in
households of two persons
SE4 Younger hobby farmers, 30–40 years old, established for
2–5 years and with a household of 2–4 persons. Half of
the farmers are grown up in a city and half of them in the
countryside. This group includes the highest proportion
of persons grown up in the city
SE5 Younger farmers, 35–40 years and established for 2–5 years.
Full time farmers dominate the group (65%) and nearly half
of the households consist of one person
SE6 35–45 years old hobby farmers, established for 5–8 years,
with a household of 3–5 persons
SE7 Well-established farmers (15–20 years), 40–45 year old,
with a household of 2–4 persons. 48% of the group are
full time farmers and 34% hobby farmers
L.S Kristensen et al. / Journal of Environmental Management 71 (2004) 231–244242
planning in order to encourage the improvement and
enhancement of the values of the landscape may be targeted
all kind of farm and farmer types.
Appendix A
Tables A1 and A2.
References
Adams, W.M., 1996. Future Nature. A Vision for Conservation, Earthscan
Publications Ltd, London.
Adams, W.M., Hodge, I.D., Bourn, N.A.D., 1994. Nature conservation and
the management of the wider countryside in Eastern England. Journal of
Rural Studies 10, 147–157.
Agger, P., Brandt, J., 1988. Dynamics of small biotopes in Danish
agricultural landscapes. Landscape Ecology 1, 227–240.
Baldock, D., Beaufoy, G., Godeschalk, F., 1996. Farming at the Margins.
Abandonment or Redeployment of Agriculture Land in Europe, IEEP
and LEI-DLO, London.
Barr, C.J., Bunce, R.G.H., Clarke, R.T., Fuller, R.M., Furse, M.T.,
Gillespie, M.K., Groom, G.B., Hallam, C.J., Hornung, M., Howard,
D.C., Ness, M.J., 1993. Countryside Survey 1990. Main Report, The
Department of the Environment, London.
Battershill, M.R.J., Gilg, A.W., 1996. New approaches to creative
conservation on farms in South-west England. Journal of Environmen-
tal Management 48, 321–340.
Baudry, J., 1991. Ecological consequences of grazing extensification
and land abandonment: role of interactions between environment,
society and techniques. Option Me´diterrane´enes, Se´rie Se´minaires
15, 13–19.
Bowler, I., 1992. Sustainable agriculture as an alternative path of farm
business development. In: Bowler, I.R., Bryant, C.R., Nellis, M.D.
(Eds.), Contemporary Rural Systems in Transition, vol. 1, Agriculture
and Environment, CAB International, Wallingford, pp. 237–253.
Bowler, I., Ilbery, B., 1999. Agricultural land-use and landscape change
under the post-productivist transition—examples from the United
Kingdom. In: Kro¨nert, R., Baudry, J., Bowler, I., Reenberg, A. (Eds.),
Land-use Changes and their Environmental Impact in Rural Areas in
Europe, The Parthenon Publishing Group, Paris, pp. 121–140.
Brandt, J., Primdahl, J., Reenberg, A., 1999. Rural land-use and landscape
dynamics—analysis of ‘driving forces’ in space and time. In: Kro¨nert,
R., Baudry, J., Bowler, I.R., Reenberg, A. (Eds.), Land-use Changes and
their Environmental Impact in Rural Areas in Europe, UNESCO and the
Parthenon Publishing Group, Paris, pp. 81–102.
Brandt, J., Holmes, E., Agger, P., 2001. Integrated monitoring on a
landscape scale—lessons from Denmark, In: Strategic Landscape
Monitoring for the Nordic Countries, Nordic Council of Ministers,
Stockholm, pp. 31–41.
Buller, H., Wilson, G.A., Ho¨ll, A. (Eds.), 2000. Agri-environmental Policy
in the European Union, Ashgate Publishing Limited, Aldershot.
Danmarks Statistik, 1996. Landbrugsstatistik 1995, Danmarks Statistik,
København.
Gasson, R., 1986. Part-time farming: its place in the structure of agriculture.
In: Cox, G., Lowe, P. (Eds.), Agriculture: People and Policies, Allen &
Unwin, London, pp. 77–92.
Gasson, R., Potter, C., 1988. Conservation through land diversification: a
survey of farmers’ attitudes. Journal of Agricultural Economics 39,
340–351.
Ihse, M., 1995. Swedish agricultural landscapes—patterns and changes
during the last 50 years, studied by aerial photos. Landscape and Urban
Planning 31, 21–37.
Ilbery, B.W., 1990. The challenge of land redundancy. In: Pinder, D., (Ed.),
Western Europe: Challenge and Change, Belhaven Press, London, pp.
211–225.
Ilbery, B., Bowler, I., 1998. From agricultural productivism to post-
productivism. In: Ilbery, B., (Ed.), The Geography of Rural Change,
Longman, Essex, pp. 57–84.
Ilbery, B., Chiotti, Q., Rickard, T., 1997. Introduction. In: Ilbery, B.,
Chiotti, Q., Rickard, T. (Eds.), Agricultural Restructuring and
Sustainability. A Geographical Perspective, CAB International, Wall-
ingford, pp. 1–9.
Jacobsen, N.H., 1975. Natural-geographical regions of Denmark. Geo-
grafisk Tidsskrift 75, 1–6.
Kristensen, S.P., 1999. Agricultural land use and landscape changes in
Rostrup, Denmark: processes of intensification and extensification.
Landscape and Urban Planning 46, 117–123.
Kristensen, S.P., Thenail, C., Kristensen, L., 2001. Farmers’ involvement in
landscape activities: an analysis of the relationship between farm
location,farmcharacteristicsandlandscapechangesin two studyareasin
Jutland, Denmark. Journal of Environmental Management 61, 301–318.
Lambin, E.F., Rounsevell, M.D.A., Geist, H.J., 2000. Are agricultural land-
use models able to predict changes in land-use intensity? Agriculture
Ecosystems and Environment 82, 321–331.
Lebart, L., Morineau, A., Piron, M., 1995. Statistique exploratoire
multidimensionnelle, Dunod, Paris.
Lebeaux, M.O., 1985. ADDAD, Association pour le De´veloppement et la
Diffusion de l’Analyse des Donne´es, Multigraph, Paris.
Legendre, P., Legendre, L., 1998. Numerical Ecology, Second English ed.,
Elsevier, Amsterdam.
Marsden, T., 1995. Beyond agriculture? Regulating the new rural spaces.
Journal of Rural Studies 11, 285–296.
Marsden, T., 1998. New rural territories: regulating the differentiated rural
spaces. Journal of Rural Studies 14, 107–117.
Marsden, T., Murdoch, J., Lowe, P., Munton, R., Flynn, A., 1993.
Constructing the Countryside, UCL Press, London.
McDowell, C., Sparks, R., 1989. The multivariate modeling and prediction
of farmers’ conservation behavior towards natural ecosystems. Journal
of Environmental Management 28, 185–210.
McQuitty, L.L., 1966. Single and multiple classification by reciprocal pairs
and rank order type. Educational Psychology Measurements 26,
253–265.
Munton, R.J., Whatmore, S.J., Marsden, T.K., 1989. Part-time farming and
its implications for the rural landscape: a preliminary analysis.
Environment and Planning A 21, 523–536.
Potter, C., 1994. Cultural landscapes in flux: an approach to understanding
the processes of change. Landscape Issues 11, 59–63.
Potter, C., Lobley, M., 1992. Ageing and succession on family farms: the
impact on decision-making and land use. Sociologia Ruralis 32,
317–334.
Potter, C., Lobley, M., 1996. The farm family life cycle, succession paths
and environmental change in Britain’s countryside. Journal of
Environmental Management 47, 172–190.
Potter, C., Edwards, A., Gasson, R., Green, B., 1991. The Diversion of
Land. Conservation in a Period of Farming Contraction, Routledge,
London.
Primdahl, J., 1999. Agricultural landscapes as places of production and
for living in owner’s versus producer’s decision making and the
implications for planning. Landscape and Urban Planning 46,
143–150.
Rønningen, K., 1993. Agricultural policies and landscape management.
Some examples from Norway, Great Britain and Germany. Norsk
Geografisk Tidsskrift 47, 93–104.
Rønningen, K., 1999. Agricultural Policies and Countryside Management.
A Comparative European Study. Dr Polit Thesis. Department of
Geography, Faculty of Science and Technology Management, Norwe-
gian University of Science and technology, Trondheim.
Shucksmith, M., 1993. Farm household behaviour and the transition to
post-productivism. Journal of Agricultural Economics 44, 466–478.
L.S Kristensen et al. / Journal of Environmental Management 71 (2004) 231–244 243
Thenail, C., 2002. Relationships between farm characteristics and the
variation of the density of hedgerows at the level of a micro-region of
bocage landscape. Study case in Brittany, France. Agricultural System
71, 207–230.
Wilson, G.A., 1992. A survey on attitudes of landholders to native
forest on farmland. Journal of Environmental Management 34,
117–136.
Wilson, G.A., 1996. Farmer environmental attitudes and ESA participation.
Geoforum 27, 115–131.
Wilson, G.A., 1997. Factors influencing farmer participation in the
environmentally sensitive areas scheme. Journal of Environmental
Management 50, 67–93.
Wilson, G.A., 2001. From productivism to post-productivism… and back
again? Exploring the (un)changed natural and mental landscapes of
European agriculture. Transactions of the Institute of British Geogra-
phers 26, 77–102.
Working group SCOPE, 1997. SCOPE Pilot Study on Co-regional Planning
in Europe, Netherlands National Spatial Planning Agency, The Hague.
L.S Kristensen et al. / Journal of Environmental Management 71 (2004) 231–244244

More Related Content

Recently uploaded

URLs and Routing in the Odoo 17 Website App
URLs and Routing in the Odoo 17 Website AppURLs and Routing in the Odoo 17 Website App
URLs and Routing in the Odoo 17 Website AppCeline George
 
A Critique of the Proposed National Education Policy Reform
A Critique of the Proposed National Education Policy ReformA Critique of the Proposed National Education Policy Reform
A Critique of the Proposed National Education Policy ReformChameera Dedduwage
 
Measures of Central Tendency: Mean, Median and Mode
Measures of Central Tendency: Mean, Median and ModeMeasures of Central Tendency: Mean, Median and Mode
Measures of Central Tendency: Mean, Median and ModeThiyagu K
 
Presentation by Andreas Schleicher Tackling the School Absenteeism Crisis 30 ...
Presentation by Andreas Schleicher Tackling the School Absenteeism Crisis 30 ...Presentation by Andreas Schleicher Tackling the School Absenteeism Crisis 30 ...
Presentation by Andreas Schleicher Tackling the School Absenteeism Crisis 30 ...EduSkills OECD
 
The basics of sentences session 2pptx copy.pptx
The basics of sentences session 2pptx copy.pptxThe basics of sentences session 2pptx copy.pptx
The basics of sentences session 2pptx copy.pptxheathfieldcps1
 
Student login on Anyboli platform.helpin
Student login on Anyboli platform.helpinStudent login on Anyboli platform.helpin
Student login on Anyboli platform.helpinRaunakKeshri1
 
The Most Excellent Way | 1 Corinthians 13
The Most Excellent Way | 1 Corinthians 13The Most Excellent Way | 1 Corinthians 13
The Most Excellent Way | 1 Corinthians 13Steve Thomason
 
Software Engineering Methodologies (overview)
Software Engineering Methodologies (overview)Software Engineering Methodologies (overview)
Software Engineering Methodologies (overview)eniolaolutunde
 
microwave assisted reaction. General introduction
microwave assisted reaction. General introductionmicrowave assisted reaction. General introduction
microwave assisted reaction. General introductionMaksud Ahmed
 
Introduction to AI in Higher Education_draft.pptx
Introduction to AI in Higher Education_draft.pptxIntroduction to AI in Higher Education_draft.pptx
Introduction to AI in Higher Education_draft.pptxpboyjonauth
 
Contemporary philippine arts from the regions_PPT_Module_12 [Autosaved] (1).pptx
Contemporary philippine arts from the regions_PPT_Module_12 [Autosaved] (1).pptxContemporary philippine arts from the regions_PPT_Module_12 [Autosaved] (1).pptx
Contemporary philippine arts from the regions_PPT_Module_12 [Autosaved] (1).pptxRoyAbrique
 
Mastering the Unannounced Regulatory Inspection
Mastering the Unannounced Regulatory InspectionMastering the Unannounced Regulatory Inspection
Mastering the Unannounced Regulatory InspectionSafetyChain Software
 
Kisan Call Centre - To harness potential of ICT in Agriculture by answer farm...
Kisan Call Centre - To harness potential of ICT in Agriculture by answer farm...Kisan Call Centre - To harness potential of ICT in Agriculture by answer farm...
Kisan Call Centre - To harness potential of ICT in Agriculture by answer farm...Krashi Coaching
 
1029-Danh muc Sach Giao Khoa khoi 6.pdf
1029-Danh muc Sach Giao Khoa khoi  6.pdf1029-Danh muc Sach Giao Khoa khoi  6.pdf
1029-Danh muc Sach Giao Khoa khoi 6.pdfQucHHunhnh
 
Employee wellbeing at the workplace.pptx
Employee wellbeing at the workplace.pptxEmployee wellbeing at the workplace.pptx
Employee wellbeing at the workplace.pptxNirmalaLoungPoorunde1
 
Call Girls in Dwarka Mor Delhi Contact Us 9654467111
Call Girls in Dwarka Mor Delhi Contact Us 9654467111Call Girls in Dwarka Mor Delhi Contact Us 9654467111
Call Girls in Dwarka Mor Delhi Contact Us 9654467111Sapana Sha
 
Advanced Views - Calendar View in Odoo 17
Advanced Views - Calendar View in Odoo 17Advanced Views - Calendar View in Odoo 17
Advanced Views - Calendar View in Odoo 17Celine George
 
“Oh GOSH! Reflecting on Hackteria's Collaborative Practices in a Global Do-It...
“Oh GOSH! Reflecting on Hackteria's Collaborative Practices in a Global Do-It...“Oh GOSH! Reflecting on Hackteria's Collaborative Practices in a Global Do-It...
“Oh GOSH! Reflecting on Hackteria's Collaborative Practices in a Global Do-It...Marc Dusseiller Dusjagr
 

Recently uploaded (20)

URLs and Routing in the Odoo 17 Website App
URLs and Routing in the Odoo 17 Website AppURLs and Routing in the Odoo 17 Website App
URLs and Routing in the Odoo 17 Website App
 
A Critique of the Proposed National Education Policy Reform
A Critique of the Proposed National Education Policy ReformA Critique of the Proposed National Education Policy Reform
A Critique of the Proposed National Education Policy Reform
 
Measures of Central Tendency: Mean, Median and Mode
Measures of Central Tendency: Mean, Median and ModeMeasures of Central Tendency: Mean, Median and Mode
Measures of Central Tendency: Mean, Median and Mode
 
Presentation by Andreas Schleicher Tackling the School Absenteeism Crisis 30 ...
Presentation by Andreas Schleicher Tackling the School Absenteeism Crisis 30 ...Presentation by Andreas Schleicher Tackling the School Absenteeism Crisis 30 ...
Presentation by Andreas Schleicher Tackling the School Absenteeism Crisis 30 ...
 
The basics of sentences session 2pptx copy.pptx
The basics of sentences session 2pptx copy.pptxThe basics of sentences session 2pptx copy.pptx
The basics of sentences session 2pptx copy.pptx
 
Student login on Anyboli platform.helpin
Student login on Anyboli platform.helpinStudent login on Anyboli platform.helpin
Student login on Anyboli platform.helpin
 
The Most Excellent Way | 1 Corinthians 13
The Most Excellent Way | 1 Corinthians 13The Most Excellent Way | 1 Corinthians 13
The Most Excellent Way | 1 Corinthians 13
 
Software Engineering Methodologies (overview)
Software Engineering Methodologies (overview)Software Engineering Methodologies (overview)
Software Engineering Methodologies (overview)
 
microwave assisted reaction. General introduction
microwave assisted reaction. General introductionmicrowave assisted reaction. General introduction
microwave assisted reaction. General introduction
 
Introduction to AI in Higher Education_draft.pptx
Introduction to AI in Higher Education_draft.pptxIntroduction to AI in Higher Education_draft.pptx
Introduction to AI in Higher Education_draft.pptx
 
Contemporary philippine arts from the regions_PPT_Module_12 [Autosaved] (1).pptx
Contemporary philippine arts from the regions_PPT_Module_12 [Autosaved] (1).pptxContemporary philippine arts from the regions_PPT_Module_12 [Autosaved] (1).pptx
Contemporary philippine arts from the regions_PPT_Module_12 [Autosaved] (1).pptx
 
Mastering the Unannounced Regulatory Inspection
Mastering the Unannounced Regulatory InspectionMastering the Unannounced Regulatory Inspection
Mastering the Unannounced Regulatory Inspection
 
TataKelola dan KamSiber Kecerdasan Buatan v022.pdf
TataKelola dan KamSiber Kecerdasan Buatan v022.pdfTataKelola dan KamSiber Kecerdasan Buatan v022.pdf
TataKelola dan KamSiber Kecerdasan Buatan v022.pdf
 
Kisan Call Centre - To harness potential of ICT in Agriculture by answer farm...
Kisan Call Centre - To harness potential of ICT in Agriculture by answer farm...Kisan Call Centre - To harness potential of ICT in Agriculture by answer farm...
Kisan Call Centre - To harness potential of ICT in Agriculture by answer farm...
 
1029-Danh muc Sach Giao Khoa khoi 6.pdf
1029-Danh muc Sach Giao Khoa khoi  6.pdf1029-Danh muc Sach Giao Khoa khoi  6.pdf
1029-Danh muc Sach Giao Khoa khoi 6.pdf
 
Employee wellbeing at the workplace.pptx
Employee wellbeing at the workplace.pptxEmployee wellbeing at the workplace.pptx
Employee wellbeing at the workplace.pptx
 
Mattingly "AI & Prompt Design: The Basics of Prompt Design"
Mattingly "AI & Prompt Design: The Basics of Prompt Design"Mattingly "AI & Prompt Design: The Basics of Prompt Design"
Mattingly "AI & Prompt Design: The Basics of Prompt Design"
 
Call Girls in Dwarka Mor Delhi Contact Us 9654467111
Call Girls in Dwarka Mor Delhi Contact Us 9654467111Call Girls in Dwarka Mor Delhi Contact Us 9654467111
Call Girls in Dwarka Mor Delhi Contact Us 9654467111
 
Advanced Views - Calendar View in Odoo 17
Advanced Views - Calendar View in Odoo 17Advanced Views - Calendar View in Odoo 17
Advanced Views - Calendar View in Odoo 17
 
“Oh GOSH! Reflecting on Hackteria's Collaborative Practices in a Global Do-It...
“Oh GOSH! Reflecting on Hackteria's Collaborative Practices in a Global Do-It...“Oh GOSH! Reflecting on Hackteria's Collaborative Practices in a Global Do-It...
“Oh GOSH! Reflecting on Hackteria's Collaborative Practices in a Global Do-It...
 

Featured

2024 State of Marketing Report – by Hubspot
2024 State of Marketing Report – by Hubspot2024 State of Marketing Report – by Hubspot
2024 State of Marketing Report – by HubspotMarius Sescu
 
Everything You Need To Know About ChatGPT
Everything You Need To Know About ChatGPTEverything You Need To Know About ChatGPT
Everything You Need To Know About ChatGPTExpeed Software
 
Product Design Trends in 2024 | Teenage Engineerings
Product Design Trends in 2024 | Teenage EngineeringsProduct Design Trends in 2024 | Teenage Engineerings
Product Design Trends in 2024 | Teenage EngineeringsPixeldarts
 
How Race, Age and Gender Shape Attitudes Towards Mental Health
How Race, Age and Gender Shape Attitudes Towards Mental HealthHow Race, Age and Gender Shape Attitudes Towards Mental Health
How Race, Age and Gender Shape Attitudes Towards Mental HealthThinkNow
 
AI Trends in Creative Operations 2024 by Artwork Flow.pdf
AI Trends in Creative Operations 2024 by Artwork Flow.pdfAI Trends in Creative Operations 2024 by Artwork Flow.pdf
AI Trends in Creative Operations 2024 by Artwork Flow.pdfmarketingartwork
 
PEPSICO Presentation to CAGNY Conference Feb 2024
PEPSICO Presentation to CAGNY Conference Feb 2024PEPSICO Presentation to CAGNY Conference Feb 2024
PEPSICO Presentation to CAGNY Conference Feb 2024Neil Kimberley
 
Content Methodology: A Best Practices Report (Webinar)
Content Methodology: A Best Practices Report (Webinar)Content Methodology: A Best Practices Report (Webinar)
Content Methodology: A Best Practices Report (Webinar)contently
 
How to Prepare For a Successful Job Search for 2024
How to Prepare For a Successful Job Search for 2024How to Prepare For a Successful Job Search for 2024
How to Prepare For a Successful Job Search for 2024Albert Qian
 
Social Media Marketing Trends 2024 // The Global Indie Insights
Social Media Marketing Trends 2024 // The Global Indie InsightsSocial Media Marketing Trends 2024 // The Global Indie Insights
Social Media Marketing Trends 2024 // The Global Indie InsightsKurio // The Social Media Age(ncy)
 
Trends In Paid Search: Navigating The Digital Landscape In 2024
Trends In Paid Search: Navigating The Digital Landscape In 2024Trends In Paid Search: Navigating The Digital Landscape In 2024
Trends In Paid Search: Navigating The Digital Landscape In 2024Search Engine Journal
 
5 Public speaking tips from TED - Visualized summary
5 Public speaking tips from TED - Visualized summary5 Public speaking tips from TED - Visualized summary
5 Public speaking tips from TED - Visualized summarySpeakerHub
 
ChatGPT and the Future of Work - Clark Boyd
ChatGPT and the Future of Work - Clark Boyd ChatGPT and the Future of Work - Clark Boyd
ChatGPT and the Future of Work - Clark Boyd Clark Boyd
 
Getting into the tech field. what next
Getting into the tech field. what next Getting into the tech field. what next
Getting into the tech field. what next Tessa Mero
 
Google's Just Not That Into You: Understanding Core Updates & Search Intent
Google's Just Not That Into You: Understanding Core Updates & Search IntentGoogle's Just Not That Into You: Understanding Core Updates & Search Intent
Google's Just Not That Into You: Understanding Core Updates & Search IntentLily Ray
 
Time Management & Productivity - Best Practices
Time Management & Productivity -  Best PracticesTime Management & Productivity -  Best Practices
Time Management & Productivity - Best PracticesVit Horky
 
The six step guide to practical project management
The six step guide to practical project managementThe six step guide to practical project management
The six step guide to practical project managementMindGenius
 
Beginners Guide to TikTok for Search - Rachel Pearson - We are Tilt __ Bright...
Beginners Guide to TikTok for Search - Rachel Pearson - We are Tilt __ Bright...Beginners Guide to TikTok for Search - Rachel Pearson - We are Tilt __ Bright...
Beginners Guide to TikTok for Search - Rachel Pearson - We are Tilt __ Bright...RachelPearson36
 

Featured (20)

2024 State of Marketing Report – by Hubspot
2024 State of Marketing Report – by Hubspot2024 State of Marketing Report – by Hubspot
2024 State of Marketing Report – by Hubspot
 
Everything You Need To Know About ChatGPT
Everything You Need To Know About ChatGPTEverything You Need To Know About ChatGPT
Everything You Need To Know About ChatGPT
 
Product Design Trends in 2024 | Teenage Engineerings
Product Design Trends in 2024 | Teenage EngineeringsProduct Design Trends in 2024 | Teenage Engineerings
Product Design Trends in 2024 | Teenage Engineerings
 
How Race, Age and Gender Shape Attitudes Towards Mental Health
How Race, Age and Gender Shape Attitudes Towards Mental HealthHow Race, Age and Gender Shape Attitudes Towards Mental Health
How Race, Age and Gender Shape Attitudes Towards Mental Health
 
AI Trends in Creative Operations 2024 by Artwork Flow.pdf
AI Trends in Creative Operations 2024 by Artwork Flow.pdfAI Trends in Creative Operations 2024 by Artwork Flow.pdf
AI Trends in Creative Operations 2024 by Artwork Flow.pdf
 
Skeleton Culture Code
Skeleton Culture CodeSkeleton Culture Code
Skeleton Culture Code
 
PEPSICO Presentation to CAGNY Conference Feb 2024
PEPSICO Presentation to CAGNY Conference Feb 2024PEPSICO Presentation to CAGNY Conference Feb 2024
PEPSICO Presentation to CAGNY Conference Feb 2024
 
Content Methodology: A Best Practices Report (Webinar)
Content Methodology: A Best Practices Report (Webinar)Content Methodology: A Best Practices Report (Webinar)
Content Methodology: A Best Practices Report (Webinar)
 
How to Prepare For a Successful Job Search for 2024
How to Prepare For a Successful Job Search for 2024How to Prepare For a Successful Job Search for 2024
How to Prepare For a Successful Job Search for 2024
 
Social Media Marketing Trends 2024 // The Global Indie Insights
Social Media Marketing Trends 2024 // The Global Indie InsightsSocial Media Marketing Trends 2024 // The Global Indie Insights
Social Media Marketing Trends 2024 // The Global Indie Insights
 
Trends In Paid Search: Navigating The Digital Landscape In 2024
Trends In Paid Search: Navigating The Digital Landscape In 2024Trends In Paid Search: Navigating The Digital Landscape In 2024
Trends In Paid Search: Navigating The Digital Landscape In 2024
 
5 Public speaking tips from TED - Visualized summary
5 Public speaking tips from TED - Visualized summary5 Public speaking tips from TED - Visualized summary
5 Public speaking tips from TED - Visualized summary
 
ChatGPT and the Future of Work - Clark Boyd
ChatGPT and the Future of Work - Clark Boyd ChatGPT and the Future of Work - Clark Boyd
ChatGPT and the Future of Work - Clark Boyd
 
Getting into the tech field. what next
Getting into the tech field. what next Getting into the tech field. what next
Getting into the tech field. what next
 
Google's Just Not That Into You: Understanding Core Updates & Search Intent
Google's Just Not That Into You: Understanding Core Updates & Search IntentGoogle's Just Not That Into You: Understanding Core Updates & Search Intent
Google's Just Not That Into You: Understanding Core Updates & Search Intent
 
How to have difficult conversations
How to have difficult conversations How to have difficult conversations
How to have difficult conversations
 
Introduction to Data Science
Introduction to Data ScienceIntroduction to Data Science
Introduction to Data Science
 
Time Management & Productivity - Best Practices
Time Management & Productivity -  Best PracticesTime Management & Productivity -  Best Practices
Time Management & Productivity - Best Practices
 
The six step guide to practical project management
The six step guide to practical project managementThe six step guide to practical project management
The six step guide to practical project management
 
Beginners Guide to TikTok for Search - Rachel Pearson - We are Tilt __ Bright...
Beginners Guide to TikTok for Search - Rachel Pearson - We are Tilt __ Bright...Beginners Guide to TikTok for Search - Rachel Pearson - We are Tilt __ Bright...
Beginners Guide to TikTok for Search - Rachel Pearson - We are Tilt __ Bright...
 

Anita File Two

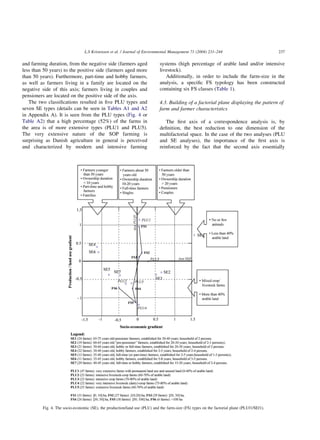
  • 1. and farming duration, from the negative side (farmers aged less than 50 years) to the positive side (farmers aged more than 50 years). Furthermore, part-time and hobby farmers, as well as farmers living in a family are located on the negative side of this axis; farmers living in couples and pensioners are located on the positive side of the axis. The two classifications resulted in five PLU types and seven SE types (details can be seen in Tables A1 and A2 in Appendix A). It is seen from the PLU types (Fig. 4 or Table A2) that a high percentage (52%) of the farms in the area is of more extensive types (PLU1 and PLU5). The very extensive nature of the SOP farming is surprising as Danish agriculture in general is perceived and characterized by modern and intensive farming systems (high percentage of arable land and/or intensive livestock). Additionally, in order to include the farm-size in the analysis, a specific FS typology has been constructed containing six FS classes (Table 1). 4.3. Building of a factorial plane displaying the pattern of farm and farmer characteristics The first axis of a correspondence analysis is, by definition, the best reduction to one dimension of the multifactorial space. In the case of the two analyses (PLU and SE analyses), the importance of the first axis is reinforced by the fact that the second axis essentially Fig. 4. The socio-economic (SE), the production/land use (PLU) and the farm-size (FS) types on the factorial plane (PLUf1/SEf1). L.S Kristensen et al. / Journal of Environmental Management 71 (2004) 231–244 237
  • 2. segregates the extreme individual farm characteristics from the medium ones (Gu¨ttman effect, see Legendre and Legendre, 1998). An ‘artificial plane’ built with the first factorial axis of each analysis, thus gives a satisfying representation of the main structure (main gradient) of the farm population regarding PLU characteristics on the one side, and SE characteristics on the other. This artificial plane is used in the following analysis as a ‘reference’ plane called the PLUf1/SEf1 plane. The plane is represented in Figs. 4 and 5, with a description in the margin of the SE and PLU gradients it displays. 4.4. Relationships between farm characteristics: FS, SE and PLU characteristics In order to explore the internal relationship between the three groups (SE, PLU, and FS) of individual farm characteristics, these groups were employed as supplementary variables in the PLU analysis and the SE analysis. The individual farm characteristics were plotted on the PLUf1/ SEf1 plane, at the crossing point of their co-ordinates along these two axes. The internal relationships among these characteristics were interpreted in two complementary ways: (1) the location of the farm types along each gradient (for example: the location of the PLU farm types along the SE gradient), (2) the proximity of different farm types to one another (for example, the proximity between certain PLU types and certain SE types) along the first or the second axis. Obviously, the PLU types and the SE types are well distributed along the PLUf1 axis and the SEf1 axis, respectively, as they are defined according to these axes (Fig. 4). The FS types are mainly distributed along the PLUf1 axis, i.e. the PLU gradient. The distance between the FS types and the PLU types along the PLUf1 axis confirms this relationship further. Farms with permanent land uses Fig. 5. The landscape change types (PC) on the factorial plane (PLUf1/SEf1). L.S Kristensen et al. / Journal of Environmental Management 71 (2004) 231–244238
  • 3. and unused land (PLU1) appear to be the smallest farms (FS1: less than 10 ha). Intensive crop farms with 70–80% of arable land (PLU3) appear to be linked to farms of 10–30 ha (FS2, FS3). The location of PLU3 at the origin of the PLUf1 axis can be explained by the fact that these farms have either no or few animals, or a high percentage of arable land: thus this group is between the two main tendencies expressed by each side of this axis. In the group of mixed crop–livestock farms (negative side of the PLUf1 axis), the FS increases from 30 to 50 ha (FS4) for the extensive livestock farms with 45–55% of arable land (PLU5) and the intensive crop–livestock farms with 60–70% of arable land (PLU2), 50–100 ha (FS5) for the very intensive crop–livestock (dairy) farms with 75–80% of arable land (PLU4). Finally, the farm population also includes a few very large farms of more than 100 ha (FS6). These seven farms are distributed among all the PLU types, but three of them belong to the type PLU5 (extensive livestock farms with 45–55% of arable land), explaining the location of FS6 close to PLU5 along the PLUf1 axis. Along the production/land use gradient (PLUf1 axis), we observe a segregation of the SE types of farms into two main groups. The positive side of the PLUf1 axis, corresponding to production systems with no or few animals and less than 40% of arable land, contains the oldest farmers with a long ownership duration (SE1) and the more recently established hobby farmers (SE4, SE6). The negative side of the PLUf1 axis, corresponding to a mixture of crop–livestock farms with more than 40% of arable land, contains the other SE types, which are primary full-time farmers of different ownership duration. The location of the farm types regarding FS and production systems along the SEf1 axis (SE gradient) do not add much information. The largest farms (FS6) and the intensive crop–livestock farms with 60–70% of arable land (PLU2), situated on the negative side of the axis, seem to be more associated with farmers younger than those of the intensive crop farms of 70–80% of arable land (PLU3), situated on the positive side. These results indicate that there are no unique types of PLU systems specifically associated with certain SE farm types. Rather, a diversity of production systems is found on farms exhibiting similar SE ‘profiles’. However, a relation- ship between SE and PLU characteristics exists at a more general level: full-time farmers appear to manage the largest farms, with a higher percentage of arable land, and crop– livestock farm systems, while the youngest hobby farmers and the oldest farmers appear to have more extensive and diverse farm systems, on smaller farms with or without livestock. 4.5. Relationships between landscape changes and farm and farmer characteristics The relationship between patterns of landscape changes at the farm level and farm and farmer characteristics has been assessed in the same way as described previously, i.e. by using the PC types as supplementary variables in the MCA ‘PLU’ and ‘SE’. The PC types are then plotted at the intersection of their co-ordinates along the PLUf1 and the SEf1 axis (Fig. 5). In the following interpretation, we have not accounted for the landscape change type PC2, which corresponds to only one farmer. The proximity of the different PC types to the origin of the two axes indicates that farms with diverse characteristics implement any combination of landscape changes. However, the two gradients of farm characteristics appear to segregate the PC types into a number of distinct groups. The PC types presenting no change (PC0) or land use abandonment (PC5, PC6) are located on the positive side of the SEf1 axis, which corresponds with the middle aged and older farmers. These types are segregated again by the PLUf1 axis. The PC5 type, dominated by land use abandonment, is located on the positive side of the PLUf1 axis and hence more related to small farms with a small percentage of arable land and no or few animals. On the contrary, the PC6 type, characterised by land use abandon- ment accompanied by hedgerow changes, is situated on the negative side of the PLUf1 axis, and hence more related to larger mixed crop–livestock farms. Finally, the group of no change (PC0) appears to be more related to SE factors than to PLU systems. The PC farm types mainly representing the hedgerow activities (PC1, PC3) are located on the negative side of this SEf1 axis, which corresponds to the younger farmers. It should be noticed that the type representing a higher rate of hedgerow change (PC1) is more significantly related to younger farmers than the type representing a lower rate hedgerows changes (PC3). These two types are also located in different places along the PLUf1 axis. The type representing the higher rate of hedgerow changes (PC1) is situated on the negative side of the PLUf1 axis and therefore related to the largest mixed crop–livestock farms (Fig. 4). In contrast, PC3 type, representing a lower rate of hedgerow change, is close to the origin of this axis, indicating that it is present in a variety of production systems. The remaining landscape change type, PC4, represents few diverse changes, the most notably being the conversion of arable land to permanent grassland. This activity appears to be related to the smaller farms with a low percentage of arable land and no or little livestock (location on the positive side of the PLUf1 axis). The location of this type close to the origin of the SEf1 axis indicates that this kind of change is linked to a diversity of SE profiles. A closer examination of the SE profile farmers of the PC4 type shows that a majority of the farmers are pensioners, hobby farmers and part-time farmers, half of them older than 50 years. L.S Kristensen et al. / Journal of Environmental Management 71 (2004) 231–244 239
  • 4. 5. Discussion 5.1. Landscape changes and the landscape change typology in SOP During the period investigated, we observed an overall increase in the wooded area (woods, small woodlands and Christmas tree plantations), permanent grassland and uncultivated land. The majority of these changes involved a conversion of arable land; the others involved abandon- ment of permanent land uses. These changes indicate an extensification of land use, as the changes were from higher input/output land use to lower input/output land use. In this context, it may be mentioned that extensification does not necessarily leads to an improvement of landscape from a nature conservation point of view. Extensification in the form of abandonment of permanent grassland may, for example, have damaging consequences for the biodiversity in farmed landscapes like SOP and this loss is not compensated for by the creation of new permanent grasslands. Intensification of land use has also taken place in the form of re-grassing/reuse of abandoned permanent grass- land, and ploughing up of permanent grassland. However, these changes made up a minor part (69 ha) compared to the total amount of patch changes (365 ha). In addition, the total length of hedgerows has increased, as has the number of ponds. Extensification trends and increases in the area and number of semi-natural landscape elements have been reported in other studies of Danish agricultural landscapes in the 1990s (Brandt et al., 2001; Kristensen, 1999; Kristensen et al., 2001; Primdahl, 1999). These results indicate that certain areas in Denmark are faced with a development more linked to post-productivism than pro- ductivism. However, none of these studies have demon- strated levels of landscape changes as high as in SOP. Whether the observed landscape changes in SOP may be interpreted as a response to the new farming conditions solely and thus indicate a change from productivism to post- productivism may, however, be questionable. On the one hand, extensification was found to dominate the landscape changes and some of these changes may obviously be interpreted as a kind of market/policy adjustments, e.g. the planting of Christmas trees (farm income diversification) and the conversion of arable land to grassland. Also land abandonment may be seen as an adjustment to the new farming condition; however, in the present case, it seems likely as well that these change processes are linked to retirement processes or redeployment of human resources outside the farm. Furthermore, the planting of very broad hedgerows, 4–6 rows (not needed to fulfil a shelter demand), as well as the creation of small woodlands, and ponds (without any agricultural purpose) suggest that a new kind of environmental interest exists among modern farmers. On the other hand, we know from analysis of topographical maps that afforestation and planting of small woodlands on arable land as well as hedgerow planting have taken place at least since the Second World War, so these trends are in fact not new. This suggests that some of the observed changes may be a part of a tradition of the area, probably linked to poor soil conditions and to a lesser degree a response to the current changes in the agricultural and environmental policies. High levels of wildlife habitat creation on poor soil types have also been reported by Battershill and Gilg (1996). They largely saw this as results of the agricultural marginality of these areas and the resulted tendency towards more extensive farming systems. The dominance of more extensive farm systems is also recognized in SOP, where the livestock density is low compared to the Danish average and a high percentage of the total agricultural land (30%) is covered by more extensive land uses. The patterns of landscape changes on farms are not very well structured among the whole population, meaning that the same kind of change is represented in more landscape change groups. This may be due to the fact that hedgerow activities are much more dominant than other changes and that most farmers are involved in only one (if planting and removal of hedgerow is seen as one activity) or two landscape changes, instead of a combination of changes. 5.2. Farm and farmer characteristics and their inter-relationships The most obvious result of the analysis of the relationships between different farm and farmer character- istics is the close relationship between FS and the PLU characteristics of farms. We observe a gradient of increasing FS, which closely follows the main gradient of farming (an increase in the amount of arable land). This gradient ranges from farms with a land use consisting of permanent land use and unused land (farms of less than 10 ha), to mixed crop– livestock farms with 75–80% of arable land (farms of 50– 100 ha). A similar relationship between FS and the amount of arable land has been reported by Adams et al. (1994). The gradient of PLU characteristics and related FS segregates the SE farmer types into two main groups: a group predominated by the youngest hobby farmers and the pensioners corresponding to small to medium extensive farms, and a group including full-time farmers of different ages and middle aged hobby farmers (40–60 years), who run more intensive farms. The relationship between hobby farmers and pensioners and more extensive farms may be explained by the fact that these groups often implement a more extensive farming system, because their human capital is reduced (due to work off the farm or old age) (Potter and Lobley, 1992). These results show that relationships between the main production/FS characteristics and SE characteristics of the farm population can be identified. However, we did not find L.S Kristensen et al. / Journal of Environmental Management 71 (2004) 231–244240
  • 5. close relationships between specific types of production systems and related FS, and specific SE types: hobby farmers, for example, manage all types of farms, but small farms are mostly managed by hobby farmers or pensioners. This may be due to a great variation in FS for pensioners, hobby farmers and full-time farmers, a result also reported by Gasson (1986). 5.3. Relationships between landscape changes and farm and farmer characteristics The landscape change types are segregated according to the main SE and PLU gradients of the farm population. However, no strong and unique (simple) relationship could be identified (Fig. 5). The age of the farms and farmers, which characterises the main SE gradient of the farm population, seems generally to have the major influence on landscape changes. ‘No change’ and land use abandonment (PC5 and PC6) are common among middle aged and older farmers, while planting and removal of hedgerows are more common among younger farmers. ‘No change’ and land use abandonment performed by farmers close to retirement may be linked to the fact that these farmers often wish to reduce the working time on the farm and reduce the scale of operations (Potter and Lobley, 1992). In contrast, hedgerow activity is performed by younger farmers and farmers with shorter ownership duration, who still organise/re-organise their farms in order to meet their production and amenity needs. These results support earlier studies of, for example Wilson (1992) and Potter and Lobley (1992), who found that landscape changes were linked to the age of farmers and the duration of the farm ownership. There seems to be certain kind of links between the main SE features of the farm population and the PLU system and the undertaken landscape changes. Farmers in the same age category are engaged in different combinations of landscape changes that correspond to different kinds of PLU profiles. For example, for the older farmers (PC5 and PC6), the amount of land abandonment is higher on small extensive farms (up to 8 ha) (PC5) than on more intensive mixed crop– livestock farms (no more than 5 ha). This means that the most extensive farms are becoming even more extensive. In addition the landscape change type PC4, correspond- ing to diverse changes (mainly conversion of arable to permanent grassland, but also the reverse), is most commonly found on farms with a more extensive production system, owned by both young hobby farmers and pen- sioners. This landscape change type may be interpreted differently depending on the farmers’ SE profile: as a trend towards extensification for most of the young hobby farmers and the pensioners and as a trend towards intensification for a few hobby farmers, probably those who intend to make a living from farming. The PC1 and PC3 landscape change types, dominated by hedgerow planting and removal, are related to intensive mixed crop–livestock farms managed by younger farmers. Within these groups, the size of the hedgerow changes is positively related to the FS. These results indicate that landscape changes to a certain degree are influenced by the SE environment of the farmers, but it also appears that many of the changes are implemented in order to fit into already existing farm territories, which have been designed for the purpose of certain management and production objectives by farmers. The lack of a general and strong relationship between the different farm level characteristics and landscape changes in the present study, is in contrast to results of other studies, e.g. Munton et al. (1989) who found that hobby/part-time farmers did less harm to the landscape than full-time farmers. This inconsistency may partly be linked to the earlier mentioned tradition of hedgerow planting in the area, which includes nearly all different types of farmers and farms. In addition, modern full-time farmers may be more aware of the non-production functions of the landscape due to the general attention these issues have obtained recently, which makes their behaviour less different from hobby farmers. Such concordance of objectives of different farmer groups may explain why we are unable to identify a strong correlation between farm level characteristics and landscape changes. 5.4. The statistical methods As other multivariate analyses of the same family, MCA are able to analyse gradients of information and their relationships. Gradients are very common in situations where no great contrasts exist in the physical environment, or in the SE and production profiles of farms, and where many factors are partly correlated (Thenail, 2002). In these situations, it is difficult to find one or few variables such as younger–older farmer or full-time hobby farmer (Potter and Lobley, 1992; Munton et al., 1989, Wilson, 1997) that significantly summarise the relationships between farms and the landscape and to find significant correlations between pairs of variables, by the use of cross-tabulations and chi- square test. A general limitation of the MCA method is the difficulty in interpretation of the visualisation of the information on the different planes, especially if the objects are close to each other and to the axes on the planes. However, at the same time it is an asset of the method that it enables the observation and analysis of even low structured relation- ships. The combinations of clustering and MCA, with the superposition of the clusters (the types) as supplementary variables on the planes they come from, greatly facilitate the interpretation of the planes (Lebart et al., 1995). In the present study, the use of supplementary variables on the planes, which they do not participate to the building of, allowed the assessment of linkages between the different sets of information (Lebart et al., 1995). The significance of the distance between the supplementary variables L.S Kristensen et al. / Journal of Environmental Management 71 (2004) 231–244 241
  • 6. and the axes of the planes can be assessed with a test value (Lebart et al., 1995), which has been used successfully in Kristensen et al. (2001) and Thenail (2002). Assessment with a test value has not been done in the present study, as the number of farms were too few, regarding the structure of relationships between farm characteristics and landscape changes. 6. Conclusions The post-productivist transition includes the creation of environmental goods and extensification of the land use on a general level. The results of this study show that extensification is the dominant land use trend, and that creation of landscape elements like hedgerows and ponds are much more widespread than their removal. Despite these general trends, however, important landscape elements such as permanent grassland are still being destroyed as a result of abandonment or cultivation. This indicates that new public efforts are needed, if such landscape elements are to be sustained. It cannot be concluded from the survey that the observed landscape changes are a unique result of a change from productivism to post-productivism in farming. On the contrary, it seems likely that a combination of factors, some of which are outside the range of investigated farm level characteristics, have influenced farmers’ decision- making process. A long tradition in the study area for hedgerow planting and creation of woods and small woodlands, probably related to the poor soil condition of the area, is an example of such factors outside the farm level characteristics, which may have influenced the observed landscape changes. We hypothesized from the outset of the study that a relationship between farm characteristics and patterns of landscape changes could be identified. However, despite a successful identification of a variety of farm and farmer types and landscape changes, the analysis of the relationship between farm level characteristics and landscape changes shows no strong relationship. On this background, we conclude that the observed landscape changes take place on a variety of farms and by a variety of farmers. This suggests that information campaigns, incentives schemes and other initiatives implemented within the domain of the public Table A2 Description of farm types according to the production and the land use characteristic Type Description of production and land use PLU1 very extensive farms These farms correspond to small farms with a very extensive land use. The land use is mainly permanent grassland, woodland and unused areas. The proportion of unused area is 20–50% of the farm area. The farm size is 5–20 ha. Among the seven farms having Christmas trees in Sønder Omme, three belong to this group. They have mainly no animals. However, if they have animals they are beef cattle or sheep (six sheep herds on a total of 10 belong to farms of this type) PLU2 medium sized intensive livestock or crop farms These farms correspond to medium crop–livestock farms with 60–70% of arable land. The proportion of permanent grassland is less than 20%, and the proportion of cereals is of 40–70%. 55% of farms have livestock, mainly dairy cows and beef cattle (partly on pasture). The farm size is medium, ranging from 25 to 50 ha PLU3 small intensive crop farms This group mainly corresponds to smaller specialised crop farms (cereal-growing). In general, the farms are without animals, but in cases of animals the livestock is pigs or beef cattle reared in buildings. All farms have very high percentage of arable land (70–80% of the farm area). The farm size is 20–30 ha PLU4 intensive livestock farms The farm type corresponds to large livestock (dairy)- crop farms of more than 70% of arable land. The crop production is cereals (40–50% of the land), but also 8–20% of other cash crops. The proportion of permanent grassland in these farms is low (5–12%). Only 4% of these farms have no livestock. Fifty-six percent are dairy farms and 17% have beef production. The proportion of grass and green fodder is variable (0–35%), meaning that the feeding of the animal is completed by purchased fodder PLU5 extensive livestock or other extensive farms This farm type corresponds to livestock-crop farms of less than 50% of arable land. The proportion of permanent grassland is more than 20%, and the proportion of cereals is 25–45%. The livestock farms are mainly dairy farms and beef production farms (partly on permanent grassland). The variations in farm size big, ranging from 20 to 75 ha Table A1 Description of farmer types according to the socio-economic characteristics Type Socio-economic characteristics SE1 Mainly pensioners, 65–75 years old, established for 30–40 years and with a household of two persons. Mostly grown up in the countryside SE2 Pre-pensioners, 60–65 years old and established for 20–30 years. Their occupation is diverse with 47% full time farmers and 32% part time/hobby farmers. Half of the group has a household of two persons SE3 Middle-age farmers, 50–60 years, established for 20–30 years. Partly full time, partly hobby farmers living in households of two persons SE4 Younger hobby farmers, 30–40 years old, established for 2–5 years and with a household of 2–4 persons. Half of the farmers are grown up in a city and half of them in the countryside. This group includes the highest proportion of persons grown up in the city SE5 Younger farmers, 35–40 years and established for 2–5 years. Full time farmers dominate the group (65%) and nearly half of the households consist of one person SE6 35–45 years old hobby farmers, established for 5–8 years, with a household of 3–5 persons SE7 Well-established farmers (15–20 years), 40–45 year old, with a household of 2–4 persons. 48% of the group are full time farmers and 34% hobby farmers L.S Kristensen et al. / Journal of Environmental Management 71 (2004) 231–244242
  • 7. planning in order to encourage the improvement and enhancement of the values of the landscape may be targeted all kind of farm and farmer types. Appendix A Tables A1 and A2. References Adams, W.M., 1996. Future Nature. A Vision for Conservation, Earthscan Publications Ltd, London. Adams, W.M., Hodge, I.D., Bourn, N.A.D., 1994. Nature conservation and the management of the wider countryside in Eastern England. Journal of Rural Studies 10, 147–157. Agger, P., Brandt, J., 1988. Dynamics of small biotopes in Danish agricultural landscapes. Landscape Ecology 1, 227–240. Baldock, D., Beaufoy, G., Godeschalk, F., 1996. Farming at the Margins. Abandonment or Redeployment of Agriculture Land in Europe, IEEP and LEI-DLO, London. Barr, C.J., Bunce, R.G.H., Clarke, R.T., Fuller, R.M., Furse, M.T., Gillespie, M.K., Groom, G.B., Hallam, C.J., Hornung, M., Howard, D.C., Ness, M.J., 1993. Countryside Survey 1990. Main Report, The Department of the Environment, London. Battershill, M.R.J., Gilg, A.W., 1996. New approaches to creative conservation on farms in South-west England. Journal of Environmen- tal Management 48, 321–340. Baudry, J., 1991. Ecological consequences of grazing extensification and land abandonment: role of interactions between environment, society and techniques. Option Me´diterrane´enes, Se´rie Se´minaires 15, 13–19. Bowler, I., 1992. Sustainable agriculture as an alternative path of farm business development. In: Bowler, I.R., Bryant, C.R., Nellis, M.D. (Eds.), Contemporary Rural Systems in Transition, vol. 1, Agriculture and Environment, CAB International, Wallingford, pp. 237–253. Bowler, I., Ilbery, B., 1999. Agricultural land-use and landscape change under the post-productivist transition—examples from the United Kingdom. In: Kro¨nert, R., Baudry, J., Bowler, I., Reenberg, A. (Eds.), Land-use Changes and their Environmental Impact in Rural Areas in Europe, The Parthenon Publishing Group, Paris, pp. 121–140. Brandt, J., Primdahl, J., Reenberg, A., 1999. Rural land-use and landscape dynamics—analysis of ‘driving forces’ in space and time. In: Kro¨nert, R., Baudry, J., Bowler, I.R., Reenberg, A. (Eds.), Land-use Changes and their Environmental Impact in Rural Areas in Europe, UNESCO and the Parthenon Publishing Group, Paris, pp. 81–102. Brandt, J., Holmes, E., Agger, P., 2001. Integrated monitoring on a landscape scale—lessons from Denmark, In: Strategic Landscape Monitoring for the Nordic Countries, Nordic Council of Ministers, Stockholm, pp. 31–41. Buller, H., Wilson, G.A., Ho¨ll, A. (Eds.), 2000. Agri-environmental Policy in the European Union, Ashgate Publishing Limited, Aldershot. Danmarks Statistik, 1996. Landbrugsstatistik 1995, Danmarks Statistik, København. Gasson, R., 1986. Part-time farming: its place in the structure of agriculture. In: Cox, G., Lowe, P. (Eds.), Agriculture: People and Policies, Allen & Unwin, London, pp. 77–92. Gasson, R., Potter, C., 1988. Conservation through land diversification: a survey of farmers’ attitudes. Journal of Agricultural Economics 39, 340–351. Ihse, M., 1995. Swedish agricultural landscapes—patterns and changes during the last 50 years, studied by aerial photos. Landscape and Urban Planning 31, 21–37. Ilbery, B.W., 1990. The challenge of land redundancy. In: Pinder, D., (Ed.), Western Europe: Challenge and Change, Belhaven Press, London, pp. 211–225. Ilbery, B., Bowler, I., 1998. From agricultural productivism to post- productivism. In: Ilbery, B., (Ed.), The Geography of Rural Change, Longman, Essex, pp. 57–84. Ilbery, B., Chiotti, Q., Rickard, T., 1997. Introduction. In: Ilbery, B., Chiotti, Q., Rickard, T. (Eds.), Agricultural Restructuring and Sustainability. A Geographical Perspective, CAB International, Wall- ingford, pp. 1–9. Jacobsen, N.H., 1975. Natural-geographical regions of Denmark. Geo- grafisk Tidsskrift 75, 1–6. Kristensen, S.P., 1999. Agricultural land use and landscape changes in Rostrup, Denmark: processes of intensification and extensification. Landscape and Urban Planning 46, 117–123. Kristensen, S.P., Thenail, C., Kristensen, L., 2001. Farmers’ involvement in landscape activities: an analysis of the relationship between farm location,farmcharacteristicsandlandscapechangesin two studyareasin Jutland, Denmark. Journal of Environmental Management 61, 301–318. Lambin, E.F., Rounsevell, M.D.A., Geist, H.J., 2000. Are agricultural land- use models able to predict changes in land-use intensity? Agriculture Ecosystems and Environment 82, 321–331. Lebart, L., Morineau, A., Piron, M., 1995. Statistique exploratoire multidimensionnelle, Dunod, Paris. Lebeaux, M.O., 1985. ADDAD, Association pour le De´veloppement et la Diffusion de l’Analyse des Donne´es, Multigraph, Paris. Legendre, P., Legendre, L., 1998. Numerical Ecology, Second English ed., Elsevier, Amsterdam. Marsden, T., 1995. Beyond agriculture? Regulating the new rural spaces. Journal of Rural Studies 11, 285–296. Marsden, T., 1998. New rural territories: regulating the differentiated rural spaces. Journal of Rural Studies 14, 107–117. Marsden, T., Murdoch, J., Lowe, P., Munton, R., Flynn, A., 1993. Constructing the Countryside, UCL Press, London. McDowell, C., Sparks, R., 1989. The multivariate modeling and prediction of farmers’ conservation behavior towards natural ecosystems. Journal of Environmental Management 28, 185–210. McQuitty, L.L., 1966. Single and multiple classification by reciprocal pairs and rank order type. Educational Psychology Measurements 26, 253–265. Munton, R.J., Whatmore, S.J., Marsden, T.K., 1989. Part-time farming and its implications for the rural landscape: a preliminary analysis. Environment and Planning A 21, 523–536. Potter, C., 1994. Cultural landscapes in flux: an approach to understanding the processes of change. Landscape Issues 11, 59–63. Potter, C., Lobley, M., 1992. Ageing and succession on family farms: the impact on decision-making and land use. Sociologia Ruralis 32, 317–334. Potter, C., Lobley, M., 1996. The farm family life cycle, succession paths and environmental change in Britain’s countryside. Journal of Environmental Management 47, 172–190. Potter, C., Edwards, A., Gasson, R., Green, B., 1991. The Diversion of Land. Conservation in a Period of Farming Contraction, Routledge, London. Primdahl, J., 1999. Agricultural landscapes as places of production and for living in owner’s versus producer’s decision making and the implications for planning. Landscape and Urban Planning 46, 143–150. Rønningen, K., 1993. Agricultural policies and landscape management. Some examples from Norway, Great Britain and Germany. Norsk Geografisk Tidsskrift 47, 93–104. Rønningen, K., 1999. Agricultural Policies and Countryside Management. A Comparative European Study. Dr Polit Thesis. Department of Geography, Faculty of Science and Technology Management, Norwe- gian University of Science and technology, Trondheim. Shucksmith, M., 1993. Farm household behaviour and the transition to post-productivism. Journal of Agricultural Economics 44, 466–478. L.S Kristensen et al. / Journal of Environmental Management 71 (2004) 231–244 243
  • 8. Thenail, C., 2002. Relationships between farm characteristics and the variation of the density of hedgerows at the level of a micro-region of bocage landscape. Study case in Brittany, France. Agricultural System 71, 207–230. Wilson, G.A., 1992. A survey on attitudes of landholders to native forest on farmland. Journal of Environmental Management 34, 117–136. Wilson, G.A., 1996. Farmer environmental attitudes and ESA participation. Geoforum 27, 115–131. Wilson, G.A., 1997. Factors influencing farmer participation in the environmentally sensitive areas scheme. Journal of Environmental Management 50, 67–93. Wilson, G.A., 2001. From productivism to post-productivism… and back again? Exploring the (un)changed natural and mental landscapes of European agriculture. Transactions of the Institute of British Geogra- phers 26, 77–102. Working group SCOPE, 1997. SCOPE Pilot Study on Co-regional Planning in Europe, Netherlands National Spatial Planning Agency, The Hague. L.S Kristensen et al. / Journal of Environmental Management 71 (2004) 231–244244