
Recomendados
Mais conteúdo relacionado
Mais de guest20ee0
Último
Último (20)
Tmd010709 Evening Edition
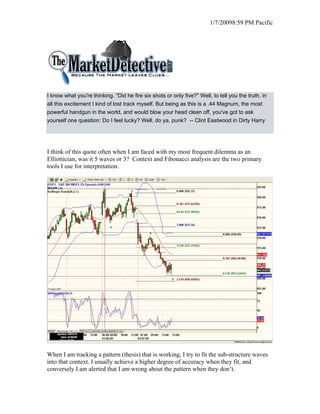
- 1. 1/7/20098:59 PM Pacific I know what you're thinking. quot;Did he fire six shots or only five?quot; Well, to tell you the truth, in all this excitement I kind of lost track myself. But being as this is a .44 Magnum, the most powerful handgun in the world, and would blow your head clean off, you've got to ask yourself one question: Do I feel lucky? Well, do ya, punk? -- Clint Eastwood in Dirty Harry I think of this quote often when I am faced with my most frequent dilemma as an Elliottician, was it 5 waves or 3? Context and Fibonacci analysis are the two primary tools I use for interpretation. When I am tracking a pattern (thesis) that is working, I try to fit the sub-structure waves into that context. I usually achieve a higher degree of accuracy when they fit, and conversely I am alerted that I am wrong about the pattern when they don’t.
- 2. 1/7/20098:59 PM Pacific I also rely heavily on Fibonacci analysis using the most probable (common) retracement and extension levels of waves to fine tune my counts. The Cash market on a 15 minute chart looks like we either completed 5 waves or have one more sub-wave to go to complete the 5th wave. If there is one more sub-wave down, I think that 898 -896 is the low for that wave. Looking at the chart, wave 3 is a 1.618 extension of wave 1, and wave 5 is a .618 extension of waves 1-3. Furthermore, wave 1 and wave 5 are almost the same size. This is textbook symmetry for a 5 wave motive wave. The probability is higher that this is 5 waves in progress rather than a completed 3 wave correction down in the cash market. It is important to be correct at this juncture. In reference to the cash thesis from last night we are (already) sitting on the 50% retracement level and the ideal turning point to launch the extension up. If we have completed or are close to completing 5 waves down, then we will probably retrace back to the 920 area then complete another 5 waves down in the context of a triple zigzag pattern that matches the futures. If it is 3 waves completed and we turn back up then the blue path tells the story.
- 3. 1/7/20098:59 PM Pacific The futures are not totally in agreement. While I can get a clear 5 waves down on a 60 minute chart with good ratios (not shown), on my favorite higher level charts (233/377 min) it is less clear and shows an ominous potential to extend down to 891-893 as shown by the red arrow. If the current low holds, then the probable path is traced out as shown. If 891 is tagged, then I show a different probability path. The common theme is that the trend line holds when we get there. In reconciling the futures and the Cash that is probably the spread, but my bias is with the futures if there is further downside for target accuracy. In summary, my bias is for 5 waves in progress, but the most probable options in the context of my greater thesis are all on the table. TMD/DW The market detective provides personal market opinion based on sound technical analysis and research. However, no warranty is given or implied as to its true reliability. The market detective will make errors and mistakes. The market detective is not an investment adviser and is not making recommendations to buy, sell, or place orders relating to the futures contracts, ETFs, or stocks that he writes about. The responsibility for decisions made from information contained in this service are solely that of the individual subscriber. The individual must fully research and make his/her own decisions before acting on any information provided by the market detective. The market detective assumes no responsibility for subscriber investment or trading results.