
Recomendados
Mais conteúdo relacionado
Mais procurados
Mais procurados (20)
Semelhante a Jmeter interviewquestions
Semelhante a Jmeter interviewquestions (20)
Último
Último (20)
Jmeter interviewquestions
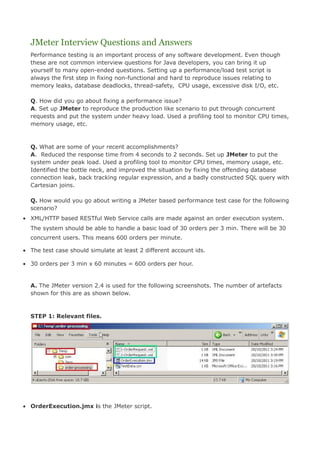
- 1. JMeter Interview Questions and Answers Performance testing is an important process of any software development. Even though these are not common interview questions for Java developers, you can bring it up yourself to many open-ended questions. Setting up a performance/load test script is always the first step in fixing non-functional and hard to reproduce issues relating to memory leaks, database deadlocks, thread-safety, CPU usage, excessive disk I/O, etc. Q. How did you go about fixing a performance issue? A. Set up JMeter to reproduce the production like scenario to put through concurrent requests and put the system under heavy load. Used a profiling tool to monitor CPU times, memory usage, etc. Q. What are some of your recent accomplishments? A. Reduced the response time from 4 seconds to 2 seconds. Set up JMeter to put the system under peak load. Used a profiling tool to monitor CPU times, memory usage, etc. Identified the bottle neck, and improved the situation by fixing the offending database connection leak, back tracking regular expression, and a badly constructed SQL query with Cartesian joins. Q. How would you go about writing a JMeter based performance test case for the following scenario? • XML/HTTP based RESTful Web Service calls are made against an order execution system. The system should be able to handle a basic load of 30 orders per 3 min. There will be 30 concurrent users. This means 600 orders per minute. • The test case should simulate at least 2 different account ids. • 30 orders per 3 min x 60 minutes = 600 orders per hour. A. The JMeter version 2.4 is used for the following screenshots. The number of artefacts shown for this are as shown below. STEP 1: Relevant files. • OrderExecution.jmx is the JMeter script.
- 2. • 1-OrderRequest.xml and 2-OrderRequest.xml are the two sample XML payloads that will be sent via an HTTP POST (RESTful Web service). • TestData.csv is a data file used for retrieving values 1 & 2 to switch between 1- OrderRequest.xml and 2-OrderRequest.xml to simulate 2 different accounts. 1-OrederRequest.xml <?xml version="1.0" encoding="UTF-8"?> <OrderRequest> <accountId>12345</accountId> <quantity>150</quantity> <unitPrice>12.50</unitPrice> </OrderRequest> 2-OrederRequest.xml <?xml version="1.0" encoding="UTF-8"?> <OrderRequest> <accountId>6789</accountId> <quantity>200</quantity> <unitPrice>6.50</unitPrice> </OrderRequest> TestData.csv 1 2 STEP 2: JMeter scripts If you open the OrderExecution.jmx script file, you will see something like this.
- 3. Lets' go through each of the elements. Thread Groups are equivalent of virtual users in other performance testing system. You can add this element by right clicking on the test plan and then selecting Add --> Threads (Users) --> Thread Group. As per the requirements, the system should handle 30 concurrent users. The ramp up time is 180 seconds, which is 3 minutes. All 30 threads will get started in 3 minutes. The loop count is set to 20, to produce 600 orders (i.e. 30 threads * 20 loops) . It is a good practice to define some variables as shown below, so that these variables can be used in downstream elements without having to hard code. If you want to run against a different host, you can just change it in spot as opposed to having to change it in a number of places. You can add this by right clicking on "Order Processing" and then selecting Add --> Config Element --> User Defined Variables.
- 4. The CSV Data Config is a very useful element to read test data from CSV file and then save the read values into some variable. In this example, the values 1 and 2 are read from the file TestData.csv, and stored in a variable named "account". The one iteration will set account to 1, and the next iteration will set it to 2, and then the same assigment repeats since "recycle on EOF" is set to true. The HTTP Header manager sets the HTTP headers. In this example, the content type is set to application/xml because we are posting the XML files 1-OrderRequest.xml & 2- OrderRequest.xml .
- 5. The HTTP request defaults sets the default values so that you don't have to repeat it in each request. Also, note that the user defined variables in the first step are used within $ {} as opposed to literal values. The loop controller can be added to loop through the samplers a number of times. In this example, it is set to 1. The samplers can be added by right clicking on the "Create Order" loop controller and then selecting Add --> Sampler --> HTTP Request. It shows the path, method, and the file to send. The actual RESTFul web service call will have the URL http://localhost:8080/myapp/executionservices/execution/1.0/order/create
- 6. Also, note that in the File Path the ${DATA_PATH} is a user defined value, and ${account} is a variable that is assigned from the TestData.csv file via the CSV Data Config element. The account will be dynamically changed between 1 and 2 to retrieve the files 1- OrderRequest.xml and 2-OrderRequest.xml respectively for each iteration. JMeter supports a number of samplers like SOAP request, FTP request, JDBC request, JMS publisher, JMS subscriber, etc to name a few. The XPath assertions are used to assert the response for presence of responseCode="SUCCESS" and a valid orderId > 0. The response message will look like <?xml version="1.0" encoding="UTF-8" standalone="yes"?> <OrderResponse> <orderId>50045671</orderId> <responseCode>SUCCESS</responseCode> </OrderResponse>
- 7. The other three elements are reporting elements. There are many reporting elements to choose from depending on the requirements. You can add reporting elements via Add --> Listener. Finally the Gaussian Timer that will delay the execution by 3 minutes (i.e. 180000 ms) with a standard deviation of 10 seconds. This will ensure the throuput of 30 orders per 3 minutes.
- 8. Q. How would you go about automatically recording the your browser actions into JMeter? A. This can be achieved 2 ways. • Use BadBoy, which is a tool to record your Web interactions.The recorded script can be exported as a JMeter file with the extension .jmx to be imported into JMeter. The generated script will not be pretty, but it can be cleaned up and further extended within JMeter with user defined variables, CSV data config, HTTP defaults, etc. You can record the script as you use your application.
- 9. • Use JMeter as an HTTP proxy server to record your browser actions.Firstly, set up your JMeter to act as a proxy server on an available port like say 9090 as shown below. Configure the proxy server as shown below:
- 10. • Port: 9090 • Target Controller indicates where to record. In the above diagram indicates to capture it in the WorkBench under the proxy server itself. This allows you to later on move the captured elements one by one into the TestPlan. • You don't want to capture everything. So, filter it with include and exclude patterns. For example, Include: .*myapp.*, Exclude: .*.jpg. • "Start" the proxy server. You need to set up your browser to use this proxy server.
- 11. Finally, start using the browser to record your actions. For example, you could use the following URL http://myhost:7001/myapp/home Note: If you use localhost instead of myapp as the host, JMeter may not record your actions. To overcome this, type ipconfig on your DOS prompt and copy the local IP address and use that instead of localhost in your URL. Q. What are Pre-Processor and Post-Processor elements? In what order does JMeter process various type of elements? A. A Pre-Processor executes some action prior to a Sampler Request being made. If a Pre-Processor is attached to a Sampler element, then it will execute just prior to that sampler element running. A Pre-Processor is most often used to modify the settings of a Sample Request just before it runs, or to update variables that aren't extracted from response text. A Post-Processor executes some action after a Sampler Request has been made. If a Post-Processor is attached to a Sampler element, then it will execute just after that sampler element runs. A Post-Processor is most often used to process the response data, often to extract values from it. A Regular Expression Extractor can be used as a Post-Processor element to extract values to be used elsewhere in subsequent requests. For example, if you are using JSF and Seam frameworks, the jsfViewState and CID values can be extracted as shown below:
- 12. The elements are executed in the following order as per the JMeter documentation. 0. Configuration elements 1. Pre-Processors 2. Timers 3. Sampler 4. Post-Processors (unless SampleResult is null) 5. Assertions (unless SampleResult is null) 6. Listeners (unless SampleResult is null) Timers, Assertions, Pre- and Post-Processors are only processed if there is a sampler to which they apply. Logic Controllers and Samplers are processed in the order in which they appear in the tree. Other test elements are processed according to the scope in which they are found, and the type of test element. Q. What are some of the challenges you faced with JMeter? A. • If a subsequent request rely on the cookie set by the previous request, the "cookie manager" element is required.
- 13. • When setting up the "CSV Data Set Config", don't have any spaces in the variable names. Q. Have you used any features of JMeter that gave you greater flexibility? A. Yes. The JMeter supports BeanShell scripting for greater flexibility. The BeanShell is a small, free, embeddable Java source interpreter with object scripting language features, written in Java. If you want to output all the order ids extracted out of the response messages for the response messages shown below <OrderResponse> <orderId>50013914</orderId> <responseCode>SUCCESS</responseCode> </OrderResponse> An XPath Extractor can be used to extract the "orderId" from the response message and store it in a variable named "orderId" as shown below. Now, the BeanShell PostProcessor can use the extracted "orderId" variable and write to a file (e.g. C:Temporder-processingid.txt ) as shown below.
- 14. You could do a lot more powerful things by writing your own embedded scripting with the BeanShell. For example, You can create your own file named MyBeanShell.bshr and copy it to $JMETER_HOMEbin folder. The MyBeanShell.bshr will have functions like getReportStartDate() { import java.text.SimpleDateFormat; cal = Calendar.getInstance(); cal.add(Calendar.DATE, -10); sdf = new SimpleDateFormat("dd-MMMM-yyyy"); return sdf.format(cal.getTime()); } isTenth(int loopCounter) { returnValue = false; if (loopCounter % 10 == 0) { returnValue = true; } return returnValue; }
- 15. You could invoke these functions from your JMeter elements like ${__BeanShell(return getReportStartDate();)} Also, note that pre-defined functions like __time can be used as shown above. There are also handy JMeter plugins from Google code at http://code.google.com/p/jmeter- plugins/ containing useful functions, listeners, samplers, etc. Just download the zip file and extract the "JMeterPlugins.jar" into $JMETER_HOMElibext folder. This plugin features are prefixed with jp@gc. Finally, instead of BeanShell or simple functions out of the box like __time, you could also write your own Java based custom functions using the org.apache.jmeter.functions.Function interface by writing your function as described here http://gabenell.blogspot.com/2010/01/custom-functions-for-jmeter.html. Q. How do you ensure re-usability in your JMeter scripts? A. • Using config elements like "CSV Data Set Config", "User Defined Variables", etc for greater data reuse. • Modularizing shared tasks and invoking them via a "Module Controller". • Writing your own BeanShell functions, and reusing them.