TWITTER DCF Valuation Model Template Wallstreethacks.com
•
5 gostaram•3,797 visualizações

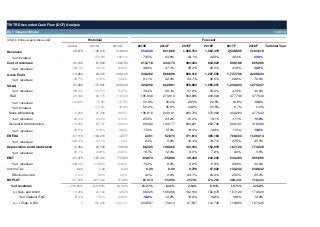
DOWNLOAD @ wallstreethacks.com The following is a Discounted Cash Flow Analysis of Twitter (TKR: TWTR). The model is a template and assumptions can easily be edited to derive different equity values. Based on data from the S1 filing and our own assumptions; the model shows a share price of $11.84 or a company equity value of $7.4 Bil. http://wallstreethacks.com/downloads/twitter-twtr-dcf-valuation-model-xlsx/

Recomendados
Mais conteúdo relacionado
Destaque
Destaque (15)
Mais de gazhoo
TWITTER DCF Valuation Model Template Wallstreethacks.com
- 1. TWTR Discounted Cash Flow (DCF) Analysis DCF Valuation Model 11.07.13 Historical (USD in '000s, except p/share units) 2010A 2011A 28,278 Revenues 2012A 316,933 2013E 550,000 2014F 901,068 2015F 2016F 2017F 2018F 1,388,753 1,952,479 2,546,895 3,183,618 276.0% 198.1% 73.5% 63.8% 54.1% 40.6% 30.4% Cost of revenues 61,803 128,768 213,718 334,173 490,434 654,923 809,188 955,085 % of revenues 152.7% 58.1% 40.6% 38.9% 37.1% 35.3% 33.5% 31.8% 44,510 188,165 336,282 566,896 898,319 1,297,556 1,737,706 2,228,533 -52.7% 41.9% 59.4% 61.1% 62.9% 64.7% 66.5% 68.2% 70.0% 52,589 171,921 265,248 420,256 622,891 858,889 1,065,351 1,204,223 1,273,447 186.0% 161.7% 83.7% 76.4% 69.1% 61.8% 54.6% 47.3% 40.0% 29,348 80,176 119,004 185,848 270,613 364,885 439,624 477,749 477,543 103.8% 75.4% 37.5% 33.8% 30.0% 26.3% 22.5% 18.8% 15.0% 173.2% 48.4% 56.2% 45.6% 34.8% 20.5% 8.7% 3,183,618 30.0% -14,890 Terminal Year 25.0% 43,168 0.0% % of increase Gross Profit % of revenues SG&A % of revenues R&D % of revenues - 106,313 Forecast % of increase Sales & Marketing % of revenues General & Administrative 6,289 25,988 86,551 138,916 209,101 293,783 372,982 434,283 24.4% 27.3% 25.3% 23.2% 21.2% 19.1% 17.1% 65,757 59,693 95,492 143,177 200,221 252,746 292,191 318,362 % of revenues Depreciation and Amortization % of revenues EBIT % of revenues Income Tax Effective tax rate NOPLAT % of revenues (+) Dep. and Amort % of Capex & R&D (+/–) Chgs. in WC. 59.9% 61.9% 18.8% 17.4% 15.9% 14.4% 12.9% 11.5% 10.0% -57,115 -103,219 -4,577 2,351 52,070 171,614 385,183 700,603 1,129,414 -202.0% -97.1% -1.4% 0.4% 5.8% 12.4% 19.7% 27.5% 35.5% 10,364 24,192 72,506 86,325 108,065 132,184 152,978 167,120 174,329 36.7% 22.8% 22.9% 15.7% 12.0% 9.5% 7.8% 6.6% 5.5% -67,479 % of revenues EBITDA 1,273,447 15.0% 16,952 2,228,533 477,543 22.2% 955,085 -127,411 -77,083 -83,974 -55,996 39,430 232,205 533,483 955,085 -238.6% -119.8% -24.3% -15.3% -6.2% 2.8% 11.9% 20.9% 30.0% 0.22 1.44 0.23 0.00 0.00 9,728 57,922 133,242 238,642 0.0% 0.0% 0.0% 0.0% 0.0% 24.7% 24.9% 25.0% 25.0% -67,479 -127,412 -77,083 -83,974 -55,996 29,701 174,283 400,241 716,443 -238.63% -119.85% -24.32% -15.27% -6.21% 2.14% 8.93% 15.71% 22.50% 10,364 24,192 72,506 86,325 108,065 132,184 152,978 167,120 174,329 18.6% 17.0% 23.8% 19.8% 19.8% 19.8% 19.8% 19.8% 19.8% 0 381,236 -103,737 -334,587 70,214 97,537 112,745 118,883 127,345 1,129,414 174,329 955,085 716,443
- 2. TWTR Discounted Cash Flow (DCF) Analysis DCF Valuation Model 11.07.13 Net Working Capital 167,088 % of increase Free Cash Flow Firm (FCF) 444,587 590.88% 515.76% 140.28% 20.0% 20.00% 20.00% 20.00% 20.00% 20.00% 26,385 % of revenue (–) Cap Ex. 548,324 61,983 185,574 250,000 275,000 302,500 332,750 366,025 402,628 134.9% 199.4% 34.7% 10.0% 10.0% 10.0% 10.0% 10.0% -546,439 -293,888 -582,236 -83,500 110,000 180,214 277,751 390,496 509,379 636,724 -152,717 -43,078 107,256 320,219 615,489 8,792,701 Discount Period 1 2 3 4 5 5 Discount Factor 0.89 0.80 0.71 0.64 0.57 0.57 -136,354 -34,341 76,343 203,505 349,245 4,989,215 Present Value of FCF Cumulative PV of FCF 458,398 Present Value of Terminal Value (TV) 4,989,215 Enterprise Value 5,447,613 Equity Value: WACC vs. Perpetual Growth Rate DCF Valuation Assumptions WACC 12.0% 11.0% 11.5% 12.0% 12.5% 13.0% 9,098,927 8,398,226 7,807,102 7,795,713 6,865,785 8,545,498 7,940,346 $7,423,317 6,976,749 6,587,399 4.5% 5.0% 5.5% 5.0% Perpetual Growth Rate 8,077,213 7,547,878 7,090,702 6,692,122 6,341,765 Fair Value (1 yr forward) PV of FCF 458,398 PV of TV Equity Value per Share: WACC vs. Perpetual Growth Rate 4,989,215 Enterprise Value 5,447,613 11.0% 11.5% 12.0% 12.5% 13.0% (–) Debt 0 5.5% 14.51 13.39 12.45 12.43 (+) Cash 1,975,704 5.0% 13.63 12.66 $11.84 11.12 10.50 Equity Value (100%) 7,423,317 4.5% 12.88 12.04 11.31 10.67 10.11 Basic Shares 474,697 Fully Diluted (FD) Shares 627,153 FD Equity Value per Share Implied terminal EBITDA mulitiple $11.84 7.8x 10.95
- 3. TWTR Discounted Cash Flow (DCF) Analysis DCF Valuation Model 11.07.13 PV of FCF Key Assumptions Discount Period 1 Revenues for 2013 are $550 Mil. and the YoY increase falls to 25% by 2018 2 3 4 5 Total Cost of revenues fall to 25% by 2018 13.0% -135,147 -33,736 74,334 196,397 334,063 435,910 R&D as a % of revenues falls from 37.5% in 2012 to 15% in 2018 12.5% -135,748 -34,037 75,329 199,911 341,553 447,009 Sales & Marketing as a % of revenues falls from 25% in 2012 to 15% in 2018 12.0% -136,354 -34,341 76,343 203,505 349,245 458,398 G&A as a % of revenues falls from 199 in 2012 to 15% in 2018 11.5% -136,966 -34,650 77,374 207,180 357,146 470,085 Statutory tax rate is 25% 11.0% -137,582 -34,963 78,425 210,938 365,263 482,081 2013-18 forecast Dep & Amort. Is estimated as 19.8% of Capex and R&D exp. Net Working Capital is estimated at 20% of revenues from 2013-18 Capex is forecast at increase by 10% each year from 2013-18 PV of TV Perpetual Growth Rate WACC of 12% 4.0% Terminal growth rate of 5% 4.5% 5.0% 5.5% 6.0% 13.0% 3,711,809 3,930,151 4,175,785 4,454,171 4,772,326 12.5% 4,018,267 4,269,409 4,554,036 4,879,325 5,254,657 12.0% 4,365,563 4,656,600 4,989,215 5,373,001 5,820,751 11.5% 4,761,949 5,102,088 5,494,557 5,952,436 6,493,567 11.0% 5,218,040 5,619,428 6,087,714 6,641,142 7,305,256 Tax loss carryforward 516 Statutory Tax rate 25% Fully-diluted No. Shares Common oustanding post-IPO 474,697 Options at $1.84 42,709 RSUs 85,658 Conv. Preferreds at $.034 MoPub acquisition 116.512 14,791 New common shares 2013 Plan Common issuable 2007 Plan 9,182 Common issuable under ESPP Other 627,153 Tax Considerations Yes