1. December 31, 2013
IV Worldwide Fund
A
Portfolio Managers
Objective
Charles de Vaulx
The IVA Worldwide Fund will seek long-term growth of capital by investing in a range
of securities and asset classes from markets around the world, including the U.S. market.
M
anager of fund since inception
(October 2008)
n 6 years of investment experience
2
n
Fund Highlights
n
T
he fund employs a flexible approach to value investing. This approach may include securities
across all asset classes (stocks, bonds, gold and cash) and securities throughout the capitalization
spectrum (small, mid, large caps).
n
T
he portfolio management team attempts to mitigate risk by focusing on what can go
wrong and striving to avoid bubbles, with an eye towards capital preservation.
Chuck de Lardemelle
M
anager of fund since inception
(October 2008)
n 7 years of investment experience
1
n
n T he
Fund Data
Total Net Assets (millions):
n
$9,585.4
Expense Ratio (Class A):
Inception Date:
1.28%
October 1, 2008
Class Ticker Cusip
A
IVWAX 45070A107
C
IVWCX 45070A503
I
IVWIX 45070A206
fund strives to be well-diversified, and never seeks to replicate a benchmark.
T
he investment team utilizes in-house, fundamental research conducted by experienced analysts.
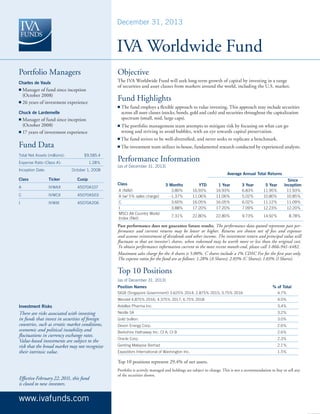
Performance Information
(as of December 31, 2013)
Average Annual Total Returns
Class
A (NAV)
A (w/ 5% sales charge)
C
I
MSCI All Country World
Index (Net)
3 Months
3.80%
-1.37%
3.60%
3.88%
YTD
16.93%
11.06%
16.05%
17.20%
1 Year
16.93%
11.06%
16.05%
17.20%
3 Year
6.83%
5.02%
6.02%
7.09%
5 Year
11.95%
10.80%
11.12%
12.23%
Since
Inception
11.93%
10.85%
11.09%
12.20%
7.31%
22.80%
22.80%
9.73%
14.92%
8.78%
Past performance does not guarantee future results. The performance data quoted represents past performance and current returns may be lower or higher. Returns are shown net of fees and expenses
and assume reinvestment of dividends and other income. The investment return and principal value will
fluctuate so that an investor’s shares, when redeemed may be worth more or less than the original cost.
To obtain performance information current to the most recent month-end, please call 1-866-941-4482.
Maximum sales charge for the A shares is 5.00%. C shares include a 1% CDSC Fee for the first year only.
The expense ratios for the fund are as follows: 1.28% (A Shares); 2.03% (C Shares); 1.03% (I Shares).
Top 10 Positions
(as of December 31, 2013)
Position Names
% of Total
SIGB (Singapore Government) 3.625% 2014; 2.875% 2015; 3.75% 2016
4.7%
Wendel 4.875% 2016; 4.375% 2017; 6.75% 2018
4.0%
Investment Risks
Astellas Pharma Inc.
3.4%
There are risks associated with investing
in funds that invest in securities of foreign
countries, such as erratic market conditions,
economic and political instability and
fluctuations in currency exchange rates.
Value-based investments are subject to the
risk that the broad market may not recognize
their intrinsic value.
Nestle SA
3.2%
Gold bullion
3.0%
Devon Energy Corp.
2.6%
Berkshire Hathaway Inc. CI A; CI B
2.6%
Oracle Corp.
2.3%
Genting Malaysia Berhad
2.1%
Expeditors International of Washington Inc.
1.5%
Top 10 positions represent 29.4% of net assets.
Effective February 22, 2011, this fund
is closed to new investors.
www.ivafunds.com
Portfolio is actively managed and holdings are subject to change. This is not a recommendation to buy or sell any
of the securities shown.
2. December 31, 2013
Portfolio Characteristics
Number of Holdings:
126
Median Market Cap (millions):
Weighted Average
Market Cap (millions):
$4,789
$63,326
P/E Ratio
(weighted harmonic average):
17.2
Forward P/E Ratio (FY1)
(weighted harmonic average):
Allocation
By Asset
n Equity
52.8%
n Fixed Income
12.5%
n Gold
3.0%
n Other1 0.0%
n Cash and Cash Equivalents2 31.7%
16.6
By Sector
Investment Style
VALUE
BLEND
Consumer Discretionary
9.6%
Other1
0.0%
Consumer Staples
GROWTH
7.0%
5.7%
Financials 4.6%
Technology 10.1%
Telecommunication Services
Health Care
3.5%
Utilities 0.8%
Holding Company
MEDIUM
0.1%
Sovereign Fixed Income
Gold 3.0%
LARGE
Real Estate
Energy 7.7%
7.3%
Cash and Cash Equivalents2
Total
Industrials 6.4%
SMALL
1.3%
31.7%
100.0%
Materials 1.2%
By Region n Equity n Fixed Income n Gold n Other1 n Cash and Cash Equivalents2
31.7%
27.2%
17.1%
11.0%
8.4%
3.0%
0.8%
United
States
Europe
Ex-UK
Asia
Ex-Japan
Japan
Gold
0.8%
0.0%
Other
Countries
United
Kingdom
Other1
Cash and
Cash Equivalents2
Includes options and unrealized gains or losses on currency forwards.
Includes 0.4% T-bills and cash held as collateral.
1
2
MSCI All Country World Index (Net) is an unmanaged index comprised of 44 country indices comprising
23 developed and 21 emerging market country indices and is calculated with dividends reinvested after
deduction of withholding tax. The Index is a trademark of Morgan Stanley Capital International and is not
available for direct investment.
International Value Advisers, LLC
717 Fifth Avenue, 10th Floor
New York, NY 10022
877.874.2999
www.ivafunds.com
An investor should read and consider the funds’ investment objectives, risks, charges and expenses
carefully before investing. This and other important information are detailed in our prospectus and
summary prospectus, which can be obtained by calling 1-866-941-4482 or visiting www.ivafunds.com.
The IVA Funds are offered by IVA Funds Distributors, LLC.
Any statistics contained herein have been obtained from sources believed to be reliable, but the accuracy
of this information cannot be guaranteed. Price to Earnings (P/E) ratio is the valuation of a company’s
current share price compared to its per-share earnings. Forward P/E Ratio (FY1) is calculated using the
closing price of a security divided by its earnings estimate for the next unreported fiscal year.
NOT FDIC INSURED • NOT BANK GUARANTEED • MAY LOSE VALUE