Reliability Goal Story FMS Reliability
•
1 gostou•303 visualizações

Setting reliability goals in only part of the process. Be sure to make them clear and measured. During a reliability assessment this lesson becomes clear. Hopefully you do not recognize yourself in this story.

Recomendados
Mais conteúdo relacionado
Mais de Accendo Reliability
Mais de Accendo Reliability (20)
Último
Último (20)
Reliability Goal Story FMS Reliability
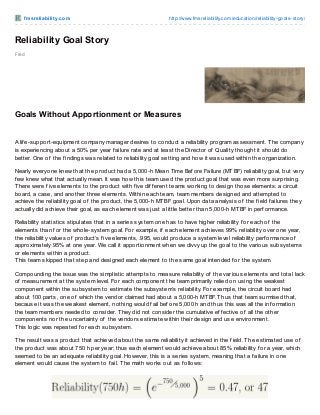
- 1. f msreliabilit y.com http://www.fmsreliability.com/education/reliability-goals-story/ Fred Reliability Goal Story Goals Without Apportionment or Measures A lif e-support-equipment company manager desires to conduct a reliability program assessment. The company is experiencing about a 50% per year f ailure rate and at least the Director of Quality thought it should do better. One of the f indings was related to reliability goal setting and how it was used within the organization. Nearly everyone knew that the product had a 5,000-h Mean Time Bef ore Failure (MTBF) reliability goal, but very f ew knew what that actually mean. It was how this team used the product goal that was even more surprising. There were f ive elements to the product with f ive dif f erent teams working to design those elements: a circuit board, a case, and another three elements. Within each team, team members designed and attempted to achieve the reliability goal of the product, the 5,000-h MTBF goal. Upon data analysis of the f ield f ailures they actually did achieve their goal, as each element was just a little better than 5,000-h MTBF in perf ormance. Reliability statistics stipulates that in a series system one has to have higher reliability f or each of the elements than f or the whole-system goal. For example, if each element achieves 99% reliability over one year, the reliability values of product’s f ive elements, .995, would produce a system level reliability perf ormance of approximately 95% at one year. We call it apportionment when we divvy up the goal to the various subsystems or elements within a product. This team skipped that step and designed each element to the same goal intended f or the system. Compounding the issue was the simplistic attempts to measure reliability of the various elements and total lack of measurement at the system level. For each component the team primarily relied on using the weakest component within the subsystem to estimate the subsystem’s reliability. For example, the circuit board had about 100 parts, one of which the vendor claimed had about a 5,000-h MTBF. Thus that team surmised that, because it was the weakest element, nothing would f ail bef ore 5,000 h and thus this was all the inf ormation the team members needed to consider. They did not consider the cumulative ef f ective of all the other components nor the uncertainty of the vendors estimate within their design and use environment. This logic was repeated f or each subsystem. The result was a product that achieved about the same reliability it achieved in the f ield. The estimated use of the product was about 750 h per year; thus each element would achieve about 85% reliability f or a year, which seemed to be an adequate reliability goal. However, this is a series system, meaning that a f ailure in one element would cause the system to f ail. The math works out as f ollows:
- 2. Because the product of the reliabilities of the individual f ive elements was overlooked, the system reliability turned out to be less than 50%, not the expected 85%. The f ield perf ormance was the result of how the product was designed to meet the reliability goal f or each subsystem. The team got what it designed. Its members had f orgotten or ignored a basic, yet critical element of reliability engineering knowledge.