

Recomendados
Mais conteúdo relacionado
Mais procurados
Mais procurados (20)
Destaque
Destaque (13)
Semelhante a Science fair
Semelhante a Science fair (20)
Mais de Departamento de Ciencias Naturales.- IES Alpajés
Mais de Departamento de Ciencias Naturales.- IES Alpajés (20)
Último
Último (20)
Science fair
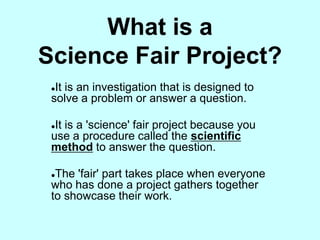
- 1. What is a Science Fair Project? It is an investigation that is designed to solve a problem or answer a question. It is a 'science' fair project because you use a procedure called the scientific method to answer the question. The 'fair' part takes place when everyone who has done a project gathers together to showcase their work.
- 3. Reporting Results: Final Report: A combination of all of the information you have gathered, all of your planning, the data you collected, and the analysis of your results. This will be put together like a book. Display Board: An eye-catching display summarizing everything in your final report; allowing your audience to easily gain a general understanding of your project.
- 4. Final Report: Title page Abstract: An abbreviated version of your final report. Table of contents Question, variables, and hypothesis Background research: The research paper you wrote before you started your experiment. Materials list Experimental procedure: Including logs of your process, photos, etc.
- 5. Final Report Continued: Data and Results: Your observations, data table and graph(s) will be included here. Conclusion: An analysis of your data as it relates to your hypothesis. Perhaps you include information about further steps you could take in your experiment in the future. Acknowledgments: This is your opportunity to thank anyone who helped you with your science fair project: someone in your family, a friend, a business, etc. Bibliography: Acknowledging the origin of any research / information you used from outside sources.
- 6. Final Report Continued: • Write the abstract section last, even though it will be one of the first sections of your final report. • Your final report will be several pages long, but don't be overwhelmed! Most of the sections are made up of information that you have already written. Gather up the information for each section and type it in a word processor if you haven't already.
- 7. Display Board: You will use a standard, three-panel display board that unfolds to be about 91cm X 122cm.
- 8. Organize your information like a newspaper so that your audience can quickly follow the thread of your experiment by reading from top to bottom, then left to right. Include each step of your science fair project Use at least 24pt font for titles of each section and 16pt font for text Project title easily read from across the room A picture's worth a thousand words!
- 9. Examples
- 10. Title • Ideally the title of your project should be catchy; an "interest-grabber.” But it should also describe the project well enough that people reading your report can quickly figure out what you were studying. • You will want to write your Title and Background sections AFTER you have come up with a good question to study.
- 11. Background or Purpose The background section is where you include information that you already know about your subject and you tell your audience why you chose the project you did. What were you hoping to find out from the project?
- 12. The Question (Or Selecting Your Subject) Probably the most difficult part of a science fair project is coming up with a good subject to research. Think about WHAT INTERESTS you. Think of a TESTABLE QUESTION about the subject.
- 13. Hypothesis • As soon as you come up with a testable question, you will probably instantly have a hypothesis (prediction) about what the results will be from your testing. (Isn't the human brain an amazing thing?!) It's a good idea to write this down before starting, because it may change as you go about your experiment.
- 14. Materials This section should include a list of everything that was necessary to conduct your experiment. Did you need to develop a survey?...Or make a chart? Did you use a camera to document and analyze your results? Think through the process thoroughly!
- 15. Methods Explain the procedure thoroughly GET STARTED EARLY! You may run into complications or “surprises” and have you modify your project. The more time to work with, the better! Keep detailed records of EVERYthing that you do! A project log of each step you take (even the mess- ups, as well as pictures of the process, should be included in your final report and represented on your display board.
- 16. Results or Data • Tell your reader the actual numbers (or other data) that you got as you were doing the experiment. • This will probably be best represented in a chart/table or graph. • But you do not tell your interpretation of the data - that's for the last section!
- 17. Conclusion • Here, you finally get to tell your readers what you found out from the experiment, or how you interpret your data. • This section should be focused on what you learned about your original question and hypothesis.