Blue Ocean Strategy Canvas Template

This Slideshare presentation is a partial preview of the full business document. To view and download the full document, please go here: http://flevy.com/browse/business-document/blue-ocean-strategy-canvas-template-448 I created this Excel template to offer a professionally designed Blue Ocean Strategy framework. The template walks the user through a simple 5 step process to creating your own blue ocean. The term "Blue Ocean" stems from the idea that there are opportunities in each industry to move from the ultra competitive battles around price and features (red ocean) into a new market reality where your typical competitors are either non-existent or irrelevant. This excel spreadsheet provides an input area for the products or businesses to be compared as well as a nicely designed strategy canvas curve for visualizing your blue ocean in a beautiful way.

Recommended
More Related Content
Viewers also liked
More from Flevy.com Best Practices
More from Flevy.com Best Practices (20)
Recently uploaded
Recently uploaded (20)
Blue Ocean Strategy Canvas Template
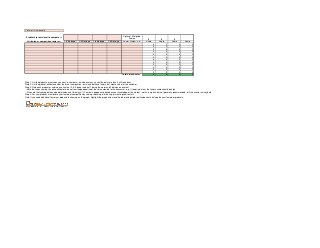
- 1. Cells to fill in manually Products (or services) to compare → Attributes or competition factors ↓ 1-5 Ratings ↓ 1-5 Ratings ↓ 1-5 Ratings ↓ 1-5 Ratings ↓ Optional: Weighted Scores Factor Weight (1-5) Total Value Score= 0 Score 0 Score 0 0 0 0 0 0 0 0 0 0 0 0 0 0 Score 0 0 0 0 0 0 0 0 0 0 0 0 0 Score 0 0 0 0 0 0 0 0 0 0 0 0 0 0 0 0 0 0 0 0 0 0 0 0 0 0 Step 1: List the products or services you want to compare - include as many as you like but more than 4 will look busy Step 2: List the product attributes and/or factors of competition - only include those factors that create value for the customer. Step 3: Rate each product or service on a scale of 0-5, 5 being the best, 1 being the worst and 0 being non-existent - Note that when scoring the price attribute to do so from the perspective of the value created to the consumer - e.g. if the price is low, the factors score should be high - Also note that scoring data can be obtained one of two ways: 1) Your own perspective based on your knowledge of the market - works in a pinch but not generally recommended; or 2) consumer survey data Step 4: For your product, manipulate your factors of competition by raising, reducing, eliminating, or creating new factors Note: If you need additional factors or products to show up on the graph, highlight the graph and move the blue (and purple) outline boxes to include the new factors or products
- 2. Blue Ocean Strategy Canvas Scoring 5 4 3 2 1 0 Factors of Competition
- 3. Cells to fill in manually Products (or services) to compare → Attributes or competition factors ↓ Processor Screen Size Thin-ness Screen Quality Battery Life Camera SD Memory Storage Competitive Factor Competitive Factor Competitive Factor Competitive Factor Competitive Factor iPhone 5S Droid Razr Moto X 1-5 Ratings ↓ 1-5 Ratings ↓ 1-5 Ratings ↓ 1-5 Ratings ↓ 4 2 3 0 2 3 4 0 3 5 2 0 3 2 4 0 3 1 4 0 5 1 3 0 0 3 2 0 0 0 0 0 0 0 0 0 0 0 0 0 0 0 0 0 0 0 0 0 Optional: Weighted Scores Factor Weight (1-5) 4 4 3 4 5 4 1 Total Value Score= iPhone 5S Droid Razr Score Score 16 8 8 12 9 15 12 8 15 5 20 4 0 3 0 0 0 0 0 0 0 0 0 0 80 55 Moto X Score Score 12 16 6 16 20 12 2 0 0 0 0 0 84 0 0 0 0 0 0 0 0 0 0 0 0 0 Step 1: List the products or services you want to compare - include as many as you like but more than 4 will look busy Step 2: List the product attributes and/or factors of competition - only include those factors that create value for the customer. Step 3: Rate each product or service on a scale of 0-5, 5 being the best, 1 being the worst and 0 being non-existent - Note that when scoring the price attribute to do so from the perspective of the value created to the consumer - e.g. if the price is low, the factors score should be high - Also note that scoring data can be obtained one of two ways: 1) Your own perspective based on your knowledge of the market - works in a pinch but not generally recommended; or 2) consumer survey data Step 4: For your product, manipulate your factors of competition by raising, reducing, eliminating, or creating new factors Note: If you need additional factors or products to show up on the graph, highlight the graph and move the blue (and purple) outline boxes to include the new factors or products
- 4. Blue Ocean Strategy Canvas iPhone 5S Droid Razr Scoring 5 4 3 2 1 0 Factors of Competition Moto X
- 5. Cells to fill in manually Products (or services) to compare → Attributes or competition factors ↓ Processor Screen Size Thin-ness Screen Quality Battery Life Camera SD Memory Storage Custom Colors Competitive Factor Competitive Factor Competitive Factor Competitive Factor iPhone 5S Droid Razr Moto X 1-5 Ratings ↓ 1-5 Ratings ↓ 1-5 Ratings ↓ 1-5 Ratings ↓ 4 2 3 0 2 3 4 0 3 5 2 0 3 2 4 0 3 1 4 0 5 1 3 0 0 3 2 0 0 0 5 0 0 0 0 0 0 0 0 0 0 0 0 0 0 0 0 0 Optional: Weighted Scores Factor Weight (1-5) 4 4 3 4 5 4 1 3 Total Value Score= iPhone 5S Droid Razr Score Score 16 8 8 12 9 15 12 8 15 5 20 4 0 3 0 0 0 0 0 0 0 0 0 0 80 55 Moto X Score Score 12 16 6 16 20 12 2 15 0 0 0 0 99 0 0 0 0 0 0 0 0 0 0 0 0 0 Step 1: List the products or services you want to compare - include as many as you like but more than 4 will look busy Step 2: List the product attributes and/or factors of competition - only include those factors that create value for the customer. Step 3: Rate each product or service on a scale of 0-5, 5 being the best, 1 being the worst and 0 being non-existent - Note that when scoring the price attribute to do so from the perspective of the value created to the consumer - e.g. if the price is low, the factors score should be high - Also note that scoring data can be obtained one of two ways: 1) Your own perspective based on your knowledge of the market - works in a pinch but not generally recommended; or 2) consumer survey data Step 4: For your product, manipulate your factors of competition by raising, reducing, eliminating, or creating new factors Note: If you need additional factors or products to show up on the graph, highlight the graph and move the blue (and purple) outline boxes to include the new factors or products
- 7. Blue Ocean Strategy Canvas iPhone 5S Droid Razr Moto X RAISE 4 RAISE 3 1 0 Factors of Competition ELIMINATE REDUCE 2 CREATE Scoring 5