Java Optimization For Faster Code & Better Results | J Optimizer
•
0 gostou•308 visualizações

The Embarcadero J Optimizer is a tool that helps developers improve the performance, quality and reliability of Java applications. It includes features like a memory and CPU profiler to identify bottlenecks, a thread debugger to detect threading issues, code audits and metrics to evaluate quality, and a request analyzer to examine Java EE protocols. It works with various Java platforms and IDEs like Eclipse.

Recomendados
Recomendados
Mais conteúdo relacionado
Mais procurados
Mais procurados (19)
Semelhante a Java Optimization For Faster Code & Better Results | J Optimizer
Semelhante a Java Optimization For Faster Code & Better Results | J Optimizer (20)
Mais de Michael Findling
Mais de Michael Findling (20)
Último
Último (20)
Java Optimization For Faster Code & Better Results | J Optimizer
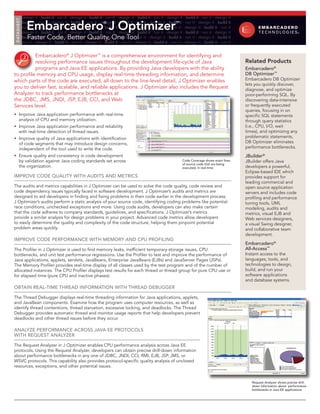
- 1. DATASHEET design it ∙ build it ∙ run it ∙ design it ∙ build it ∙ run it ∙ design it ∙ build it ∙ run it ∙ design it ∙ build it ∙ run it ∙ design it Embarcadero J Optimizer build it ∙ run it ∙ design it ∙ build it ∙ run it ∙ design it ∙ build it ∙ run it ∙ design it ∙ build it ∙ run it ∙ design it ∙ build it ® ™ run it ∙ design it ∙ build it ∙ run it ∙ design it ∙ build it ∙ run it ∙ design it ∙ build it ∙ run it ∙ design it ∙ build it ∙ run it design it ∙ build it ∙ run it ∙ design it ∙ build it ∙ run it ∙ design it ∙ build it ∙ run it ∙ design it ∙ build it ∙ run it ∙ design it Faster Code, Better Quality, One Tool build it ∙ run it ∙ design it ∙ build it ∙ run it ∙ design it ∙ build it ∙ run it ∙ design it ∙ build it ∙ run it ∙ design it ∙ build it run it ∙ design it ∙ build it ∙ run it ∙ design it ∙ build it ∙ run it ∙ design it ∙ build it ∙ run it ∙ design it ∙ build it ∙ run it Embarcadero® J Optimizer™ is a comprehensive environment for identifying and resolving performance issues throughout the development life-cycle of Java Related Products programs and Java EE applications. By providing Java developers with the ability Embarcadero® to profile memory and CPU usage, display real-time threading information, and determine DB Optimizer™ which parts of the code are executed, all down to the line-level detail, J Optimizer enables Embarcadero DB Optimizer lets you quickly discover, you to deliver fast, scalable, and reliable applications. J Optimizer also includes the Request diagnose, and optimize Analyzer to track performance bottlenecks at poor-performing SQL. By the JDBC, JMS, JNDI, JSP, EJB, CCI, and Web discovering data-intensive Services level. or frequently executed queries, focusing in on • Improve Java application performance with real-time specific SQL statements analysis of CPU and memory utilization. through query statistics • Improve Java application performance and reliability (i.e., CPU, I/O, wait with real-time detection of thread issues. times), and optimizing any • Improve quality of Java applications with identification problematic statements, of code segments that may introduce design concerns, DB Optimizer eliminates independent of the tool used to write the code. performance bottlenecks. • Ensure quality and consistency in code development JBuilder® by validation against Java coding standards set across Code Coverage shows exact lines JBuilder offers Java of source code that are being the organization. executed, in real-time developers a powerful, Eclipse-based IDE which IMPROVE CODE QUALITY WITH AUDITS AND METRICS provides support for leading commercial and The audits and metrics capabilities in J Optimizer can be used to solve the code quality, code review and open source application code dependency issues typically faced in software development. J Optimizer’s audits and metrics are servers and includes code designed to aid developers in finding and fixing problems in their code earlier in the development process. profiling and performance J Optimizer’s audits perform a static analysis of your source code, identifying coding problems like potential tuning tools, UML race conditions, unchecked exceptions and more. Using code audits, developers can also make certain modeling, audits and that the code adheres to company standards, guidelines, and specifications. J Optimizer’s metrics metrics, visual EJB and provide a similar analysis for design problems in your project. Advanced code metrics allow developers Web services designers, to easily determine the quality and complexity of the code structure, helping them pinpoint potential a visual Swing designer, problem areas quickly. and collaborative team development. IMPROVE CODE PERFORMANCE WITH MEMORY AND CPU PROFILING Embarcadero® The Profiler in J Optimizer is used to find memory leaks, inefficient temporary-storage issues, CPU All-Access™ bottlenecks, and unit test performance regressions. Use the Profiler to test and improve the performance of Instant access to the Java applications, applets, servlets, JavaBeans, Enterprise JavaBeans (EJBs) and JavaServer Pages (JSPs). languages, tools, and The Memory Profiler provides real-time display of all classes used by the test program and of the number of technologies to design, allocated instances. The CPU Profiler displays test results for each thread or thread group for pure CPU use or build, and run your for elapsed time (pure CPU and inactive phases). software applications and database systems. OBTAIN REAL-TIME THREAD INFORMATION WITH THREAD DEBUGGER The Thread Debugger displays real-time threading information for Java applications, applets, and JavaBean components. Examine how the program uses computer resources, as well as identify thread contentions, thread starvation, excessive locking, and deadlocks. The Thread Debugger provides automatic thread and monitor usage reports that help developers prevent deadlocks and other thread issues before they occur. ANALYZE PERFORMANCE ACROSS JAVA EE PROTOCOLS WITH REQUEST ANALYZER The Request Analyzer in J Optimizer enables CPU performance analysis across Java EE protocols. Using the Request Analyzer, developers can obtain precise drill-down information about performance bottlenecks in any one of JDBC, JNDI, CCI, RMI, EJB, JSP, JMS, or WSVC protocols. This capability also provides protocol-specific quality analysis of unclosed resources, exceptions, and other potential issues. Request Analyzer shows precise drill- down information about performance bottlenecks in Java EE applications
- 2. Features Description J Optimizer Memory and CPU Profiler Used to find memory leaks, inefficient temporary-storage issues, CPU bottlenecks, and unit test performance regressions. Use the Profiler to test and improve the performance of Java applications, applets, servlets, JavaBeans, Enterprise JavaBeans (EJBs) and JavaServer Pages (JSPs). The Memory Profiler provides real-time display of all classes used by the test program and the number of allocated instances. The CPU Profiler displays test results for each thread or thread group for pure CPU use or for elapsed time (pure CPU and inactive phases). Thread Debugger Provides a real-time display of the progress of all threads running within the Java Virtual Machine (JVM), the ability to monitor wait-states and locks, and even predict potential deadlock conditions in the code. Request Analyzer Profiles the performance behavior of Java EE application code across common Java EE components such as JDBC, RMI, JSP, JNDI, Enterprise JavaBeans (EJBs), JMS, and Web service protocol containers. Code Coverage Code Coverage allows you to determine the exact lines of source code that are being executed. In real time, you can view how frequently each class, method, and line of code is executed. Code Coverage lets you test applications, applets, servlets, JavaBeans, Enterprise JavaBeans (EJBs), JavaServer Pages (JSPs), and virtually any other Java code. With Code Coverage, you can easily spot and remove dead code from applications, improving quality and reducing the footprint of an application. J Optimizer Agent The J Optimizer Agent is a profiling agent that works with either of two standard profiling interfaces that a JVM might support: Java Virtual Machine Profiler Interface (JVMPI) or Java Virtual Machine Tool Interface (JVMTI). Code Audits and Metrics The audits and metrics capabilities in J Optimizer can be used to solve the code quality, code review and code dependency issues typically faced in software development. J Optimizer’s audits and metrics are designed to aid developers in finding and fixing problems in their code earlier in the development process. J Optimizer’s audits perform a static analysis of your source code, identifying coding problems like potential race conditions, unchecked exceptions and more. J Optimizer’s metrics provide a similar analysis for design problems in your project. Progress Tracker Enables developers to continuously monitor and measure the impact of performance changes by allowing them to compare visual snapshots of their progress. It allows for analyzing snapshots so users can compare profiler, code coverage, and request analyzer snapshots. It also generates reports that can be exported in PDF and HTML format. Snapshots Snapshots are binary files that capture all the data from a particular test run. Snapshots can be opened for analysis in the product that generated it, such as Profiler, Code Coverage, or Request Analyzer. Touch-point Install Option Users have the option to install J Optimizer touch point plug-in into an existing Eclipse or Eclipse-based product and make it profile ready. Multi-Platform Support J Optimizer supports profiling of Java applications running on today’s most popular commercial and open source application servers including BEA WebLogic Application Server, IBM WebSphere, JBoss, Oracle Application Server, Apache Geronimo, Apache Tomcat, and Sun GlassFish. System Requirements • 768 MB RAM minimum, 1 GB RAM recommended for standalone configuration • Agent only – 512 MB RAM • Hard Disk Space (Full Product) – 500 MB on Windows – 550 MB on Linux – 350 MB on Mac • Hard Disk Space (Agent Only) – 150 MB on Windows – 200 MB on Linux – 30 MB on Mac – 150 MB on Solaris • Intel Pentium 4, 2.4 MHz or higher (or compatible) • DVD-ROM drive (to install product from DVD) • High-resolution monitor (1024x768) Operating Systems: • Microsoft Windows XP SP3, Microsoft Windows Vista Update 1, Mac OS X (10.5), Red Hat Enterprise Linux 5 • Solaris 10 for J Optimizer Agent only • Touchpoint Integration with: – Eclipse 3.3.2, and 3.4.1 Java and JEE editions – MyEclipse 6.6, and 7.0 – IBM RAD 7.5 Download a Free Trial at www.embarcadero.com Corporate Headquarters | Embarcadero Technologies | 100 California Street, 12th Floor | San Francisco, CA 94111 | www.embarcadero.com | sales@embarcadero.com © 2009 Embarcadero Technologies, Inc. Embarcadero, the Embarcadero Technologies logos, and all other Embarcadero Technologies product or service names are trademarks or registered trademarks of Embarcadero Technologies, Inc. All other trademarks are property of their respective owners. JO/DS/2009/03/18