SlideShare uma empresa Scribd logo
1 de 48
Baixar para ler offline
“I am Lowe’s most important customer.”


ANNUAL REPORT 2003
“So am I.”
In 2003, Lowe’s served 520,605,244 customers. The customers who came
    through our doors expected our shelves to be stocked with quality products at
  everyday low prices as well as complete home improvement solutions to enable
  them to add the personal touches to turn their houses into homes. They return
  time and time again knowing that Lowe’s employees are striving to exceed their
      expectations by treating each customer as Lowe’s most important customer.


Investing in what matters.                   To our customers, home ownership is about more than just a roof over your head.
It is the American dream, an expression of their individuality and an investment that is the centerpiece of their lives. We are
pleased our customers have chosen Lowe’s to help enhance their home and improve their investment. We stand ready to serve
them with an unwavering commitment to offer the best brands at everyday low prices with exceptional service that shows our
customers they are Lowe’s most important customer.
   Our continued expansion in metropolitan as well as small-market areas has increased our national presence and market
penetration. But our growth goes beyond geographic expansion of stores. With exciting new products and improved
installation and special order capabilities, our customers are finding more than just home improvement products in our stores.
They are finding well-trained, knowledgeable employees, backed by state-of-the-art technology and an experienced
management team who understands that sustainable success is dependent on serving and satisfying nearly 521 million
customers … one at a time.

Company Profile // Lowe’s Companies, Inc. is a $30.8 billion retailer of a complete line of home improvement products, equipment and
services. The company, through its subsidiaries, serves more than 10 million do-it-yourself and commercial business customers each week
through more than 950 stores in 45 states. Named FORTUNE® magazine’s Most Admired Specialty Retailer for the second year in a row,
Lowe’s is the world’s second largest home improvement retailer and the 11th largest retailer in the U.S. // Lowe’s expansion continues,
opening a new store on average every three days. The company’s expansion plans include two prototypes, a 116,000-square-foot (116K)
store for large markets and a 94,000-square-foot (94K) store used primarily to serve smaller markets. Both prototypes include a lawn and
garden center averaging an additional 31,000 square feet for 116K stores and an additional 26,000 square feet for 94K stores. At the
beginning of 2004, square footage totaled approximately 109 million square feet. // In 2003, the company opened 130 new stores, the
majority of which were in metropolitan markets. In 2004, the company plans to open 140 new stores and continue its emphasis on cities
with populations greater than 500,000, such as New York, Tampa, and Los Angeles. Lowe’s is an active supporter of the communities it
serves. Through the Lowe’s Heroes volunteer program and the Home Safety Council, the company provides help to civic groups with public
safety projects and shares important home safety and fire prevention information with neighborhoods across the country. // Headquartered
in Mooresville, N.C., the 58-year-old company employs 147,000 people. Approximately 6 percent of Lowe’s stock is owned by employees
through the Lowe’s 401(k) plan. Lowe’s is committed to understanding and reflecting its communities’ diverse cultures in staffing, business
partnerships and the products it sells. Lowe’s is committed to making diversity and inclusion a natural part of the way it does business. //
Lowe’s has been a publicly held company since October 10, 1961. The stock is listed on the New York Stock Exchange with shares trading
under the symbol LOW. For more information, visit www.Lowes.com. //
Financial Highlights*
        i n m i l l i o n s , e xc e p t p e r s h a r e d ata


                                                                                                Increase over ’02                           Fiscal ’03   Fiscal ’02
                Net Sales                                                                                        18.1%                      $ 30,838     $ 26,112
                Gross Margin                                                                                       71bps**                     31.15%       30.44%
                Pre-tax Earnings                                                                                 28.2%                      $ 2,998      $ 2,339
                Earnings from Continuing Operations                                                              27.6%                      $ 1,862      $ 1,459
                Earnings from Discontinued Operations, Net of Tax                                                                           $     15     $     12
                Net Earnings                                                                                     27.6%                      $ 1,877      $ 1,471
                Earnings Per Share
                    Basic (Continuing Operations)                                                                                           $ 2.37       $ 1.87
                          (Discontinued Operations)                                                                                         $ 0.02       $ 0.02
                    Basic Earnings Per Share                                                                     26.5%                      $ 2.39       $ 1.89
                    Diluted (Continuing Operations)                                                                                         $ 2.32       $ 1.83
                            (Discontinued Operations)                                                                                       $ 0.02       $ 0.02
                    Diluted Earnings Per Share                                                                   26.5%                      $ 2.34       $ 1.85
                Cash Dividends Per Share                                                                         29.4%                      $ 0.110      $ 0.085
                * Amounts herein have been adjusted to reflect the 26 Contractor Yard locations sold in 2003 as a discontinued operation.
                ** Basis points


        Sales Growth                                                                                        Earnings Growth
        in billions of dollars                                                                              in millions of dollars
                                                                            30                                                                                   1,800

                                                                                                                                                                 1,600
                                                                            25
                                                                                                                                                                 1,400

                                                                            20                                                                                   1,200

                                                                                                                                                                 1,000
                                                                            15
                                                                                                                                                                 800

                                                                            10                                                                                   600

                                                                                                                                                                 400
                                                                            5
                                                                                                                                                                 200

                                                                                                                                                                 0
                                                                            0
                                                                                                                      94 95 96 97 98 99 00 01 02 03
                   94 95 96 97 98 99 00 01 02 03


02 LOWE’S COMPANIES, INC.
Letters to Our Shareholders


                                                                                               Robert L. Tillman, Chairman & Chief Executive Officer
                                                                                                                     and Robert A. Niblock, President


To our shareholders.                   Back-to-back success is an achievement recognized in both business and sports as representative of true
excellence. A strong year only raises the hurdle for the next, and Lowe’s has a proven track record of consistently strong performance as we’ve
transformed the company into a leader in the home improvement industry. Rising to the challenge created by record results in 2002, our
success in 2003 is a testament that Lowe’s is providing the products and services that allow Americans to invest in what matters to them.
    2003 was a great year for Lowe’s. Under the strong leadership of our experienced management team, we delivered above-plan sales and
earnings despite the weather-affected slow start experienced in the first quarter. After the slow start to spring, we knew we would be facing a
compressed selling season, and our stores would need to be ready. We invested in the business and had the merchandise and staffing in place
to serve our customers as they initiated home improvement projects when weather improved.
    That investment was rewarded with strong financial results. Sales from continuing operations for the year totaled $30.8 billion dollars,
up 18.1 percent over fiscal 2002, and comparable store sales increased 6.7 percent. We experienced balanced sales across all of our operating
regions and product categories. In fact, all 18 regions and all 18 product categories delivered positive comparable store sales for the year,
further demonstrating the deep and far-reaching connection we have made with our customers.
    Gross margin continues to expand, driven not by higher prices, but rather by our efforts to minimize acquisition and supply chain costs.
Our commitment to everyday low prices remains strong, guaranteeing our customers that they will find the best prices at Lowe’s every day.
    Growth in gross margin, combined with effective expense control, led to an industry leading, and Lowe’s record, 10.7 percent operating
margin for the year.
    Net earnings grew by 27.6 percent in 2003 and diluted earnings per share increased to $2.34, up 26.5 percent over 2002.
    We reached many significant milestones in 2003. Lowe’s crossed $30 billion in sales, shareholders’ equity exceeded $10 billion, and we
took the final step in our transformation to a national, big-box home improvement retailer when we sold the 26 commodity-focused
Contractor Yard locations. This transaction allows us to hone our focus on our retail and targeted commercial customers.
    In fiscal 2003, we opened 130 stores, including five relocations, bringing our store count to 952. We entered Chicago with three stores and
added additional locations in strategic markets like Los Angeles, New York, Detroit and Memphis. We also entered many smaller markets
across America, making Lowe’s more and more convenient for home improvement consumers around the country.
    A key component of our success in America’s smaller markets is our new 94,000-square-foot prototype store. Designed to efficiently serve
single-store markets across the country, we opened the first prototype in March and ended the year with 32 of our 94,000-square-foot stores.
We designed this prototype to have the same look and feel as our larger stores, and our customer feedback confirms that we met our objective.
We continue to be pleased with the results these stores are delivering, and the communities we’re entering are greeting us with excitement.
    Our back-to-back success provides even more confidence in our future. The home improvement industry is strong and growing. In fact,
the Home Improvement Research Institute estimates nearly five percent growth in home improvement spending each year over the next
several years. That growth is buttressed by the strongest housing market on record. In 2003, housing turnover reached record levels, and that
strength is expected to continue into 2004 and beyond. Increases in disposable income, improving equity markets, and low mortgage rates
that fuel a strong refinancing market have propelled home improvement spending and helped make affordable housing available to those


                                                                                                                                2003 ANNUAL REPORT 03
wanting to participate in the American dream. This strength has led to record levels of home ownership in the U.S., which stood at 68.6
     percent at the end of 2003.
          These macroeconomic forces were not the only driver of our past success, but they provide confidence that the future is bright for Lowe’s.
     Our strength and the strength of the home improvement industry is driven by several factors — demographic, social and economic.
          First, evolving demographic trends have been, and will continue to be, a positive force for Lowe’s and the home improvement industry.
     The large and influential Baby Boomer population is entering the peak second-home buying age and is driving a robust second-home market.
          Driven by this phenomenon, some estimates suggest that 150,000 second homes will be built each year for the rest of this decade. In
     addition, Boomers are more time-strapped than ever and are looking for solutions that make their lives easier. One-stop-shopping
     convenience and an ever-expanding array of installation services makes Lowe’s a destination to fulfill their needs.
          Generation Xers are in the family formation years and are looking for ways to improve their home’s function, safety and appeal. This
     generation values information that allows it to initiate projects. Our informative signage and knowledgeable employees provide just the
     resources these customers demand.
          And finally, Echo Boomers, also known as Gen Y, are focused on customization, frequently changing everything from paint
     to flooring to faucets to fulfill their desire for distinctiveness. This generation is coming of age and is actively influencing many purchasing
     decisions today. With over 40,000 products in stock, and hundreds of thousands more available by special order, these customers can find the
     products they’re looking for at Lowe’s.
          The second force driving home improvement is diversity. Home ownership among minorities is growing rapidly in the U.S., driven by
     an immigrant population focused on the American dream of owning a home. Harvard’s Joint Center for Housing Studies reports that in
     2001, minorities accounted for 32 percent of first-time homebuyers, and from 1995 to 2001, they represented 60 percent of the increase in
     households. Bilingual employees, targeted advertising and unique products to meet varying cultural styles are just a few of the things we’re
     doing at Lowe’s to meet the needs of our increasingly diverse customers.
          Third, Americans are more focused than ever on the comfort, security and warmth that home has to offer. As Americans deal with a
     tumultuous geopolitical environment and the stress of everyday life, keeping in touch with the people who matter remains a top priority, and
     they’re doing it at home. Home ownership was a cornerstone of the American dream long before interest rates began their latest decline in
     2001, and we believe a focus on the home and home improvement will remain part of the American dream even as interest rates rise.
          Finally, a growing trend in home improvement is a phenomenon known as “serial remodeling.” Inspired by innovation and energy
     efficiency, home improvement is being driven less by need and more by a sense of style and a desire to trade-up. Many customers are
     repainting their rooms with the most fashionable new color or replacing a working washer and dryer with new, more efficient appliances that
     clean better while using less water and energy. Innovation is the key, and we encourage our vendors to ensure they are providing inspirational
     products for our customers. This trend is in lockstep with our up-the-continuum merchandising strategy that ensures our customers will find
     quality and innovation in the products we offer at everyday low prices.
          We’ll capitalize on these trends by adding stores as well as enhancing existing stores to ensure we’re providing exactly what our
     customers are looking for. Lowe’s track record for keeping its finger on the pulse of the consumer is strong. In early 2004, Lowe’s was named
     Most Admired Specialty Retailer by FORTUNE® magazine for a second year in a row. That recognition is representative of the service our
     employees provided our customers and the financial results we delivered.
          I recently announced my plan to retire at the end of fiscal 2004, and Robert Niblock has been named chairman and chief executive officer-
     elect. I have full confidence in his ability to build on our success and take Lowe’s to its next level of growth and development. With Lowe’s
     strategic course firmly in place and a deep and talented management team committed to ensuring Lowe’s future success, I am convinced that
     now is the ideal time for me to continue the process of handing the reins of the company over to Robert. I look forward to working closely with
     him this year as we execute a smooth and orderly transition. Under the direction of Robert and Lowe’s seasoned management team, and with a
     bright outlook for the home improvement industry, I am confident we can look forward to many more years of success.


      robert l. tillman
      chairman of the board and chief executive officer
      April 16, 2004 Mooresville, NC


04 LOWE’S COMPANIES, INC.
To our shareholders.                   As I reflect on my first year as president of Lowe’s, I’m proud of the results we delivered in 2003. Our
employees were passionate about taking care of our customers, focused on executing the fundamentals of retailing, and delivered exceptional
results that wouldn’t have been possible without the entire team working as one.
     We’ve described for years the value we see in developing the appropriate infrastructure to manage our growing store base. The value of
our structure was highlighted in 2003 as comparable store sales ramped from flat in the first quarter to over 12 percent in the third quarter.
Our state-of-the-art logistics and distribution infrastructure allowed us to keep our stores in stock with the right products to satisfy the strong
demand we experienced in the second half of the year, while leveraging inventory growth. Our disciplined operating structure allowed us to
match payroll hours to sales across the entire chain, with a controlled model that leverages sales and ensures customer service levels remain
high. The results we delivered in 2003, including strong sales, great customer service and high in-stock levels, are a testament to the value of
that structure and could not have been achieved without the entire Lowe’s team working together.
     For fiscal 2004, we added two new divisions and three regions to our store operations structure to ensure an effective management system
is in place to deliver our customers a consistent Lowe’s experience no matter where they shop.
     While execution of the basics is fundamental to our success, Installed Sales, Special Order Sales (SOS) and our Commercial Business
Customer (CBC) initiatives continue to evolve to better serve our customers. This year, we began rolling out an enhanced installed sales
model designed to better communicate and manage our customers’ expectations. At the end of 2003, the new model was in place in 380
stores. We continue to be extremely pleased with the results of this model. Customers, installers and employees tell us the model works, and
we are seeing the success in improving customer satisfaction scores. Over 90 percent of the customers experiencing the model say they would
use Lowe’s again for a future installed project. We expect to have the new model in all stores by the end of fiscal 2004, allowing us to better
serve the growing “do-it-for-me” customer base.
     Enhancements to our SOS process continue to make selecting, ordering and tracking these sales more convenient and worry-free. In the
second half of 2003, we completed the rollout of our SOS Express program for fashion plumbing. The new automated system improves
inventory visibility and, utilizing a dedicated distribution facility, provides accurate and timely fulfillment of orders. Additionally, the new
system informs the customer about related products needed to complete or complement the project. As with our installed sales model, the best
way to measure the success of this new model is with customer satisfaction. We’ve seen sales return rates cut in half — evidence of the efficient
new technology. One of the most exciting aspects of SOS Express is that the model can be leveraged into many other categories. We will explore
these opportunities in 2004 and beyond, as we provide our customers a more efficient process to fulfill their desire to differentiate their homes.
     And finally, our CBC business continues to drive strong results, delivering comparable store sales higher than the company average in 2003.
Our commitment to commercial customers remains strong, and we’re excited about the growth prospects going forward. Providing great inventory
depth and knowledgeable staff is paramount to our success with commercial customers. We’re utilizing our direct marketing capabilities to remind
commercial customers we have the products and brands they need, in the quantities they demand, all at everyday low prices.
     Our merchandising organization continues to partner with well-known national vendors to develop and provide great products for our
customers. An excellent example unveiled in 2003 is American Tradition® Signature Colors. An enhancement of our existing American Tradition
                                                                                              ®


line of paint, Signature Colors adds a premium assortment of thousands of designer colors to our interior paint offering. Shades inspired by Eddie
Bauer,® Nickelodeon, Waverly® and other well-known brands give our customers unmatched selection to add their unique style to any room.
                      ™


     This is just one of the numerous examples of how our merchants are constantly working with our vendors to differentiate Lowe’s product
offering, keep our stores fresh and ensure we’re providing our customers exciting new products that make home improvement easier and
more enjoyable.
     Our 2003 marketing programs were successful in solidifying Lowe’s position as a preeminent national retailer where do-it-yourself and
commercial customers alike can find the products and services to turn a house into a home. Our “Improving Home Improvement®”
campaign continues to evolve and is hitting home with customers across America. Our marketing message is representative of the consistently
inviting and inspirational shopping environment found in each of our stores across the country.
     Our theme for this year’s National Sales Meeting was Defining Opportunity, and that’s just what we intend to do in 2004. We see oppor-
tunities in everything we do, as we strive to better serve our customers and to fulfill Lowe’s vision to be the first choice for home improvement
in each and every market we serve. From the initial welcome as a customer walks through our doors, to an enthusiastic salesperson who helps
a dream become a reality, we will continually look for opportunities to enhance customer service and make our customers’ lives easier.
     I am honored by the support and confidence of Bob Tillman, which led to the Board of Directors’ decision to name me chairman and
CEO-elect. I am also very fortunate to have in place a seasoned executive team who, in their collective experience, represent the gold standard
in the home improvement industry. Together, we look forward to continuing to drive value for our shareholders, customers, employees,
suppliers, and the communities we serve. Building on Bob Tillman’s vision, which launched Lowe’s into a new era more than a decade ago, I
look forward to the challenges and opportunities ahead of us. I accept this responsibility knowing our company has a clear vision, a sound
strategy, high quality leadership and an enabling culture that provides the foundation I’m confident will lead to continued success.


robert a. niblo ck
president
April 16, 2004 Mooresville, NC

                                                                                                                                  2003 ANNUAL REPORT 05
“This is my home.”


06 LOWE’S COMPANIES, INC.
“It’s the most amazing thing to watch. When customers start describing
                  their home to you, their eyes come to life. You no longer see a man
        or woman looking for a product, you see a person passionate about making
             the time they spend at home with family and friends more rewarding.”
                                                                                                     T E R E S A J O H N S O N | District Manager


                                     Investing in the American dream. The house you can see from the
                                      street is just the beginning of the place our customers call home. Behind the front door
                                      lies a family retreat, a place to entertain friends and a place to teach children to take their
                                      first steps. It is most often a family’s largest single investment and, as a result, home
                                      improvement decisions are far more than an impulse purchase. Because we understand
                                      how much home means to our customers, we are committed to providing what they need
                                      to get it right the first time. From the wide variety of products we offer, to the professional
services that leverage our customers’ time, we want to ensure Lowe’s is the first choice for their home improvement needs.
    As Lowe’s continues to expand across the U.S., our stores reflect the markets they serve. From the specialized roofing
requirements of our customers in southwestern ranches, to the space-saving home organization needs of our customers in
metropolitan brownstones, Lowe’s conducts extensive research into the home improvement needs of each market and
continues to work with our customers, vendors and employees to fine-tune our product offering, ensuring that all our
customers find just what they need.
    As an increasingly diverse customer base takes part in the American dream of home ownership, Lowe’s has positioned
itself to offer products that allow customers to express their individuality through their homes. From the Jackson & Perkins®
roses that adorn front lawns, to the custom decks that provide a backyard retreat, Lowe’s is pleased to offer over 40,000
products in stock and hundreds of thousands more by special order, allowing our customers’ homes to become a personal
reflection of who they are — unique, individual and diverse. And with so many choices across the entire price continuum,
customers can find just the products they need at everyday low prices.


                                                                                                                           2003 ANNUAL REPORT 07
“This is just
         the right color.”


08 LOWE’S COMPANIES, INC.
“When it comes to their homes, whether they need something as
               small as a screw for the hinge or the entire front door, our customers do
                 not compromise. They don’t see it as making choices for their homes;
                        they see it as making choices for their families. Every decision is
                  passionate, driven by their own personal style and sense of comfort.”
                                                                                               L I S M A N D O L P H Y | Store Manager, Alton, IL


                                     Investing in the ideal shopping experience. At Lowe’s, we know
                                        Porcelain Red is not the same as Richly Red and there’s more than a shade difference between
                                        almost the right color and just the right color. From our thousands of colors of paint to over
                                        250 appliances in-stock, customers can find just what they’re looking for at Lowe’s. And with
                                        several showrooms under one roof, it’s easy for our customers to do more than buy products.
                                        They can find complete solutions for their home improvement projects.
                                            From the commercial business customer supported by a dedicated service desk and
employees trained to handle their more complex needs, to the novice do-it-yourselfer beginning her first home improvement
project, our goal is to make sure the shopping experience is satisfying for every customer. Wide, bright aisles, well-stocked shelves,
simple directional signage, and organized store layouts ensure our customers find a shopping experience unmatched in the
industry. With a team of certified specialists available to assist customers with home improvement questions, help from courteous,
knowledgeable employees is always close by.
    In 2003, Lowe’s enhanced its installation services model and improved the experience for those customers with little time
or inclination to complete major projects. Customers are guided through the installation process with clearly defined time frames
and expectations. As Lowe’s certified installers work to complete the installation, customers receive follow-up phone calls,
and after the installation is completed, an on-site job inspection is conducted to ensure the 100 percent satisfaction that customers
have come to expect from Lowe’s. Our customers take comfort in knowing that a company with 58 years of experience in home
improvement stands behind the job.
    Customers looking for ways to express their unique tastes through products beyond what we carry on our shelves will be excited
by the enhancements to our special order sales (SOS) program. Through technological improvements customers can view available
special order products and their features with relative ease. Additionally, the ordering process was upgraded to allow electronic
order placement, giving employees and customers the opportunity to monitor an order from the time it is placed until the order is
completed and received. The new solution substantially reduced the error rate in millwork special orders and significantly increased
average ticket sales in that category. Building on our success with millwork, we rolled out SOS Express in late 2003 for our fashion
plumbing category, tying automated SOS systems with enhanced distribution capabilities. Additional opportunities to utilize this
technology lie in the months and years ahead as we bring process improvements to additional product categories.
    As these enhancements to our installed sales model and special order program improve the experience for our customers, we’re
confident we will capture a more significant portion of the installation and special order markets, adding value for our shareholders.


                                                                                                                           2003 ANNUAL REPORT 09
“This is the brand I trust.”


10 LOWE’S COMPANIES, INC.
“Our customers will tell you, in home improvement, well-known,
                  national brands mean lasting quality and getting it right the first time.
                      To our customers, it’s the difference between one coat of paint and
                      three coats. It’s the difference between a nice lawn and lawn envy.”
                                                                                                  D E B B I E T E M P L E | Merchandising Director


                                      Investing in what customers want. For retail and commercial customers
                                        alike, availability of brand-name products at everyday low prices is a big part of the shopping
                                        decision. At Lowe’s, we know our success and the success of the products we offer go hand
                                        in hand. Strategic alliances allow us to enhance our offerings with new, exclusive products.
                                        For example, our relationship with Pella®, a millwork manufacturer known for high standards
                                        and quality products, began with a program focused on wooden doors and windows. The
                                        relationship expanded, capitalizing on the increasingly growing vinyl window market by
creating Thermastar, a complete line of vinyl windows of unsurpassed quality. Today, we’re moving rapidly to convert every Lowe’s
                      ®


store into a Pella Design Center store, highlighting the extended line of Pella-branded products that are suited for each particular
market we serve. A significant partnership for Lowe’s and Pella … developed from a window of opportunity.
    As Lowe’s continues to build its brand through alliances with preeminent national brands, we are able to increase convenience for
our customers by offering complete home improvement solutions under one roof. Customers can find complete outdoor solutions
including Bayer Advanced™ plush green lawn care products, Cub Cadet® and Husqvarna® outdoor power equipment, a full line of
award-winning Jackson & Perkins® roses, stylish and durable Coleman® outdoor furniture, powerful Jenn-Air® grills and unmatched
National Geographic™ birding products. Our Signature Colors® premium paints feature thousands of colors, allowing customers
to autograph their homes with designer palettes from names like Nickelodeon™ and Eddie Bauer® to Waverly.® And we’ve got every
other aspect of home covered, including offering the award-winning designs of Kichler® lighting, the innovation of KitchenAid® and
Whirlpool® appliances, the flexibility of Shop-Vac® wet/dry vacuums and the durability of Bosch and Hitachi power tools and accessories.
    We have a deep sense of appreciation, respect and responsibility for the brands entrusted to us, and we are focused on the
needs of our customers. Our up-the-continuum strategy, coupled with our everyday low price guarantee, ensures we have the right
brands, inspirational products and a wide range of solutions that meet every budget and taste.
    Lowe’s realizes the tools our customers need go beyond the tools on our shelves. Our customers can find the educational
tools at Lowe’s that build confidence to initiate projects. Free weekly “How-To” clinics at every store offer our customers the
opportunity to broaden their knowledge and develop their home improvement skills. Through affinity clubs such as Lowe’s
Garden Club® and Lowe’s Woodworkers Club, customers receive exclusive offers, fun projects, and tips throughout the year in their
                                                 ®


particular areas of interest — all at no cost to them. And home improvement education continues online at Lowes.com with an
online How-To Library containing a wealth of information available to our customers, from Creative Ideas magazine, to step-by-
step installation and remodeling procedures. Whether their needs are simple or complex, Lowe’s is committed to make the
investment in what our customers want.
                                                                                                                            2003 ANNUAL REPORT 11
“This is who
                            I come to for advice
                                and support.”


12 LOWE’S COMPANIES, INC.
“It’s hard to describe the pride I feel when I see the customers we call ‘regulars’
    come in. I know they have choices, and just the fact they choose to come back
               time and time again lets me know our employees are doing it right.”
                                                                                                       M I K E H I C K S | District Manager


                                    Investing in our employees. Behind each red vest, our customers can find
                                      direction, encouragement and advice. At Lowe’s our culture is one of service and we are
                                      committed to equipping our employees with the right tools to satisfy our diverse customers’
                                      needs. In addition to ongoing comprehensive training, Lowe’s enhanced our Customers First
                                      program in 2003, a program designed to define excellence in service and execution of the
                                      fundamentals of retailing. While everyday low prices and quality products bring customers
                                      through our doors, it’s the people and the level of service that keep them coming back.
    Our people are the foundation of our success and the primary contact with customers. An investment in them is an
investment in the long-term success of Lowe’s. In addition to competitive compensation and bonus opportunities, Lowe’s
offers employee benefits such as an employee stock purchase plan, which provides employees the opportunity to purchase
Lowe’s stock at a discount and encourages them to share in the ownership of the company. Through the company’s 401(k)
retirement savings vehicle, contributing employees receive a baseline match with the opportunity to earn an additional
performance match as a reward for helping Lowe’s reach its earnings goals.
    Lowe’s encourages employees to grow with the company and supports this growth with financial assistance to attend
colleges and universities, executive development opportunities and management training programs. Our store manager
training program, an integral part of our management development, seeks to cultivate tomorrow’s store managers through
extensive training sessions. As a part of the program, Larry Stone and other members of Lowe’s executive management team
are actively involved in providing insight to the store managers of tomorrow, a testament to the importance Lowe’s places on
continuity in management and the sharing of knowledge. With a culture of promoting from within, Lowe’s has a pipeline of
seasoned talent ready for the opportunity to manage a new Lowe’s store.
    The culture at Lowe’s is one of dignity, mutual respect, personal pride and fairness, which fosters an environment
committed to diversity and inclusion. As our workforce grows, open communication across the chain continues to be a focus,
nourished through our monthly employee newsletter, the Lowedown, sharing relevant company information with all employees.
Through employee surveys and open doors to management, employees are invited to share their thoughts, ideas and
suggestions. The foundation on which Lowe’s stands is made up of our employees, 147,000 and growing. Providing world-class
service one customer at a time, Lowe’s employees stimulate innovation and help maximize the performance of the company.


                                                                                                                     2003 ANNUAL REPORT 13
“This is where I live.”


                                                                                                            Distribution Centers
                                                                                                            Existing Stores
                                                                                                            New Stores in 2003


                                     Lowe’s Stores : Includes projected store openings in Fiscal ’04
      AK: 2       CA: 65    FL: 71   ID: 4     KY:   28    MI: 36     MT:    3   NJ: 28      OH:   67   RI: 3      TX:   93      WV: 14
      AL: 29      CO: 14    GA: 49   IL: 24    LA:   20    MN: 1      NC:   77   NM: 8       OK:   21   SC: 34     UT:    9      WY: 1
      AR: 13      CT: 6     HI: 3    IN: 36    MA:   14    MO: 24     ND:    2   NV: 10      OR:    9   SD: 1      VA:   47       1,088
      AZ: 16      DE: 5     IA: 9    KS: 9     MD:   21    MS: 14     NE:    3   NY: 31      PA:   47   TN: 43     WA:   24      STORES


14 LOWE’S COMPANIES, INC.
“When a new neighbor moves in next door to you, I think everyone’s
            initial reaction is the same. You hope they will be friendly, courteous, and
             a good fit within the community. I get excited every time we announce a
                     new Lowe’s store, because that’s just the kind of neighbor we are.”
                                                                                           J O R G E R O D R I G U E Z | Store Manager, Bryan, TX


                                     Investing nationwide. We are meeting our customers where they live. In their
                                      neighborhoods with new stores; at their homes with an enhanced installed sales model;
                                      and online with educational and purchasing tools on Lowes.com. We answered the call
                                      to become increasingly more convenient with 130 new stores in 2003, expanding with
                                      both our 116,000-square-foot prototype in metro markets and our 94,000-square-foot
                                      store predominately in the smaller markets of the U.S. Incredible growth opportunities
                                      still remain … opportunities that will continue to broaden Lowe’s position as a one-stop
shopping location for home improvement. With 140 stores planned for 2004, we will continue to increase our national
presence, market penetration and convenience for our customers.
     For our customers, convenience means more than just a store closer to their homes. It means having the right products
at the right time in the right places and at the right prices. And it’s the part of Lowe’s most customers never see that enables us
to deliver on our promise. Behind the well-stocked shelves of products in the quantities necessary to meet our customers’
needs is a distribution infrastructure that includes a network of nine state-of-the-art regional distribution centers, allowing us
to flow product efficiently to every store, regardless of the location. Efficient distribution is the key to profitably serving small
markets and vital to flowing product to high-volume, large markets to maximize sales.
     And we are more than a home improvement store to the markets we serve. We are a good neighbor. During the year, Lowe’s
responded to more than 40 natural disasters in 23 states. Following Hurricane Isabel and the California wildfires, Lowe’s and
its employees rushed relief supplies to aid victims of the disasters. Through the combination of a Lowe’s customer donation
program, corporate contributions, and Lowe’s Racing for Relief program with Team Lowe’s NASCAR driver Jimmie Johnson,
Lowe’s and its customers were able to contribute over $580,000 in response to these two disasters alone.
     As a co-sponsor with Whirlpool Corporation on the Habitat for Humanity Jimmy Carter Work Project, Lowe’s impacted
communities in the Southeast, donating nearly $375,000 to facilitate the construction of more than 100 homes. And as a
continuation of its long-standing support, in 2004, Lowe’s will donate $2 million to help families achieve the dream of home
ownership by joining forces with Habitat across the country as the national partner for Habitat’s Women Build program.
     Fulfilling Lowe’s mission to improve the communities it serves, Lowe’s Charitable and Educational Foundation awarded ten
$100,000 grants in 2003, with six of them going to K-12 public education systems throughout the country. Additionally, Lowe’s
is a proud supporter of the American Red Cross, the Home Safety Council, United Way of America and numerous nonprofit
organizations and programs that help communities across the country. Lowe’s also encourages volunteerism through the Lowe’s
Heroes program, a company-wide employee volunteer initiative aimed at addressing safety at home.
                                                                                                                           2003 ANNUAL REPORT 15
“What you want.”
  “This is my store.”
                                                                      Our customers’ homes are a piece of their dreams. Quality
                                                                         products and trusted brands are necessary to turn those
                                                                     dreams into reality. With over 40,000 products in our stores
                                                                       and hundreds of thousands available through our Special
                                                                     Order program, our diverse customers have the freedom to
                                                                             express their unique tastes throughout their homes.


                                 “How you want it.”                                             “The way you want it.”
         Customers return to our stores knowing that whether                   We know the importance of delivering more than just
               they need an accurate cut, a precise color match,              products, whether it’s a commercial business customer
       professional installation or a quick delivery, they can get       pressed for time, or a family beginning a major remodeling
                it at Lowe’s at low prices, every day, guaranteed.                    project. With well-staffed, organized stores and
                                                                               knowledgeable employees who stand ready to provide
                                                                            exceptional customer service, Lowe’s delivers a shopping
                                                                                                    experience that’s second to none.


16 LOWE’S COMPANIES, INC.
“When you want it.”                                                 “Where you want it.”
   With a state-of-the-art distribution and logistics network             With 130 new stores in 2003, we are continuing to meet
 that can replenish merchandise quickly, our customers find                 our customers where they live. And convenience goes
 well-stocked shelves with the products they need when they               beyond adding new stores. It continues both inside and
             need them, in the right quantities for their jobs.              outside of our stores with online shopping services,
                                                                          computer project design, convenient credit options and
                                                                                    delivery services available seven days a week.


Investing in our future. We see tremendous opportunity ahead for Lowe’s. Our expansion continues with 140
stores planned for 2004 and 150 planned for 2005. And we will continue to work toward growth within our existing product
categories to gain market share in the highly fragmented home improvement marketplace.
    Our technology continues to evolve to meet the ever-changing needs of our growing customer base, and we will continue
to seek opportunities to serve our customers more efficiently and more effectively, furthering our vision to be our customers’
first choice for home improvement.
    As ENERGY STAR® retail partner of the year, FORTUNE® magazine’s Most Admired Specialty Retailer and a supporter
of numerous nonprofit organizations and programs across the country, we take our responsibilities as a corporate citizen
seriously. We look forward to continuing to be good neighbors and socially responsible citizens, adding jobs in our
communities, and lending a helping hand where it’s needed.
    We continue to define new opportunities for Lowe’s as the home improvement landscape continues to evolve, but there is
one thing that will not change … our unwavering focus on serving our customers, making sure they each know they are Lowe’s
most important customer.


                                                                                                                2003 ANNUAL REPORT 17
2003 Financial Report
         18. Management’s Responsibility for            27. Consolidated Balance Sheets.                 39. Quarterly Review of Performance.
             Financial Reporting.                       28. Consolidated Statements                      40. Stock Performance, Stock Splits
         19. Management’s Discussion and                    of Shareholders’ Equity.                         and Stock Dividends.
             Analysis of Financial Condition            29. Consolidated Statements                      41. Selected Financial Data.
             and Results of Operations.                     of Cash Flows.                               42. 10-Year Financial History.
         25. Independent Auditors’ Report.              30. Notes to Consolidated
         26. Consolidated Statements                        Financial Statements.
             of Earnings.


  Management’s Responsibility for Financial Reporting
         Lowe’s management is responsible for the preparation, integrity and fair presentation of its published financial statements. These
         statements have been prepared in accordance with accounting principles generally accepted in the United States of America and as such,
         include amounts based on management’s best estimates and judgments. Lowe’s management also prepared the other information
         included in the annual report and is responsible for its accuracy and consistency with the financial statements.
             The Company’s financial statements have been audited by the independent accounting firm Deloitte & Touche LLP, which was given
         unrestricted access to all financial records and related data. The Company believes that all representations made to the independent
         auditors during their audit were valid and appropriate. Deloitte & Touche’s audit report presented here provides an independent opinion
         upon the fairness of the financial statements.
             The Company maintains a system of internal control over financial reporting, which is designed to provide reasonable assurance to
         Lowe’s management and Board of Directors regarding the preparation of reliable published financial statements. The system includes
         appropriate divisions of responsibility, established policies and procedures which include a code of conduct to foster a strong ethical
         climate, each of which are communicated throughout the Company, and the careful selection, training and development of its people.
         Internal auditors monitor the operation of the internal control system and report findings and recommendations to management and the
         Board of Directors, and corrective actions are taken to address control deficiencies and other opportunities for improving the system as
         they are identified. The Board, operating through its audit committee, provides oversight to the financial reporting process.


         robert l. tillman                                              r o b e r t f. h u l l , j r .
         chairman of the board and                                      senior vice president and
         chief executive officer                                        chief financial officer


  Disclosure Regarding Forward-Looking Statements
         Our Annual Report talks about our future, particularly in the “Letter to Shareholders” and “Management’s Discussion and Analysis of
         Financial Condition and Results of Operations.” While we believe our expectations are reasonable, they are not guarantees of future
         performance. Our actual results could differ substantially from our expectations because, for example:
         * Our sales are dependent upon the general economic health of the country, variations in the number of new housing starts, the level
           of repairs, remodeling and additions to existing homes, commercial building activity, and the availability and cost of financing.
           An economic downturn can impact sales because much of our inventory is purchased for discretionary projects, which can be delayed.
           In addition, on a short-term basis, weather may impact sales of product groups like lawn and garden, lumber, and building materials.
         * Our expansion strategy may be impacted by environmental regulations, local zoning issues and delays, availability and development
           of land, and more stringent land use regulations than we have traditionally experienced as well as the availability of sufficient labor to
           facilitate our growth.
         * Many of our products, like lumber and plywood, are commodities whose prices fluctuate erratically within an economic cycle.
         * Our business is highly competitive, and as we expand to larger markets and to the internet, we may face new forms of competition
           which do not exist in some of the markets we have traditionally served.
         * The ability to continue our everyday competitive pricing strategy and provide the products that customers want depends on our
           vendors providing a reliable supply of inventory at competitive prices and our ability to effectively manage our inventory.
         * Our commitment to increase market share and keep prices low requires us to make substantial investment in new technology and
           processes whose benefits could take longer than expected and could be difficult to implement.

18 LOWE’S COMPANIES, INC.
Management’s Discussion and
                                   Analysis of Financial Condition and Results of Operations
This discussion summarizes the significant factors affecting           Initiatives Driving Performance Lowe’s believes the EDLP strat-
the Company’s consolidated operating results, financial condition,     egy and its low-price guarantee increase homeowner and com-
liquidity and capital resources during the three-year period ended     mercial business customer traffic, which leads to increased sales.
January 30, 2004 (i.e., fiscal years 2003, 2002, and 2001). Each of    Lowe’s is able to maintain its commitment to EDLP primarily by
the fiscal years presented contains 52 weeks of sales and expenses.    controlling inventory costs. The Company uses product line
This discussion should be read in conjunction with the financial       reviews and its global sourcing offices in Asia and other parts of the
statements and financial statement footnotes included in this          world to enhance margins while still providing its customers the
annual report.                                                         value they have come to expect from Lowe’s.
    During the fourth quarter of fiscal 2003, the Company sold 26          To ensure that Lowe’s is satisfying its customers’ needs, from
commodity-focused locations operating under The Contractor             opening price points to premium products, the Company per-
Yard name (the “Contractor Yards”). This sale was effected to allow    forms rigorous product line reviews. Product line reviews involve
the Company to continue to focus on its retail and commercial          extensive market research, collaboration with vendors, and input
business. In accordance with Statement of Financial Accounting         from cross-functional teams to identify the optimal assortments,
Standards (SFAS) No. 144, “Accounting for the Impairment or            selection, brands and displays, as well as ways to lower costs.
Disposal of Long-Lived Assets,” the Company has reported the           Through the product line review process, Lowe’s has identified
results of operations of the Contractor Yards as discontinued oper-    areas in which its customers have expressed a desire for products
ations for fiscal 2003, 2002 and 2001.                                 that are more unique, higher quality or provide more options than
                                                                       an opening price point product may offer. To satisfy this customer
                                                                       desire, Lowe’s implemented its up-the-continuum strategy for a
Executive overview.                                                    variety of products, which involves offering more product choices
Lowe’s serves approximately 10 million customers a week at more        in the middle and upper end of a price range. This initiative results
than 950 home improvement stores in 45 states. Lowe’s vision is to     in higher operating margins, defined as gross margin less selling,
be its customers’ first choice for home improvement in each and        general and administrative expenses (SG&A) and depreciation, for
every market served. To do this, Lowe’s focuses on gaining cus-        the Company. As a result of this initiative, Lowe’s is capturing an
tomer loyalty by differentiating itself from competitors. Lowe’s       increasing amount of the high-end market, which has grown sub-
current strategy is to achieve this vision through excellent cus-      stantially in the past several years. Based on the success the
tomer service, Everyday Low Prices (EDLP), continued expansion,        Company has experienced to date with this initiative in nearly
development of the appropriate infrastructure to support growth,       every product category, management believes that “up-the-
retention of its best employees, innovative merchandising strate-      continuum” is the right strategy for Lowe’s to continue to capital-
gies, and specialty sales initiatives including Installed Sales, the   ize on this trend and increase comparable store sales growth.
Commercial Business Customer and Special Order Sales.                      The market research performed during product line reviews
    These strategies encompass a variety of initiatives driving        has also led the Company to concentrate on differentiating itself
Lowe’s current performance, which collectively contributed to          from competitors through valued national brands. Lowe’s brand-
Lowe’s comparable store sales growth of 6.7% for fiscal 2003.          ing strategy is designed to build the Lowe’s brand quickly, effi-
Other factors contributing to Lowe’s 2003 sales performance            ciently, and effectively by offering its customers the best-known,
include strong demand fueled by its customers’ commitment to           and most-respected national brands. These are brands that Lowe’s
investing in their homes, supplemented by a solid housing market       customers value and trust and increasingly include Lowe’s exclu-
and increased disposable income aided by lower Federal individual      sive brands.
income tax withholding rates and income tax rebates. Increased             As “do-it-yourself” expands to more “do-it-for-me” projects,
wholesale prices of lumber and plywood, which translated into          Lowe’s targets three key specialty sales areas: Installed Sales, the
higher retail prices of these products, also contributed to the        Commercial Business Customer and Special Order Sales. The
increased comparable store sales.                                      Company is targeting these areas because its commercial cus-
    In spite of concerns about the impact of potential increases in    tomers perform a significant portion of the “do-it-for-me” remod-
interest rates on the home improvement market, the strength in         eling services. Lowe’s currently offers a variety of installation serv-
the housing market has continued. Mortgage rates have remained         ices, driven by three main categories: kitchen (cabinets, appliances
low, keeping housing affordable and facilitating continued             and countertops), floor coverings, and millwork products. Lowe’s
demand. Consumer confidence has improved, which management             goal with all installed projects is to make the process as easy as pos-
believes will contribute to further growth. In addition, the Home      sible for customers. To do this and keep up with the continued
Improvement Research Institute predicts an average of nearly 5%        growth in installed sales, Lowe’s has been working to build a scala-
industry growth per year for the next several years.                   ble model to enhance its services and improve customer experi-
                                                                       ence. The Company expects to have this model available in all
                                                                       Lowe’s stores by the end of fiscal 2004.

                                                                                                                                2003 ANNUAL REPORT 19
When it comes to commercial customers, Lowe’s targets the              long-length products like lumber, plywood, ladders, and pipe.
         professionals serving the needs of homeowners. These profession-           Delivering these products on flat-bed trucks allows employees at
         als include remodelers, small builders, maintenance and property           the stores to off-load them quickly. To support Lowe’s store expan-
         managers and specialty trades, like electricians, plumbers and             sion plans, the Company is planning to open three additional
         landscapers. Lowe’s also wants to position itself as an alternative to     flatbed distribution centers in 2004.
         traditional supply houses and leverage core business strengths to              The Company expects to open 140 stores in 2004 (including
         build the commercial business. These strengths include conven-             approximately four relocations), increasing total square footage by
         ience, ease of finding supplies, the EDLP strategy and specialized         approximately 14%. To manage this expansion, the Company is
         commercial credit programs. The Company believes increasing                adding two more divisions in fiscal 2004, bringing the total num-
         sales to commercial business customers offers the opportunity for          ber of divisions to five. With the addition of these two divisions,
         increasing overall sales and developing a more loyal customer base.        Lowe’s will increase its number of regions from 19 to 22 and its
             Lowe’s currently offers hundreds of thousands of products on           number of districts from 135 to 150. Lowe’s goal is to maintain a
         special order. Sales of these products have continued to outpace the       ratio of approximately 7-8 stores per district manager and 50-60
         Company’s overall sales growth. Lowe’s focus in 2003 was on                per regional vice president. This is consistent with Lowe’s commit-
         developing new technology that will allow the Company to effec-            ment to ensure that its stores are executing the Company’s plans
         tively and efficiently add and maintain special order options for its      and programs to continue to increase market share and better sat-
         customers. The Company created an electronic sales tool that               isfy customers with more convenience through additional store
         automates the configuration, ordering, fulfillment and replenish-          openings and an infrastructure to support growth.
         ment processes for special orders, reduces errors and lead time and            Lowe’s is also continuing to focus on improved management in
         increases visibility. In addition, the system will list other items cus-   its stores. As a result, in 2003, Lowe’s changed the management
         tomers may need to complete their project, which should improve            structure in its stores to provide store managers with a more struc-
         customer satisfaction and increase average ticket.                         tured management team and to provide employees with new
                                                                                    career opportunities. Lowe’s believes this focus on improved man-
         Expansion and Growth Potential Management believes there is                agement will help attract and retain the best employees.
         opportunity for Lowe’s continued growth as the Company moves
         forward with store expansion focused on major metropolitan mar-
                                                                                    Critical accounting policies
         kets. These metropolitan markets, which the Company defines as
                                                                                    and estimates.
         populations greater than 500,000, represent a significant untapped
                                                                                    The following discussion and analysis of the results of operations
         opportunity for Lowe’s. In fiscal 2003, Lowe’s opened its first stores
                                                                                    and financial condition are based on the Company’s financial
         in the Chicago metropolitan market and has also announced plans
                                                                                    statements that have been prepared in accordance with accounting
         to open stores in other metropolitan markets. In addition, Lowe’s
                                                                                    principles generally accepted in the United States of America. The
         expanded its store count in Florida and California, two of the
                                                                                    preparation of these financial statements requires management to
         fastest-growing states in the U.S.
                                                                                    make estimates that affect the reported amounts of assets, liabili-
             While Lowe’s growth plans are increasingly targeting larger
                                                                                    ties, revenues and expenses, and related disclosures of contingent
         metropolitan areas, the Company continues to expand in smaller
                                                                                    assets and liabilities. The Company bases these estimates on his-
         markets. As a result, Lowe’s store opening plans include two proto-
                                                                                    torical results and various other assumptions believed to be rea-
         types: a 116,000-square-foot (116K) store for major metropolitan
                                                                                    sonable, the results of which form the basis for making estimates
         markets and a 94,000-square-foot (94K) store primarily to serve
                                                                                    concerning the carrying values of assets and liabilities that are not
         smaller markets. This smaller prototype will provide hundreds of
                                                                                    readily available from other sources. Actual results may differ from
         additional storing opportunities in smaller markets across the
                                                                                    these estimates.
         country. The store includes 94,000 square feet of retail selling space
                                                                                        The Company’s significant accounting polices are described in
         plus an approximate 26,000-square-foot garden center, and has the
                                                                                    Note 1 to the consolidated financial statements. Management
         same look and feel of Lowe’s larger stores. In the 94K store, Lowe’s
                                                                                    believes that the following accounting policies affect the more sig-
         has consolidated service in a number of departments and stocks
                                                                                    nificant estimates used in preparing the consolidated financial
         20% fewer SKUs than in the 116K stores. While there are fewer
                                                                                    statements.
         SKUs, the 94K store still offers strong assortments with a rational
         mix from opening price points to premium products. For items
                                                                                    Merchandise Inventory The Company records an inventory
         not stocked in a 94K store, special order options are available to
                                                                                    reserve for the loss associated with selling discontinued inventories
         meet customer needs. Expanding into these smaller markets is
                                                                                    below cost. This reserve is based on management’s current knowl-
         made possible by Lowe’s logistics and distribution capabilities that
                                                                                    edge with respect to inventory levels, sales trends and historical
         allow the Company to quickly and efficiently supply products to
                                                                                    experience relating to the liquidation of discontinued inventory.
         these stores.
                                                                                    Management does not believe the Company’s merchandise inven-
             The Company currently has nine regional distribution centers
                                                                                    tories are subject to significant risk of obsolescence in the near-
         located across the United States and plans to open an additional
                                                                                    term, and management has the ability to adjust purchasing
         center in 2004 and another in fiscal 2005. The Company also has
                                                                                    practices based on anticipated sales trends and general economic
         nine flatbed distribution centers for warehousing and distributing

20 LOWE’S COMPANIES, INC.
conditions. However, changes in consumer purchasing patterns                Self-Insurance The Company is self-insured for certain losses
could result in the need for additional reserves. The Company also          relating to worker’s compensation, automobile, general and prod-
records an inventory reserve for the estimated shrinkage between            uct liability claims. Self-insurance claims filed and claims incurred
physical inventories. This reserve is based primarily on actual             but not reported are accrued based upon management’s estimates
shrinkage results from previous physical inventories. Changes               of the discounted aggregate liability for uninsured claims incurred
in actual shrinkage results from completed physical inventories             using actuarial assumptions followed in the insurance industry
could result in revisions to previously estimated shrinkage                 and historical experience. These estimates are subject to changes in
expense. Management believes it has sufficient current and histor-          forecasted payroll, sales and vehicle units, as well as the frequency
ical knowledge to record reasonable estimates for both of these             and severity of claims. Although management believes it has the
inventory reserves.                                                         ability to adequately record estimated losses related to claims, it is
                                                                            possible that actual results could differ from recorded self-insur-
Vendor Funds The Company receives funds from vendors in the                 ance liabilities.
normal course of business for a variety of reasons, including pur-
chase-volume-related rebates, defective merchandise allowances,
                                                                            Operations.
advertising allowances, reimbursement for selling expenses, dis-
                                                                            Net earnings for 2003 increased 28% to $1.9 billion or 6.1% of
plays and third-party, in-store service-related costs. Management
                                                                            sales compared to $1.5 billion or 5.6% of sales for 2002. Net earn-
uses projected purchase volumes to determine earnings rates, vali-
                                                                            ings for 2002 increased 44% to $1.5 billion or 5.6% of sales com-
dates those projections based on actual and historical purchase
                                                                            pared to $1.0 billion or 4.7% of sales for 2001. Diluted earnings per
trends and applies those rates to actual purchase volumes to deter-
                                                                            share were $2.34 for 2003 compared to $1.85 for 2002 and $1.30
mine the amount of funds earned by the Company and receivable
                                                                            for 2001. Return on beginning assets, defined as net earnings divid-
from the vendor. Amounts earned could be impacted if actual
                                                                            ed by beginning total assets, was 11.7% for 2003, compared to
purchase volumes differ from projected purchase volumes. The
                                                                            10.7% for 2002 and 9.0% for 2001, and return on beginning share-
Company has historically treated volume-related discounts or
                                                                            holders’ equity, defined as net earnings divided by beginning
rebates as a reduction of inventory cost and reimbursements of
                                                                            shareholders’ equity, was 22.6% for 2003, compared to 22.0% for
operating expenses received from vendors as a reduction of those
                                                                            2002 and 18.6% for 2001. Return on invested capital, defined as net
specific expenses. The Company’s historical accounting treatment
                                                                            earnings plus after-tax interest divided by the sum of beginning
for these vendor-provided funds is consistent with Emerging
                                                                            debt and equity, was 16.5% for 2003, compared to 15.1% for 2002
Issues Task Force (EITF) 02-16 “Accounting by a Customer
                                                                            and 13.8% for 2001.
(Including a Reseller) for Certain Consideration Received From a
                                                                                Sales amounts are from continuing operations and exclude
Vendor” with the exception of certain cooperative advertising
                                                                            sales from the Contractor Yard locations. The Company recorded
allowances and in-store services provided by third parties for
                                                                            sales of $30.8 billion in 2003, an 18% increase over 2002 sales of
which the costs are ultimately funded by vendors. The Company
                                                                            $26.1 billion. Sales for 2002 were 20% higher than 2001 levels. The
previously treated the cooperative advertising allowances and in-
                                                                            increases in sales are attributable to the Company’s ongoing store
store service funds as a reduction of the related expense. Under
                                                                            expansion and relocation program and comparable store sales
EITF 02-16, cooperative advertising allowances and in-store serv-
                                                                            increases. Comparable store sales increased 6.7% in 2003, com-
ice funds should be treated as a reduction of inventory cost, unless
                                                                            pared to 5.8% in 2002. Average ticket increased 4% from $56.80 in
they represent a reimbursement of specific, incremental and iden-
                                                                            2002 to $59.21 in 2003 due in part to the success of the up-the-
tifiable costs incurred by the customer to sell the vendor’s product.
                                                                            continuum initiative as well as Lowe’s credit programs.
The cooperative advertising and in-store service funds that the
                                                                                The comparable store sales increase in 2003 primarily resulted
Company receives do not meet the specific, incremental and iden-
                                                                            from improved sales in every merchandising category due to the
tifiable criteria in EITF 02-16. Therefore, for cooperative advertis-
                                                                            initiatives previously described. During the year, the Company
ing and third-party, in-store service fund agreements entered into
                                                                            experienced its strongest sales increases in lumber, building mate-
after December 31, 2002, which was the effective date of the relat-
                                                                            rials, outdoor power equipment, paint, flooring and home organi-
ed provision of EITF 02-16, the Company is treating these funds as
                                                                            zation. Major appliances continue to perform well and also exceed-
a reduction in the cost of inventory and recognizing these funds as
                                                                            ed the Company average comparable store sales increase. In addi-
a reduction of cost of sales when the inventory is sold. There is no
                                                                            tion, millwork, hardware, walls & windows, nursery and cabinets
impact to the timing of when the funds are received from vendors
                                                                            performed at approximately the overall corporate average compa-
or the associated cash flows, but there is an impact to the timing of
                                                                            rable store sales increase. Comparable store sales were positive for
income recognition. This accounting change did not have a mate-
                                                                            every product category and all geographic regions due in part to
rial impact on the fiscal 2003 financial results, since substantially all
                                                                            the implementation of the merchandising and operations strate-
of the cooperative advertising allowance and in-store service fund
                                                                            gies previously discussed. The Company experienced slight infla-
agreements for fiscal 2003 were entered into prior to December 31,
                                                                            tion in lumber and building material prices during the year, which
2002. The Company estimates that this one-time change in
                                                                            positively impacted comparable store sales by 50 basis points. The
accounting will reduce fiscal 2004 earnings per share by approxi-
                                                                            following table presents sales and store information excluding dis-
mately $0.13 per share.
                                                                            continued operations:

                                                                                                                                    2003 ANNUAL REPORT 21
Depreciation, reflecting continued expansion, increased 22% to
                                                            2003    2002    2001
         Sales (in millions)                             $30,838 $26,112 $21,714   $758 million in 2003, compared to increases of 21% and 26% in
         Sales Increases                                    18%     20%     18%    2002 and 2001, respectively. Depreciation as a percentage of sales
         Comparable Store Sales Increases                  6.7%    5.8%    2.5%
                                                                                   was 2.5% for 2003, a slight increase from 2.4% in 2002 and 2001.
         Average Ticket                                  $ 59.21 $ 56.80 $ 55.05
                                                                                   Approximately 95% of new stores opened in the last three years
         Average Ticket Increases                            4%      3%      2%
                                                                                   have been owned. Property, less accumulated depreciation,
         At end of year:
                                                                                   increased to $11.9 billion at January 30, 2004 compared to
         Stores                                              952     828     718
                                                                                   $10.4 billion at January 31, 2003. The increase in property resulted
         Sales Floor Square Feet (in millions)             108.8    94.7    80.7
                                                                                   primarily from the Company’s store expansion program and
         Average Store Size Square Feet (in thousands)       114    114     112
                                                                                   increased distribution capacity.
             Gross margin in 2003 was 31.2% of sales compared to 30.4% in              Net interest costs as a percent of sales were 0.6% for 2003, 0.7%
         2002. Both of these years showed improvement over the 29.0% rate          for 2002 and 0.8% for 2001. Net interest costs totaled $180 million
         achieved in 2001. The gross margin increases were driven not by           in 2003, $182 million in 2002 and $174 million in 2001. Interest
         higher prices, but rather the reduction of inventory acquisition          costs have decreased due to lower debt levels resulting from sched-
         costs. These lower inventory acquisition costs resulted in part from      uled debt repayments. Interest costs relating to capital leases were
         the product line review process, which takes costs out of the supply      $40 million for 2003 and 2002 and $41 million for 2001. See the
         chain, as well as the use of the Company’s sourcing offices to import     following discussion of liquidity and capital resources.
         products when possible. A reduction in inventory shrinkage as a               The Company’s effective income tax rates were 37.9%, 37.6%
         percentage of sales in all three years presented also contributed to      and 37.0% in 2003, 2002 and 2001, respectively. The higher rates
         the increase in margin. From 2002 to 2003, the reduction of inven-        were primarily related to expansion into states with higher state
         tory shrinkage resulted in a 14 basis point increase in gross margin.     income tax rates.
             SG&A expenses were $5.5 billion or 18.0% of sales in 2003.
         SG&A expenses in the two previous years were $4.7 billion and
                                                                                   Financial condition, liquidity
         $3.9 billion or 17.9% and 17.8% of sales, respectively. During 2003,
                                                                                   and capital resources.
         SG&A increased 19% compared to the 18% increase in sales. In
         2002, SG&A increased 21% compared to the 20% sales increase. In           The following table summarizes the Company’s significant
         2001, SG&A increased 17% compared to the 18% sales increase.              contractual obligations and commercial commitments.
         The increase as a percent to sales in SG&A in 2003 was primarily                                                                                   Payments Due by Period
                                                                                   Contractual
         due to stock compensation expense recorded as a result of the                                 ––––––––––––––––––––––––––––––––––––––––––––––––––––––––––––––––––––––––––––––––––––––––––––––––––––––––––––––––––––––––––––––––––––––––––––––––––––––––––––––––––


                                                                                   Obligations                                                   Less than                                1-3                               4-5                         After 5
         adoption of the fair value recognition provisions of Statement of         (In Millions)                             Total                  1 year                              years                             years                          years
         Financial Accounting Standards (SFAS) No. 123, “Accounting for            Long-Term Debt
                                                                                     (net of discount)   $ 3,773                                        $ 54                      $ 616                                $ 67                          $ 3,036
         Stock-Based Compensation,” prospectively for all employee awards
                                                                                   Capital Lease
         granted or modified after January 31, 2003. The increase as a per-
                                                                                     Obligations             770                                              60                          120                               118                             472
         cent to sales in SG&A in 2002 was primarily due to increased store
                                                                                   Operating Leases        3,220                                             225                          438                               432                           2,125
         salaries combined with increased bonus achievement levels driven          Purchase Obligations1     105                                             105                            –                                 –                               –
         by increased earnings. The decrease as a percent to sales in SG&A         Total Contractual
         during 2001 was primarily attributable to expense controls involv-          Cash Obligations    $ 7,868                                        $ 444                     $1,174                               $ 617                         $ 5,633
         ing payroll and advertising costs.                                            1Represents contracts for purchases of property and construction of buildings.
             Store opening costs, which were expensed as incurred, were
         $128 million for 2003 compared to $129 million and $140 million
                                                                                       The primary sources of liquidity are cash flows from operating
         in 2002 and 2001, respectively. These costs are associated with the
                                                                                   activities. Net cash provided by operating activities from continu-
         opening of 130 stores in 2003 (125 new and five relocated). This
                                                                                   ing operations was $3.0 billion for 2003 compared to $2.7 billion
         compares to 123 stores in 2002 (112 new and 11 relocated) and 115
                                                                                   and $1.6 billion in 2002 and 2001, respectively. The increase in cash
         stores in 2001 (101 new and 14 relocated). Because store opening
                                                                                   provided by operating activities during 2003 resulted primarily
         costs are expensed as incurred, the expenses recognized may fluc-
                                                                                   from increased net earnings. The increase in cash provided by
         tuate based on the timing of store openings in future or prior peri-
                                                                                   operating activities during 2002 resulted primarily from increased
         ods. As a percentage of sales, store opening costs were 0.4% for
                                                                                   net earnings, improved payables leverage due to better inventory
         2003 compared to 0.5% and 0.6% in 2002 and 2001, respectively.
                                                                                   turns and an increase in operating liabilities primarily due to the
         Store opening costs averaged approximately $1.0 million per store
                                                                                   increase in sales volume. Working capital at January 30, 2004 was
         in 2003 and 2002, and $1.2 million in 2001.
                                                                                   $2.3 billion compared to $2.0 billion at January 31, 2003.
                                                                                       The primary component of net cash used in investing activities
                                                                                   from continuing operations continues to be new store facilities and
                                                                                   the infrastructure to support this growth. Cash acquisitions of
                                                                                   fixed assets were $2.4 billion for both 2003 and 2002. This com-
                                                                                   pares to $2.2 billion for 2001. Retail selling space of 108.8 million
                                                                                   square feet as of January 30, 2004 increased 15% over the selling
22 LOWE’S COMPANIES, INC.
lowe's Annual Report2003

Mais conteúdo relacionado

Mais procurados

baxter international Schedules_Q2-05
baxter international Schedules_Q2-05baxter international Schedules_Q2-05
baxter international Schedules_Q2-05finance24
 
whirlpool Annual Report2006
whirlpool Annual Report2006whirlpool Annual Report2006
whirlpool Annual Report2006finance13
 
whirlpool Financial Highlights / Chairman's Letter
whirlpool Financial Highlights / Chairman's Letterwhirlpool Financial Highlights / Chairman's Letter
whirlpool Financial Highlights / Chairman's Letterfinance13
 
CVS Caremark 1998 Annual Report
CVS Caremark 1998 Annual ReportCVS Caremark 1998 Annual Report
CVS Caremark 1998 Annual Reportfinance3
 
fmc technologies 2003ar
fmc technologies 2003arfmc technologies 2003ar
fmc technologies 2003arfinance50
 
alltel 01 atar
alltel 01 ataralltel 01 atar
alltel 01 atarfinance27
 
Big_Lots_AR2004
Big_Lots_AR2004Big_Lots_AR2004
Big_Lots_AR2004finance50
 
autozone AZO_03AR
autozone  AZO_03ARautozone  AZO_03AR
autozone AZO_03ARfinance46
 
williams 2008 AR Final
williams 2008 AR Finalwilliams 2008 AR Final
williams 2008 AR Finalfinance21
 
fiserv annual reports 2004
fiserv annual reports 2004fiserv annual reports 2004
fiserv annual reports 2004finance47
 
hormel foods ALL1999
hormel foods  ALL1999hormel foods  ALL1999
hormel foods ALL1999finance46
 

Mais procurados (12)

baxter international Schedules_Q2-05
baxter international Schedules_Q2-05baxter international Schedules_Q2-05
baxter international Schedules_Q2-05
 
whirlpool Annual Report2006
whirlpool Annual Report2006whirlpool Annual Report2006
whirlpool Annual Report2006
 
whirlpool Financial Highlights / Chairman's Letter
whirlpool Financial Highlights / Chairman's Letterwhirlpool Financial Highlights / Chairman's Letter
whirlpool Financial Highlights / Chairman's Letter
 
GPI2004AR
GPI2004ARGPI2004AR
GPI2004AR
 
CVS Caremark 1998 Annual Report
CVS Caremark 1998 Annual ReportCVS Caremark 1998 Annual Report
CVS Caremark 1998 Annual Report
 
fmc technologies 2003ar
fmc technologies 2003arfmc technologies 2003ar
fmc technologies 2003ar
 
alltel 01 atar
alltel 01 ataralltel 01 atar
alltel 01 atar
 
Big_Lots_AR2004
Big_Lots_AR2004Big_Lots_AR2004
Big_Lots_AR2004
 
autozone AZO_03AR
autozone  AZO_03ARautozone  AZO_03AR
autozone AZO_03AR
 
williams 2008 AR Final
williams 2008 AR Finalwilliams 2008 AR Final
williams 2008 AR Final
 
fiserv annual reports 2004
fiserv annual reports 2004fiserv annual reports 2004
fiserv annual reports 2004
 
hormel foods ALL1999
hormel foods  ALL1999hormel foods  ALL1999
hormel foods ALL1999
 

Destaque

lowe's Annual Report1972
lowe's Annual Report1972lowe's Annual Report1972
lowe's Annual Report1972finance5
 
home depot Annual Report 1987
home depot Annual Report 1987home depot Annual Report 1987
home depot Annual Report 1987finance2
 
kohl's annual reports 2003
kohl's annual reports 2003kohl's annual reports 2003
kohl's annual reports 2003finance16
 
lowe's Annual Report1991
lowe's Annual Report1991lowe's Annual Report1991
lowe's Annual Report1991finance5
 
lowe's Annual Report1996
lowe's Annual Report1996lowe's Annual Report1996
lowe's Annual Report1996finance5
 
home depot Annual Report 1983
home depot Annual Report 1983home depot Annual Report 1983
home depot Annual Report 1983finance2
 
lowe's Annual Report1976
lowe's Annual Report1976lowe's Annual Report1976
lowe's Annual Report1976finance5
 
lowe's Annual Report1966
lowe's Annual Report1966lowe's Annual Report1966
lowe's Annual Report1966finance5
 
lowe's Annual Report1974
lowe's Annual Report1974lowe's Annual Report1974
lowe's Annual Report1974finance5
 
lowe's Annual Report1971
lowe's Annual Report1971lowe's Annual Report1971
lowe's Annual Report1971finance5
 
lowe's Annual Report1997
lowe's Annual Report1997lowe's Annual Report1997
lowe's Annual Report1997finance5
 
lowe's Annual Report1992
lowe's Annual Report1992lowe's Annual Report1992
lowe's Annual Report1992finance5
 
lowe's Annual Report1963
lowe's Annual Report1963lowe's Annual Report1963
lowe's Annual Report1963finance5
 
lowe's Annual Report2005
lowe's Annual Report2005lowe's Annual Report2005
lowe's Annual Report2005finance5
 
lowe's Annual Report1962
lowe's Annual Report1962lowe's Annual Report1962
lowe's Annual Report1962finance5
 
lowe's Annual Report2007
lowe's Annual Report2007lowe's Annual Report2007
lowe's Annual Report2007finance5
 
lowe's Annual Report1965
lowe's Annual Report1965lowe's Annual Report1965
lowe's Annual Report1965finance5
 
lowe's Annual Report2000
lowe's Annual Report2000lowe's Annual Report2000
lowe's Annual Report2000finance5
 
home depot Annual Report 1986
home depot Annual Report 1986home depot Annual Report 1986
home depot Annual Report 1986finance2
 
lowe's Annual Report1999
lowe's Annual Report1999lowe's Annual Report1999
lowe's Annual Report1999finance5
 

Destaque (20)

lowe's Annual Report1972
lowe's Annual Report1972lowe's Annual Report1972
lowe's Annual Report1972
 
home depot Annual Report 1987
home depot Annual Report 1987home depot Annual Report 1987
home depot Annual Report 1987
 
kohl's annual reports 2003
kohl's annual reports 2003kohl's annual reports 2003
kohl's annual reports 2003
 
lowe's Annual Report1991
lowe's Annual Report1991lowe's Annual Report1991
lowe's Annual Report1991
 
lowe's Annual Report1996
lowe's Annual Report1996lowe's Annual Report1996
lowe's Annual Report1996
 
home depot Annual Report 1983
home depot Annual Report 1983home depot Annual Report 1983
home depot Annual Report 1983
 
lowe's Annual Report1976
lowe's Annual Report1976lowe's Annual Report1976
lowe's Annual Report1976
 
lowe's Annual Report1966
lowe's Annual Report1966lowe's Annual Report1966
lowe's Annual Report1966
 
lowe's Annual Report1974
lowe's Annual Report1974lowe's Annual Report1974
lowe's Annual Report1974
 
lowe's Annual Report1971
lowe's Annual Report1971lowe's Annual Report1971
lowe's Annual Report1971
 
lowe's Annual Report1997
lowe's Annual Report1997lowe's Annual Report1997
lowe's Annual Report1997
 
lowe's Annual Report1992
lowe's Annual Report1992lowe's Annual Report1992
lowe's Annual Report1992
 
lowe's Annual Report1963
lowe's Annual Report1963lowe's Annual Report1963
lowe's Annual Report1963
 
lowe's Annual Report2005
lowe's Annual Report2005lowe's Annual Report2005
lowe's Annual Report2005
 
lowe's Annual Report1962
lowe's Annual Report1962lowe's Annual Report1962
lowe's Annual Report1962
 
lowe's Annual Report2007
lowe's Annual Report2007lowe's Annual Report2007
lowe's Annual Report2007
 
lowe's Annual Report1965
lowe's Annual Report1965lowe's Annual Report1965
lowe's Annual Report1965
 
lowe's Annual Report2000
lowe's Annual Report2000lowe's Annual Report2000
lowe's Annual Report2000
 
home depot Annual Report 1986
home depot Annual Report 1986home depot Annual Report 1986
home depot Annual Report 1986
 
lowe's Annual Report1999
lowe's Annual Report1999lowe's Annual Report1999
lowe's Annual Report1999
 

Semelhante a lowe's Annual Report2003

fiserv annual reports 2003
fiserv annual reports 2003fiserv annual reports 2003
fiserv annual reports 2003finance47
 
timken AR2004
timken AR2004timken AR2004
timken AR2004finance39
 
ecolab Ecolab_2004_Final
ecolab  Ecolab_2004_Finalecolab  Ecolab_2004_Final
ecolab Ecolab_2004_Finalfinance37
 
ecolab Ecolab_BusDesc_FinHigh
ecolab  Ecolab_BusDesc_FinHighecolab  Ecolab_BusDesc_FinHigh
ecolab Ecolab_BusDesc_FinHighfinance37
 
Yahoo Q2 2009 Earnings
Yahoo Q2 2009 EarningsYahoo Q2 2009 Earnings
Yahoo Q2 2009 EarningsDaniel Lu
 
Yhoo Q209 Earnings Presentation Final
Yhoo Q209 Earnings Presentation FinalYhoo Q209 Earnings Presentation Final
Yhoo Q209 Earnings Presentation Finalguest25211b
 
ecolab 2003AnnualReport
ecolab  2003AnnualReportecolab  2003AnnualReport
ecolab 2003AnnualReportfinance37
 
pantry 2001AR
pantry  2001ARpantry  2001AR
pantry 2001ARfinance34
 
pantry 2001AR
pantry  2001ARpantry  2001AR
pantry 2001ARfinance34
 
timken 2001ar
timken 2001artimken 2001ar
timken 2001arfinance39
 
2001%20Annual%20Report
2001%20Annual%20Report2001%20Annual%20Report
2001%20Annual%20Reportfinance45
 
ecolab 2_DscrptBusnFinHighlight
ecolab  2_DscrptBusnFinHighlightecolab  2_DscrptBusnFinHighlight
ecolab 2_DscrptBusnFinHighlightfinance37
 
an1999 auto nation
an1999 auto nationan1999 auto nation
an1999 auto nationfinance14
 
ecolab 2003BusinessDescription
ecolab  2003BusinessDescriptionecolab  2003BusinessDescription
ecolab 2003BusinessDescriptionfinance37
 
hollycorp.annualreport.2001
hollycorp.annualreport.2001hollycorp.annualreport.2001
hollycorp.annualreport.2001finance49
 
ncr annual reports 2000
ncr annual reports 2000ncr annual reports 2000
ncr annual reports 2000finance46
 

Semelhante a lowe's Annual Report2003 (20)

fiserv annual reports 2003
fiserv annual reports 2003fiserv annual reports 2003
fiserv annual reports 2003
 
timken AR2004
timken AR2004timken AR2004
timken AR2004
 
AR2004
AR2004AR2004
AR2004
 
ecolab Ecolab_2004_Final
ecolab  Ecolab_2004_Finalecolab  Ecolab_2004_Final
ecolab Ecolab_2004_Final
 
ecolab Ecolab_BusDesc_FinHigh
ecolab  Ecolab_BusDesc_FinHighecolab  Ecolab_BusDesc_FinHigh
ecolab Ecolab_BusDesc_FinHigh
 
dover _ar02
dover _ar02dover _ar02
dover _ar02
 
Yahoo Q2 2009 Earnings
Yahoo Q2 2009 EarningsYahoo Q2 2009 Earnings
Yahoo Q2 2009 Earnings
 
Yhoo Q209 Earnings Presentation Final
Yhoo Q209 Earnings Presentation FinalYhoo Q209 Earnings Presentation Final
Yhoo Q209 Earnings Presentation Final
 
ecolab 2003AnnualReport
ecolab  2003AnnualReportecolab  2003AnnualReport
ecolab 2003AnnualReport
 
pantry 2001AR
pantry  2001ARpantry  2001AR
pantry 2001AR
 
pantry 2001AR
pantry  2001ARpantry  2001AR
pantry 2001AR
 
2001ar
2001ar2001ar
2001ar
 
timken 2001ar
timken 2001artimken 2001ar
timken 2001ar
 
2001%20Annual%20Report
2001%20Annual%20Report2001%20Annual%20Report
2001%20Annual%20Report
 
ecolab 2_DscrptBusnFinHighlight
ecolab  2_DscrptBusnFinHighlightecolab  2_DscrptBusnFinHighlight
ecolab 2_DscrptBusnFinHighlight
 
an1999 auto nation
an1999 auto nationan1999 auto nation
an1999 auto nation
 
ecolab 2003BusinessDescription
ecolab  2003BusinessDescriptionecolab  2003BusinessDescription
ecolab 2003BusinessDescription
 
hollycorp.annualreport.2001
hollycorp.annualreport.2001hollycorp.annualreport.2001
hollycorp.annualreport.2001
 
ncr annual reports 2000
ncr annual reports 2000ncr annual reports 2000
ncr annual reports 2000
 
GPI2004AR
GPI2004ARGPI2004AR
GPI2004AR
 

Mais de finance5

• 2002 General and Financial Information (Proxy Appendix)
• 2002 General and Financial Information (Proxy Appendix)• 2002 General and Financial Information (Proxy Appendix)
• 2002 General and Financial Information (Proxy Appendix)finance5
 
2002 Caterpillar Inc. Annual Report
2002 Caterpillar Inc. Annual Report2002 Caterpillar Inc. Annual Report
2002 Caterpillar Inc. Annual Reportfinance5
 
2003 General and Financial Information (Proxy Appendix)
2003 General and Financial Information (Proxy Appendix)2003 General and Financial Information (Proxy Appendix)
2003 General and Financial Information (Proxy Appendix)finance5
 
2003 Caterpillar Inc. Annual Report
2003 Caterpillar Inc. Annual Report2003 Caterpillar Inc. Annual Report
2003 Caterpillar Inc. Annual Reportfinance5
 
• 2004 General and Financial Information (Proxy Appendix)
 • 2004 General and Financial Information (Proxy Appendix) • 2004 General and Financial Information (Proxy Appendix)
• 2004 General and Financial Information (Proxy Appendix)finance5
 
» • 2004 Caterpillar Inc. Annual Report
» • 2004 Caterpillar Inc. Annual Report» • 2004 Caterpillar Inc. Annual Report
» • 2004 Caterpillar Inc. Annual Reportfinance5
 
2005 General and Financial Information (Proxy Appendix)
2005 General and Financial Information (Proxy Appendix)2005 General and Financial Information (Proxy Appendix)
2005 General and Financial Information (Proxy Appendix)finance5
 
• 2005 Caterpillar Inc. Annual Report
 • 2005 Caterpillar Inc. Annual Report • 2005 Caterpillar Inc. Annual Report
• 2005 Caterpillar Inc. Annual Reportfinance5
 
• 2006 General and Financial Information (Proxy Appendix)
 • 2006 General and Financial Information (Proxy Appendix) • 2006 General and Financial Information (Proxy Appendix)
• 2006 General and Financial Information (Proxy Appendix)finance5
 
» • 2006 Caterpillar Inc. Annual Report
» • 2006 Caterpillar Inc. Annual Report» • 2006 Caterpillar Inc. Annual Report
» • 2006 Caterpillar Inc. Annual Reportfinance5
 
Company Information
Company InformationCompany Information
Company Informationfinance5
 
• Financials
 • Financials • Financials
• Financialsfinance5
 
At A Glance
At A GlanceAt A Glance
At A Glancefinance5
 
Chairman's Letter
Chairman's LetterChairman's Letter
Chairman's Letterfinance5
 
Success Stories
Success StoriesSuccess Stories
Success Storiesfinance5
 
• Caterpillar Production System
 • Caterpillar Production System • Caterpillar Production System
• Caterpillar Production Systemfinance5
 
Caterpillar and Oil & Gas
Caterpillar and Oil & GasCaterpillar and Oil & Gas
Caterpillar and Oil & Gasfinance5
 
Taking Caterpillar to Market
Taking Caterpillar to MarketTaking Caterpillar to Market
Taking Caterpillar to Marketfinance5
 
caterpillar • 2007 Annual Report
caterpillar  • 2007 Annual Report caterpillar  • 2007 Annual Report
caterpillar • 2007 Annual Report finance5
 
caterpillar Quarterly Releases » • 1Q07 Cat Financial Results
caterpillar Quarterly Releases » • 1Q07 Cat Financial Resultscaterpillar Quarterly Releases » • 1Q07 Cat Financial Results
caterpillar Quarterly Releases » • 1Q07 Cat Financial Resultsfinance5
 

Mais de finance5 (20)

• 2002 General and Financial Information (Proxy Appendix)
• 2002 General and Financial Information (Proxy Appendix)• 2002 General and Financial Information (Proxy Appendix)
• 2002 General and Financial Information (Proxy Appendix)
 
2002 Caterpillar Inc. Annual Report
2002 Caterpillar Inc. Annual Report2002 Caterpillar Inc. Annual Report
2002 Caterpillar Inc. Annual Report
 
2003 General and Financial Information (Proxy Appendix)
2003 General and Financial Information (Proxy Appendix)2003 General and Financial Information (Proxy Appendix)
2003 General and Financial Information (Proxy Appendix)
 
2003 Caterpillar Inc. Annual Report
2003 Caterpillar Inc. Annual Report2003 Caterpillar Inc. Annual Report
2003 Caterpillar Inc. Annual Report
 
• 2004 General and Financial Information (Proxy Appendix)
 • 2004 General and Financial Information (Proxy Appendix) • 2004 General and Financial Information (Proxy Appendix)
• 2004 General and Financial Information (Proxy Appendix)
 
» • 2004 Caterpillar Inc. Annual Report
» • 2004 Caterpillar Inc. Annual Report» • 2004 Caterpillar Inc. Annual Report
» • 2004 Caterpillar Inc. Annual Report
 
2005 General and Financial Information (Proxy Appendix)
2005 General and Financial Information (Proxy Appendix)2005 General and Financial Information (Proxy Appendix)
2005 General and Financial Information (Proxy Appendix)
 
• 2005 Caterpillar Inc. Annual Report
 • 2005 Caterpillar Inc. Annual Report • 2005 Caterpillar Inc. Annual Report
• 2005 Caterpillar Inc. Annual Report
 
• 2006 General and Financial Information (Proxy Appendix)
 • 2006 General and Financial Information (Proxy Appendix) • 2006 General and Financial Information (Proxy Appendix)
• 2006 General and Financial Information (Proxy Appendix)
 
» • 2006 Caterpillar Inc. Annual Report
» • 2006 Caterpillar Inc. Annual Report» • 2006 Caterpillar Inc. Annual Report
» • 2006 Caterpillar Inc. Annual Report
 
Company Information
Company InformationCompany Information
Company Information
 
• Financials
 • Financials • Financials
• Financials
 
At A Glance
At A GlanceAt A Glance
At A Glance
 
Chairman's Letter
Chairman's LetterChairman's Letter
Chairman's Letter
 
Success Stories
Success StoriesSuccess Stories
Success Stories
 
• Caterpillar Production System
 • Caterpillar Production System • Caterpillar Production System
• Caterpillar Production System
 
Caterpillar and Oil & Gas
Caterpillar and Oil & GasCaterpillar and Oil & Gas
Caterpillar and Oil & Gas
 
Taking Caterpillar to Market
Taking Caterpillar to MarketTaking Caterpillar to Market
Taking Caterpillar to Market
 
caterpillar • 2007 Annual Report
caterpillar  • 2007 Annual Report caterpillar  • 2007 Annual Report
caterpillar • 2007 Annual Report
 
caterpillar Quarterly Releases » • 1Q07 Cat Financial Results
caterpillar Quarterly Releases » • 1Q07 Cat Financial Resultscaterpillar Quarterly Releases » • 1Q07 Cat Financial Results
caterpillar Quarterly Releases » • 1Q07 Cat Financial Results
 

Último

High Class Call Girls Nagpur Grishma Call 7001035870 Meet With Nagpur Escorts
High Class Call Girls Nagpur Grishma Call 7001035870 Meet With Nagpur EscortsHigh Class Call Girls Nagpur Grishma Call 7001035870 Meet With Nagpur Escorts
High Class Call Girls Nagpur Grishma Call 7001035870 Meet With Nagpur Escortsranjana rawat
 
The Economic History of the U.S. Lecture 18.pdf
The Economic History of the U.S. Lecture 18.pdfThe Economic History of the U.S. Lecture 18.pdf
The Economic History of the U.S. Lecture 18.pdfGale Pooley
 
Independent Call Girl Number in Kurla Mumbai📲 Pooja Nehwal 9892124323 💞 Full ...
Independent Call Girl Number in Kurla Mumbai📲 Pooja Nehwal 9892124323 💞 Full ...Independent Call Girl Number in Kurla Mumbai📲 Pooja Nehwal 9892124323 💞 Full ...
Independent Call Girl Number in Kurla Mumbai📲 Pooja Nehwal 9892124323 💞 Full ...Pooja Nehwal
 
(ANIKA) Budhwar Peth Call Girls Just Call 7001035870 [ Cash on Delivery ] Pun...
(ANIKA) Budhwar Peth Call Girls Just Call 7001035870 [ Cash on Delivery ] Pun...(ANIKA) Budhwar Peth Call Girls Just Call 7001035870 [ Cash on Delivery ] Pun...
(ANIKA) Budhwar Peth Call Girls Just Call 7001035870 [ Cash on Delivery ] Pun...ranjana rawat
 
Dividend Policy and Dividend Decision Theories.pptx
Dividend Policy and Dividend Decision Theories.pptxDividend Policy and Dividend Decision Theories.pptx
Dividend Policy and Dividend Decision Theories.pptxanshikagoel52
 
Instant Issue Debit Cards - High School Spirit
Instant Issue Debit Cards - High School SpiritInstant Issue Debit Cards - High School Spirit
Instant Issue Debit Cards - High School Spiritegoetzinger
 
Booking open Available Pune Call Girls Wadgaon Sheri 6297143586 Call Hot Ind...
Booking open Available Pune Call Girls Wadgaon Sheri  6297143586 Call Hot Ind...Booking open Available Pune Call Girls Wadgaon Sheri  6297143586 Call Hot Ind...
Booking open Available Pune Call Girls Wadgaon Sheri 6297143586 Call Hot Ind...Call Girls in Nagpur High Profile
 
Log your LOA pain with Pension Lab's brilliant campaign
Log your LOA pain with Pension Lab's brilliant campaignLog your LOA pain with Pension Lab's brilliant campaign
Log your LOA pain with Pension Lab's brilliant campaignHenry Tapper
 
Solution Manual for Financial Accounting, 11th Edition by Robert Libby, Patri...
Solution Manual for Financial Accounting, 11th Edition by Robert Libby, Patri...Solution Manual for Financial Accounting, 11th Edition by Robert Libby, Patri...
Solution Manual for Financial Accounting, 11th Edition by Robert Libby, Patri...ssifa0344
 
VIP Call Girls Service Dilsukhnagar Hyderabad Call +91-8250192130
VIP Call Girls Service Dilsukhnagar Hyderabad Call +91-8250192130VIP Call Girls Service Dilsukhnagar Hyderabad Call +91-8250192130
VIP Call Girls Service Dilsukhnagar Hyderabad Call +91-8250192130Suhani Kapoor
 
The Economic History of the U.S. Lecture 19.pdf
The Economic History of the U.S. Lecture 19.pdfThe Economic History of the U.S. Lecture 19.pdf
The Economic History of the U.S. Lecture 19.pdfGale Pooley
 
Top Rated Pune Call Girls Viman Nagar ⟟ 6297143586 ⟟ Call Me For Genuine Sex...
Top Rated  Pune Call Girls Viman Nagar ⟟ 6297143586 ⟟ Call Me For Genuine Sex...Top Rated  Pune Call Girls Viman Nagar ⟟ 6297143586 ⟟ Call Me For Genuine Sex...
Top Rated Pune Call Girls Viman Nagar ⟟ 6297143586 ⟟ Call Me For Genuine Sex...Call Girls in Nagpur High Profile
 
VVIP Pune Call Girls Katraj (7001035870) Pune Escorts Nearby with Complete Sa...
VVIP Pune Call Girls Katraj (7001035870) Pune Escorts Nearby with Complete Sa...VVIP Pune Call Girls Katraj (7001035870) Pune Escorts Nearby with Complete Sa...
VVIP Pune Call Girls Katraj (7001035870) Pune Escorts Nearby with Complete Sa...Call Girls in Nagpur High Profile
 
Dharavi Russian callg Girls, { 09892124323 } || Call Girl In Mumbai ...
Dharavi Russian callg Girls, { 09892124323 } || Call Girl In Mumbai ...Dharavi Russian callg Girls, { 09892124323 } || Call Girl In Mumbai ...
Dharavi Russian callg Girls, { 09892124323 } || Call Girl In Mumbai ...Pooja Nehwal
 
The Economic History of the U.S. Lecture 20.pdf
The Economic History of the U.S. Lecture 20.pdfThe Economic History of the U.S. Lecture 20.pdf
The Economic History of the U.S. Lecture 20.pdfGale Pooley
 
Booking open Available Pune Call Girls Talegaon Dabhade 6297143586 Call Hot ...
Booking open Available Pune Call Girls Talegaon Dabhade  6297143586 Call Hot ...Booking open Available Pune Call Girls Talegaon Dabhade  6297143586 Call Hot ...
Booking open Available Pune Call Girls Talegaon Dabhade 6297143586 Call Hot ...Call Girls in Nagpur High Profile
 
02_Fabio Colombo_Accenture_MeetupDora&Cybersecurity.pptx
02_Fabio Colombo_Accenture_MeetupDora&Cybersecurity.pptx02_Fabio Colombo_Accenture_MeetupDora&Cybersecurity.pptx
02_Fabio Colombo_Accenture_MeetupDora&Cybersecurity.pptxFinTech Belgium
 
Booking open Available Pune Call Girls Shivane 6297143586 Call Hot Indian Gi...
Booking open Available Pune Call Girls Shivane  6297143586 Call Hot Indian Gi...Booking open Available Pune Call Girls Shivane  6297143586 Call Hot Indian Gi...
Booking open Available Pune Call Girls Shivane 6297143586 Call Hot Indian Gi...Call Girls in Nagpur High Profile
 
(DIYA) Bhumkar Chowk Call Girls Just Call 7001035870 [ Cash on Delivery ] Pun...
(DIYA) Bhumkar Chowk Call Girls Just Call 7001035870 [ Cash on Delivery ] Pun...(DIYA) Bhumkar Chowk Call Girls Just Call 7001035870 [ Cash on Delivery ] Pun...
(DIYA) Bhumkar Chowk Call Girls Just Call 7001035870 [ Cash on Delivery ] Pun...ranjana rawat
 

Último (20)

High Class Call Girls Nagpur Grishma Call 7001035870 Meet With Nagpur Escorts
High Class Call Girls Nagpur Grishma Call 7001035870 Meet With Nagpur EscortsHigh Class Call Girls Nagpur Grishma Call 7001035870 Meet With Nagpur Escorts
High Class Call Girls Nagpur Grishma Call 7001035870 Meet With Nagpur Escorts
 
The Economic History of the U.S. Lecture 18.pdf
The Economic History of the U.S. Lecture 18.pdfThe Economic History of the U.S. Lecture 18.pdf
The Economic History of the U.S. Lecture 18.pdf
 
Independent Call Girl Number in Kurla Mumbai📲 Pooja Nehwal 9892124323 💞 Full ...
Independent Call Girl Number in Kurla Mumbai📲 Pooja Nehwal 9892124323 💞 Full ...Independent Call Girl Number in Kurla Mumbai📲 Pooja Nehwal 9892124323 💞 Full ...
Independent Call Girl Number in Kurla Mumbai📲 Pooja Nehwal 9892124323 💞 Full ...
 
(ANIKA) Budhwar Peth Call Girls Just Call 7001035870 [ Cash on Delivery ] Pun...
(ANIKA) Budhwar Peth Call Girls Just Call 7001035870 [ Cash on Delivery ] Pun...(ANIKA) Budhwar Peth Call Girls Just Call 7001035870 [ Cash on Delivery ] Pun...
(ANIKA) Budhwar Peth Call Girls Just Call 7001035870 [ Cash on Delivery ] Pun...
 
Dividend Policy and Dividend Decision Theories.pptx
Dividend Policy and Dividend Decision Theories.pptxDividend Policy and Dividend Decision Theories.pptx
Dividend Policy and Dividend Decision Theories.pptx
 
Instant Issue Debit Cards - High School Spirit
Instant Issue Debit Cards - High School SpiritInstant Issue Debit Cards - High School Spirit
Instant Issue Debit Cards - High School Spirit
 
Booking open Available Pune Call Girls Wadgaon Sheri 6297143586 Call Hot Ind...
Booking open Available Pune Call Girls Wadgaon Sheri  6297143586 Call Hot Ind...Booking open Available Pune Call Girls Wadgaon Sheri  6297143586 Call Hot Ind...
Booking open Available Pune Call Girls Wadgaon Sheri 6297143586 Call Hot Ind...
 
Veritas Interim Report 1 January–31 March 2024
Veritas Interim Report 1 January–31 March 2024Veritas Interim Report 1 January–31 March 2024
Veritas Interim Report 1 January–31 March 2024
 
Log your LOA pain with Pension Lab's brilliant campaign
Log your LOA pain with Pension Lab's brilliant campaignLog your LOA pain with Pension Lab's brilliant campaign
Log your LOA pain with Pension Lab's brilliant campaign
 
Solution Manual for Financial Accounting, 11th Edition by Robert Libby, Patri...
Solution Manual for Financial Accounting, 11th Edition by Robert Libby, Patri...Solution Manual for Financial Accounting, 11th Edition by Robert Libby, Patri...
Solution Manual for Financial Accounting, 11th Edition by Robert Libby, Patri...
 
VIP Call Girls Service Dilsukhnagar Hyderabad Call +91-8250192130
VIP Call Girls Service Dilsukhnagar Hyderabad Call +91-8250192130VIP Call Girls Service Dilsukhnagar Hyderabad Call +91-8250192130
VIP Call Girls Service Dilsukhnagar Hyderabad Call +91-8250192130
 
The Economic History of the U.S. Lecture 19.pdf
The Economic History of the U.S. Lecture 19.pdfThe Economic History of the U.S. Lecture 19.pdf
The Economic History of the U.S. Lecture 19.pdf
 
Top Rated Pune Call Girls Viman Nagar ⟟ 6297143586 ⟟ Call Me For Genuine Sex...
Top Rated  Pune Call Girls Viman Nagar ⟟ 6297143586 ⟟ Call Me For Genuine Sex...Top Rated  Pune Call Girls Viman Nagar ⟟ 6297143586 ⟟ Call Me For Genuine Sex...
Top Rated Pune Call Girls Viman Nagar ⟟ 6297143586 ⟟ Call Me For Genuine Sex...
 
VVIP Pune Call Girls Katraj (7001035870) Pune Escorts Nearby with Complete Sa...
VVIP Pune Call Girls Katraj (7001035870) Pune Escorts Nearby with Complete Sa...VVIP Pune Call Girls Katraj (7001035870) Pune Escorts Nearby with Complete Sa...
VVIP Pune Call Girls Katraj (7001035870) Pune Escorts Nearby with Complete Sa...
 
Dharavi Russian callg Girls, { 09892124323 } || Call Girl In Mumbai ...
Dharavi Russian callg Girls, { 09892124323 } || Call Girl In Mumbai ...Dharavi Russian callg Girls, { 09892124323 } || Call Girl In Mumbai ...
Dharavi Russian callg Girls, { 09892124323 } || Call Girl In Mumbai ...
 
The Economic History of the U.S. Lecture 20.pdf
The Economic History of the U.S. Lecture 20.pdfThe Economic History of the U.S. Lecture 20.pdf
The Economic History of the U.S. Lecture 20.pdf
 
Booking open Available Pune Call Girls Talegaon Dabhade 6297143586 Call Hot ...
Booking open Available Pune Call Girls Talegaon Dabhade  6297143586 Call Hot ...Booking open Available Pune Call Girls Talegaon Dabhade  6297143586 Call Hot ...
Booking open Available Pune Call Girls Talegaon Dabhade 6297143586 Call Hot ...
 
02_Fabio Colombo_Accenture_MeetupDora&Cybersecurity.pptx
02_Fabio Colombo_Accenture_MeetupDora&Cybersecurity.pptx02_Fabio Colombo_Accenture_MeetupDora&Cybersecurity.pptx
02_Fabio Colombo_Accenture_MeetupDora&Cybersecurity.pptx
 
Booking open Available Pune Call Girls Shivane 6297143586 Call Hot Indian Gi...
Booking open Available Pune Call Girls Shivane  6297143586 Call Hot Indian Gi...Booking open Available Pune Call Girls Shivane  6297143586 Call Hot Indian Gi...
Booking open Available Pune Call Girls Shivane 6297143586 Call Hot Indian Gi...
 
(DIYA) Bhumkar Chowk Call Girls Just Call 7001035870 [ Cash on Delivery ] Pun...
(DIYA) Bhumkar Chowk Call Girls Just Call 7001035870 [ Cash on Delivery ] Pun...(DIYA) Bhumkar Chowk Call Girls Just Call 7001035870 [ Cash on Delivery ] Pun...
(DIYA) Bhumkar Chowk Call Girls Just Call 7001035870 [ Cash on Delivery ] Pun...
 

lowe's Annual Report2003

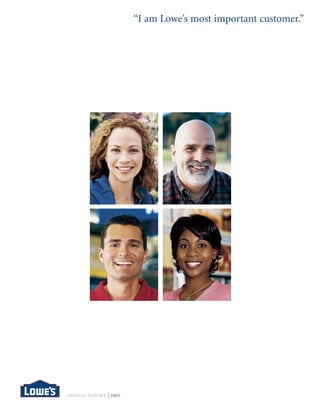
  • 1. “I am Lowe’s most important customer.” ANNUAL REPORT 2003
  • 3. In 2003, Lowe’s served 520,605,244 customers. The customers who came through our doors expected our shelves to be stocked with quality products at everyday low prices as well as complete home improvement solutions to enable them to add the personal touches to turn their houses into homes. They return time and time again knowing that Lowe’s employees are striving to exceed their expectations by treating each customer as Lowe’s most important customer. Investing in what matters. To our customers, home ownership is about more than just a roof over your head. It is the American dream, an expression of their individuality and an investment that is the centerpiece of their lives. We are pleased our customers have chosen Lowe’s to help enhance their home and improve their investment. We stand ready to serve them with an unwavering commitment to offer the best brands at everyday low prices with exceptional service that shows our customers they are Lowe’s most important customer. Our continued expansion in metropolitan as well as small-market areas has increased our national presence and market penetration. But our growth goes beyond geographic expansion of stores. With exciting new products and improved installation and special order capabilities, our customers are finding more than just home improvement products in our stores. They are finding well-trained, knowledgeable employees, backed by state-of-the-art technology and an experienced management team who understands that sustainable success is dependent on serving and satisfying nearly 521 million customers … one at a time. Company Profile // Lowe’s Companies, Inc. is a $30.8 billion retailer of a complete line of home improvement products, equipment and services. The company, through its subsidiaries, serves more than 10 million do-it-yourself and commercial business customers each week through more than 950 stores in 45 states. Named FORTUNE® magazine’s Most Admired Specialty Retailer for the second year in a row, Lowe’s is the world’s second largest home improvement retailer and the 11th largest retailer in the U.S. // Lowe’s expansion continues, opening a new store on average every three days. The company’s expansion plans include two prototypes, a 116,000-square-foot (116K) store for large markets and a 94,000-square-foot (94K) store used primarily to serve smaller markets. Both prototypes include a lawn and garden center averaging an additional 31,000 square feet for 116K stores and an additional 26,000 square feet for 94K stores. At the beginning of 2004, square footage totaled approximately 109 million square feet. // In 2003, the company opened 130 new stores, the majority of which were in metropolitan markets. In 2004, the company plans to open 140 new stores and continue its emphasis on cities with populations greater than 500,000, such as New York, Tampa, and Los Angeles. Lowe’s is an active supporter of the communities it serves. Through the Lowe’s Heroes volunteer program and the Home Safety Council, the company provides help to civic groups with public safety projects and shares important home safety and fire prevention information with neighborhoods across the country. // Headquartered in Mooresville, N.C., the 58-year-old company employs 147,000 people. Approximately 6 percent of Lowe’s stock is owned by employees through the Lowe’s 401(k) plan. Lowe’s is committed to understanding and reflecting its communities’ diverse cultures in staffing, business partnerships and the products it sells. Lowe’s is committed to making diversity and inclusion a natural part of the way it does business. // Lowe’s has been a publicly held company since October 10, 1961. The stock is listed on the New York Stock Exchange with shares trading under the symbol LOW. For more information, visit www.Lowes.com. //
  • 4. Financial Highlights* i n m i l l i o n s , e xc e p t p e r s h a r e d ata Increase over ’02 Fiscal ’03 Fiscal ’02 Net Sales 18.1% $ 30,838 $ 26,112 Gross Margin 71bps** 31.15% 30.44% Pre-tax Earnings 28.2% $ 2,998 $ 2,339 Earnings from Continuing Operations 27.6% $ 1,862 $ 1,459 Earnings from Discontinued Operations, Net of Tax $ 15 $ 12 Net Earnings 27.6% $ 1,877 $ 1,471 Earnings Per Share Basic (Continuing Operations) $ 2.37 $ 1.87 (Discontinued Operations) $ 0.02 $ 0.02 Basic Earnings Per Share 26.5% $ 2.39 $ 1.89 Diluted (Continuing Operations) $ 2.32 $ 1.83 (Discontinued Operations) $ 0.02 $ 0.02 Diluted Earnings Per Share 26.5% $ 2.34 $ 1.85 Cash Dividends Per Share 29.4% $ 0.110 $ 0.085 * Amounts herein have been adjusted to reflect the 26 Contractor Yard locations sold in 2003 as a discontinued operation. ** Basis points Sales Growth Earnings Growth in billions of dollars in millions of dollars 30 1,800 1,600 25 1,400 20 1,200 1,000 15 800 10 600 400 5 200 0 0 94 95 96 97 98 99 00 01 02 03 94 95 96 97 98 99 00 01 02 03 02 LOWE’S COMPANIES, INC.
  • 5. Letters to Our Shareholders Robert L. Tillman, Chairman & Chief Executive Officer and Robert A. Niblock, President To our shareholders. Back-to-back success is an achievement recognized in both business and sports as representative of true excellence. A strong year only raises the hurdle for the next, and Lowe’s has a proven track record of consistently strong performance as we’ve transformed the company into a leader in the home improvement industry. Rising to the challenge created by record results in 2002, our success in 2003 is a testament that Lowe’s is providing the products and services that allow Americans to invest in what matters to them. 2003 was a great year for Lowe’s. Under the strong leadership of our experienced management team, we delivered above-plan sales and earnings despite the weather-affected slow start experienced in the first quarter. After the slow start to spring, we knew we would be facing a compressed selling season, and our stores would need to be ready. We invested in the business and had the merchandise and staffing in place to serve our customers as they initiated home improvement projects when weather improved. That investment was rewarded with strong financial results. Sales from continuing operations for the year totaled $30.8 billion dollars, up 18.1 percent over fiscal 2002, and comparable store sales increased 6.7 percent. We experienced balanced sales across all of our operating regions and product categories. In fact, all 18 regions and all 18 product categories delivered positive comparable store sales for the year, further demonstrating the deep and far-reaching connection we have made with our customers. Gross margin continues to expand, driven not by higher prices, but rather by our efforts to minimize acquisition and supply chain costs. Our commitment to everyday low prices remains strong, guaranteeing our customers that they will find the best prices at Lowe’s every day. Growth in gross margin, combined with effective expense control, led to an industry leading, and Lowe’s record, 10.7 percent operating margin for the year. Net earnings grew by 27.6 percent in 2003 and diluted earnings per share increased to $2.34, up 26.5 percent over 2002. We reached many significant milestones in 2003. Lowe’s crossed $30 billion in sales, shareholders’ equity exceeded $10 billion, and we took the final step in our transformation to a national, big-box home improvement retailer when we sold the 26 commodity-focused Contractor Yard locations. This transaction allows us to hone our focus on our retail and targeted commercial customers. In fiscal 2003, we opened 130 stores, including five relocations, bringing our store count to 952. We entered Chicago with three stores and added additional locations in strategic markets like Los Angeles, New York, Detroit and Memphis. We also entered many smaller markets across America, making Lowe’s more and more convenient for home improvement consumers around the country. A key component of our success in America’s smaller markets is our new 94,000-square-foot prototype store. Designed to efficiently serve single-store markets across the country, we opened the first prototype in March and ended the year with 32 of our 94,000-square-foot stores. We designed this prototype to have the same look and feel as our larger stores, and our customer feedback confirms that we met our objective. We continue to be pleased with the results these stores are delivering, and the communities we’re entering are greeting us with excitement. Our back-to-back success provides even more confidence in our future. The home improvement industry is strong and growing. In fact, the Home Improvement Research Institute estimates nearly five percent growth in home improvement spending each year over the next several years. That growth is buttressed by the strongest housing market on record. In 2003, housing turnover reached record levels, and that strength is expected to continue into 2004 and beyond. Increases in disposable income, improving equity markets, and low mortgage rates that fuel a strong refinancing market have propelled home improvement spending and helped make affordable housing available to those 2003 ANNUAL REPORT 03
  • 6. wanting to participate in the American dream. This strength has led to record levels of home ownership in the U.S., which stood at 68.6 percent at the end of 2003. These macroeconomic forces were not the only driver of our past success, but they provide confidence that the future is bright for Lowe’s. Our strength and the strength of the home improvement industry is driven by several factors — demographic, social and economic. First, evolving demographic trends have been, and will continue to be, a positive force for Lowe’s and the home improvement industry. The large and influential Baby Boomer population is entering the peak second-home buying age and is driving a robust second-home market. Driven by this phenomenon, some estimates suggest that 150,000 second homes will be built each year for the rest of this decade. In addition, Boomers are more time-strapped than ever and are looking for solutions that make their lives easier. One-stop-shopping convenience and an ever-expanding array of installation services makes Lowe’s a destination to fulfill their needs. Generation Xers are in the family formation years and are looking for ways to improve their home’s function, safety and appeal. This generation values information that allows it to initiate projects. Our informative signage and knowledgeable employees provide just the resources these customers demand. And finally, Echo Boomers, also known as Gen Y, are focused on customization, frequently changing everything from paint to flooring to faucets to fulfill their desire for distinctiveness. This generation is coming of age and is actively influencing many purchasing decisions today. With over 40,000 products in stock, and hundreds of thousands more available by special order, these customers can find the products they’re looking for at Lowe’s. The second force driving home improvement is diversity. Home ownership among minorities is growing rapidly in the U.S., driven by an immigrant population focused on the American dream of owning a home. Harvard’s Joint Center for Housing Studies reports that in 2001, minorities accounted for 32 percent of first-time homebuyers, and from 1995 to 2001, they represented 60 percent of the increase in households. Bilingual employees, targeted advertising and unique products to meet varying cultural styles are just a few of the things we’re doing at Lowe’s to meet the needs of our increasingly diverse customers. Third, Americans are more focused than ever on the comfort, security and warmth that home has to offer. As Americans deal with a tumultuous geopolitical environment and the stress of everyday life, keeping in touch with the people who matter remains a top priority, and they’re doing it at home. Home ownership was a cornerstone of the American dream long before interest rates began their latest decline in 2001, and we believe a focus on the home and home improvement will remain part of the American dream even as interest rates rise. Finally, a growing trend in home improvement is a phenomenon known as “serial remodeling.” Inspired by innovation and energy efficiency, home improvement is being driven less by need and more by a sense of style and a desire to trade-up. Many customers are repainting their rooms with the most fashionable new color or replacing a working washer and dryer with new, more efficient appliances that clean better while using less water and energy. Innovation is the key, and we encourage our vendors to ensure they are providing inspirational products for our customers. This trend is in lockstep with our up-the-continuum merchandising strategy that ensures our customers will find quality and innovation in the products we offer at everyday low prices. We’ll capitalize on these trends by adding stores as well as enhancing existing stores to ensure we’re providing exactly what our customers are looking for. Lowe’s track record for keeping its finger on the pulse of the consumer is strong. In early 2004, Lowe’s was named Most Admired Specialty Retailer by FORTUNE® magazine for a second year in a row. That recognition is representative of the service our employees provided our customers and the financial results we delivered. I recently announced my plan to retire at the end of fiscal 2004, and Robert Niblock has been named chairman and chief executive officer- elect. I have full confidence in his ability to build on our success and take Lowe’s to its next level of growth and development. With Lowe’s strategic course firmly in place and a deep and talented management team committed to ensuring Lowe’s future success, I am convinced that now is the ideal time for me to continue the process of handing the reins of the company over to Robert. I look forward to working closely with him this year as we execute a smooth and orderly transition. Under the direction of Robert and Lowe’s seasoned management team, and with a bright outlook for the home improvement industry, I am confident we can look forward to many more years of success. robert l. tillman chairman of the board and chief executive officer April 16, 2004 Mooresville, NC 04 LOWE’S COMPANIES, INC.
  • 7. To our shareholders. As I reflect on my first year as president of Lowe’s, I’m proud of the results we delivered in 2003. Our employees were passionate about taking care of our customers, focused on executing the fundamentals of retailing, and delivered exceptional results that wouldn’t have been possible without the entire team working as one. We’ve described for years the value we see in developing the appropriate infrastructure to manage our growing store base. The value of our structure was highlighted in 2003 as comparable store sales ramped from flat in the first quarter to over 12 percent in the third quarter. Our state-of-the-art logistics and distribution infrastructure allowed us to keep our stores in stock with the right products to satisfy the strong demand we experienced in the second half of the year, while leveraging inventory growth. Our disciplined operating structure allowed us to match payroll hours to sales across the entire chain, with a controlled model that leverages sales and ensures customer service levels remain high. The results we delivered in 2003, including strong sales, great customer service and high in-stock levels, are a testament to the value of that structure and could not have been achieved without the entire Lowe’s team working together. For fiscal 2004, we added two new divisions and three regions to our store operations structure to ensure an effective management system is in place to deliver our customers a consistent Lowe’s experience no matter where they shop. While execution of the basics is fundamental to our success, Installed Sales, Special Order Sales (SOS) and our Commercial Business Customer (CBC) initiatives continue to evolve to better serve our customers. This year, we began rolling out an enhanced installed sales model designed to better communicate and manage our customers’ expectations. At the end of 2003, the new model was in place in 380 stores. We continue to be extremely pleased with the results of this model. Customers, installers and employees tell us the model works, and we are seeing the success in improving customer satisfaction scores. Over 90 percent of the customers experiencing the model say they would use Lowe’s again for a future installed project. We expect to have the new model in all stores by the end of fiscal 2004, allowing us to better serve the growing “do-it-for-me” customer base. Enhancements to our SOS process continue to make selecting, ordering and tracking these sales more convenient and worry-free. In the second half of 2003, we completed the rollout of our SOS Express program for fashion plumbing. The new automated system improves inventory visibility and, utilizing a dedicated distribution facility, provides accurate and timely fulfillment of orders. Additionally, the new system informs the customer about related products needed to complete or complement the project. As with our installed sales model, the best way to measure the success of this new model is with customer satisfaction. We’ve seen sales return rates cut in half — evidence of the efficient new technology. One of the most exciting aspects of SOS Express is that the model can be leveraged into many other categories. We will explore these opportunities in 2004 and beyond, as we provide our customers a more efficient process to fulfill their desire to differentiate their homes. And finally, our CBC business continues to drive strong results, delivering comparable store sales higher than the company average in 2003. Our commitment to commercial customers remains strong, and we’re excited about the growth prospects going forward. Providing great inventory depth and knowledgeable staff is paramount to our success with commercial customers. We’re utilizing our direct marketing capabilities to remind commercial customers we have the products and brands they need, in the quantities they demand, all at everyday low prices. Our merchandising organization continues to partner with well-known national vendors to develop and provide great products for our customers. An excellent example unveiled in 2003 is American Tradition® Signature Colors. An enhancement of our existing American Tradition ® line of paint, Signature Colors adds a premium assortment of thousands of designer colors to our interior paint offering. Shades inspired by Eddie Bauer,® Nickelodeon, Waverly® and other well-known brands give our customers unmatched selection to add their unique style to any room. ™ This is just one of the numerous examples of how our merchants are constantly working with our vendors to differentiate Lowe’s product offering, keep our stores fresh and ensure we’re providing our customers exciting new products that make home improvement easier and more enjoyable. Our 2003 marketing programs were successful in solidifying Lowe’s position as a preeminent national retailer where do-it-yourself and commercial customers alike can find the products and services to turn a house into a home. Our “Improving Home Improvement®” campaign continues to evolve and is hitting home with customers across America. Our marketing message is representative of the consistently inviting and inspirational shopping environment found in each of our stores across the country. Our theme for this year’s National Sales Meeting was Defining Opportunity, and that’s just what we intend to do in 2004. We see oppor- tunities in everything we do, as we strive to better serve our customers and to fulfill Lowe’s vision to be the first choice for home improvement in each and every market we serve. From the initial welcome as a customer walks through our doors, to an enthusiastic salesperson who helps a dream become a reality, we will continually look for opportunities to enhance customer service and make our customers’ lives easier. I am honored by the support and confidence of Bob Tillman, which led to the Board of Directors’ decision to name me chairman and CEO-elect. I am also very fortunate to have in place a seasoned executive team who, in their collective experience, represent the gold standard in the home improvement industry. Together, we look forward to continuing to drive value for our shareholders, customers, employees, suppliers, and the communities we serve. Building on Bob Tillman’s vision, which launched Lowe’s into a new era more than a decade ago, I look forward to the challenges and opportunities ahead of us. I accept this responsibility knowing our company has a clear vision, a sound strategy, high quality leadership and an enabling culture that provides the foundation I’m confident will lead to continued success. robert a. niblo ck president April 16, 2004 Mooresville, NC 2003 ANNUAL REPORT 05
  • 8. “This is my home.” 06 LOWE’S COMPANIES, INC.
  • 9. “It’s the most amazing thing to watch. When customers start describing their home to you, their eyes come to life. You no longer see a man or woman looking for a product, you see a person passionate about making the time they spend at home with family and friends more rewarding.” T E R E S A J O H N S O N | District Manager Investing in the American dream. The house you can see from the street is just the beginning of the place our customers call home. Behind the front door lies a family retreat, a place to entertain friends and a place to teach children to take their first steps. It is most often a family’s largest single investment and, as a result, home improvement decisions are far more than an impulse purchase. Because we understand how much home means to our customers, we are committed to providing what they need to get it right the first time. From the wide variety of products we offer, to the professional services that leverage our customers’ time, we want to ensure Lowe’s is the first choice for their home improvement needs. As Lowe’s continues to expand across the U.S., our stores reflect the markets they serve. From the specialized roofing requirements of our customers in southwestern ranches, to the space-saving home organization needs of our customers in metropolitan brownstones, Lowe’s conducts extensive research into the home improvement needs of each market and continues to work with our customers, vendors and employees to fine-tune our product offering, ensuring that all our customers find just what they need. As an increasingly diverse customer base takes part in the American dream of home ownership, Lowe’s has positioned itself to offer products that allow customers to express their individuality through their homes. From the Jackson & Perkins® roses that adorn front lawns, to the custom decks that provide a backyard retreat, Lowe’s is pleased to offer over 40,000 products in stock and hundreds of thousands more by special order, allowing our customers’ homes to become a personal reflection of who they are — unique, individual and diverse. And with so many choices across the entire price continuum, customers can find just the products they need at everyday low prices. 2003 ANNUAL REPORT 07
  • 10. “This is just the right color.” 08 LOWE’S COMPANIES, INC.
  • 11. “When it comes to their homes, whether they need something as small as a screw for the hinge or the entire front door, our customers do not compromise. They don’t see it as making choices for their homes; they see it as making choices for their families. Every decision is passionate, driven by their own personal style and sense of comfort.” L I S M A N D O L P H Y | Store Manager, Alton, IL Investing in the ideal shopping experience. At Lowe’s, we know Porcelain Red is not the same as Richly Red and there’s more than a shade difference between almost the right color and just the right color. From our thousands of colors of paint to over 250 appliances in-stock, customers can find just what they’re looking for at Lowe’s. And with several showrooms under one roof, it’s easy for our customers to do more than buy products. They can find complete solutions for their home improvement projects. From the commercial business customer supported by a dedicated service desk and employees trained to handle their more complex needs, to the novice do-it-yourselfer beginning her first home improvement project, our goal is to make sure the shopping experience is satisfying for every customer. Wide, bright aisles, well-stocked shelves, simple directional signage, and organized store layouts ensure our customers find a shopping experience unmatched in the industry. With a team of certified specialists available to assist customers with home improvement questions, help from courteous, knowledgeable employees is always close by. In 2003, Lowe’s enhanced its installation services model and improved the experience for those customers with little time or inclination to complete major projects. Customers are guided through the installation process with clearly defined time frames and expectations. As Lowe’s certified installers work to complete the installation, customers receive follow-up phone calls, and after the installation is completed, an on-site job inspection is conducted to ensure the 100 percent satisfaction that customers have come to expect from Lowe’s. Our customers take comfort in knowing that a company with 58 years of experience in home improvement stands behind the job. Customers looking for ways to express their unique tastes through products beyond what we carry on our shelves will be excited by the enhancements to our special order sales (SOS) program. Through technological improvements customers can view available special order products and their features with relative ease. Additionally, the ordering process was upgraded to allow electronic order placement, giving employees and customers the opportunity to monitor an order from the time it is placed until the order is completed and received. The new solution substantially reduced the error rate in millwork special orders and significantly increased average ticket sales in that category. Building on our success with millwork, we rolled out SOS Express in late 2003 for our fashion plumbing category, tying automated SOS systems with enhanced distribution capabilities. Additional opportunities to utilize this technology lie in the months and years ahead as we bring process improvements to additional product categories. As these enhancements to our installed sales model and special order program improve the experience for our customers, we’re confident we will capture a more significant portion of the installation and special order markets, adding value for our shareholders. 2003 ANNUAL REPORT 09
  • 12. “This is the brand I trust.” 10 LOWE’S COMPANIES, INC.
  • 13. “Our customers will tell you, in home improvement, well-known, national brands mean lasting quality and getting it right the first time. To our customers, it’s the difference between one coat of paint and three coats. It’s the difference between a nice lawn and lawn envy.” D E B B I E T E M P L E | Merchandising Director Investing in what customers want. For retail and commercial customers alike, availability of brand-name products at everyday low prices is a big part of the shopping decision. At Lowe’s, we know our success and the success of the products we offer go hand in hand. Strategic alliances allow us to enhance our offerings with new, exclusive products. For example, our relationship with Pella®, a millwork manufacturer known for high standards and quality products, began with a program focused on wooden doors and windows. The relationship expanded, capitalizing on the increasingly growing vinyl window market by creating Thermastar, a complete line of vinyl windows of unsurpassed quality. Today, we’re moving rapidly to convert every Lowe’s ® store into a Pella Design Center store, highlighting the extended line of Pella-branded products that are suited for each particular market we serve. A significant partnership for Lowe’s and Pella … developed from a window of opportunity. As Lowe’s continues to build its brand through alliances with preeminent national brands, we are able to increase convenience for our customers by offering complete home improvement solutions under one roof. Customers can find complete outdoor solutions including Bayer Advanced™ plush green lawn care products, Cub Cadet® and Husqvarna® outdoor power equipment, a full line of award-winning Jackson & Perkins® roses, stylish and durable Coleman® outdoor furniture, powerful Jenn-Air® grills and unmatched National Geographic™ birding products. Our Signature Colors® premium paints feature thousands of colors, allowing customers to autograph their homes with designer palettes from names like Nickelodeon™ and Eddie Bauer® to Waverly.® And we’ve got every other aspect of home covered, including offering the award-winning designs of Kichler® lighting, the innovation of KitchenAid® and Whirlpool® appliances, the flexibility of Shop-Vac® wet/dry vacuums and the durability of Bosch and Hitachi power tools and accessories. We have a deep sense of appreciation, respect and responsibility for the brands entrusted to us, and we are focused on the needs of our customers. Our up-the-continuum strategy, coupled with our everyday low price guarantee, ensures we have the right brands, inspirational products and a wide range of solutions that meet every budget and taste. Lowe’s realizes the tools our customers need go beyond the tools on our shelves. Our customers can find the educational tools at Lowe’s that build confidence to initiate projects. Free weekly “How-To” clinics at every store offer our customers the opportunity to broaden their knowledge and develop their home improvement skills. Through affinity clubs such as Lowe’s Garden Club® and Lowe’s Woodworkers Club, customers receive exclusive offers, fun projects, and tips throughout the year in their ® particular areas of interest — all at no cost to them. And home improvement education continues online at Lowes.com with an online How-To Library containing a wealth of information available to our customers, from Creative Ideas magazine, to step-by- step installation and remodeling procedures. Whether their needs are simple or complex, Lowe’s is committed to make the investment in what our customers want. 2003 ANNUAL REPORT 11
  • 14. “This is who I come to for advice and support.” 12 LOWE’S COMPANIES, INC.
  • 15. “It’s hard to describe the pride I feel when I see the customers we call ‘regulars’ come in. I know they have choices, and just the fact they choose to come back time and time again lets me know our employees are doing it right.” M I K E H I C K S | District Manager Investing in our employees. Behind each red vest, our customers can find direction, encouragement and advice. At Lowe’s our culture is one of service and we are committed to equipping our employees with the right tools to satisfy our diverse customers’ needs. In addition to ongoing comprehensive training, Lowe’s enhanced our Customers First program in 2003, a program designed to define excellence in service and execution of the fundamentals of retailing. While everyday low prices and quality products bring customers through our doors, it’s the people and the level of service that keep them coming back. Our people are the foundation of our success and the primary contact with customers. An investment in them is an investment in the long-term success of Lowe’s. In addition to competitive compensation and bonus opportunities, Lowe’s offers employee benefits such as an employee stock purchase plan, which provides employees the opportunity to purchase Lowe’s stock at a discount and encourages them to share in the ownership of the company. Through the company’s 401(k) retirement savings vehicle, contributing employees receive a baseline match with the opportunity to earn an additional performance match as a reward for helping Lowe’s reach its earnings goals. Lowe’s encourages employees to grow with the company and supports this growth with financial assistance to attend colleges and universities, executive development opportunities and management training programs. Our store manager training program, an integral part of our management development, seeks to cultivate tomorrow’s store managers through extensive training sessions. As a part of the program, Larry Stone and other members of Lowe’s executive management team are actively involved in providing insight to the store managers of tomorrow, a testament to the importance Lowe’s places on continuity in management and the sharing of knowledge. With a culture of promoting from within, Lowe’s has a pipeline of seasoned talent ready for the opportunity to manage a new Lowe’s store. The culture at Lowe’s is one of dignity, mutual respect, personal pride and fairness, which fosters an environment committed to diversity and inclusion. As our workforce grows, open communication across the chain continues to be a focus, nourished through our monthly employee newsletter, the Lowedown, sharing relevant company information with all employees. Through employee surveys and open doors to management, employees are invited to share their thoughts, ideas and suggestions. The foundation on which Lowe’s stands is made up of our employees, 147,000 and growing. Providing world-class service one customer at a time, Lowe’s employees stimulate innovation and help maximize the performance of the company. 2003 ANNUAL REPORT 13
  • 16. “This is where I live.” Distribution Centers Existing Stores New Stores in 2003 Lowe’s Stores : Includes projected store openings in Fiscal ’04 AK: 2 CA: 65 FL: 71 ID: 4 KY: 28 MI: 36 MT: 3 NJ: 28 OH: 67 RI: 3 TX: 93 WV: 14 AL: 29 CO: 14 GA: 49 IL: 24 LA: 20 MN: 1 NC: 77 NM: 8 OK: 21 SC: 34 UT: 9 WY: 1 AR: 13 CT: 6 HI: 3 IN: 36 MA: 14 MO: 24 ND: 2 NV: 10 OR: 9 SD: 1 VA: 47 1,088 AZ: 16 DE: 5 IA: 9 KS: 9 MD: 21 MS: 14 NE: 3 NY: 31 PA: 47 TN: 43 WA: 24 STORES 14 LOWE’S COMPANIES, INC.
  • 17. “When a new neighbor moves in next door to you, I think everyone’s initial reaction is the same. You hope they will be friendly, courteous, and a good fit within the community. I get excited every time we announce a new Lowe’s store, because that’s just the kind of neighbor we are.” J O R G E R O D R I G U E Z | Store Manager, Bryan, TX Investing nationwide. We are meeting our customers where they live. In their neighborhoods with new stores; at their homes with an enhanced installed sales model; and online with educational and purchasing tools on Lowes.com. We answered the call to become increasingly more convenient with 130 new stores in 2003, expanding with both our 116,000-square-foot prototype in metro markets and our 94,000-square-foot store predominately in the smaller markets of the U.S. Incredible growth opportunities still remain … opportunities that will continue to broaden Lowe’s position as a one-stop shopping location for home improvement. With 140 stores planned for 2004, we will continue to increase our national presence, market penetration and convenience for our customers. For our customers, convenience means more than just a store closer to their homes. It means having the right products at the right time in the right places and at the right prices. And it’s the part of Lowe’s most customers never see that enables us to deliver on our promise. Behind the well-stocked shelves of products in the quantities necessary to meet our customers’ needs is a distribution infrastructure that includes a network of nine state-of-the-art regional distribution centers, allowing us to flow product efficiently to every store, regardless of the location. Efficient distribution is the key to profitably serving small markets and vital to flowing product to high-volume, large markets to maximize sales. And we are more than a home improvement store to the markets we serve. We are a good neighbor. During the year, Lowe’s responded to more than 40 natural disasters in 23 states. Following Hurricane Isabel and the California wildfires, Lowe’s and its employees rushed relief supplies to aid victims of the disasters. Through the combination of a Lowe’s customer donation program, corporate contributions, and Lowe’s Racing for Relief program with Team Lowe’s NASCAR driver Jimmie Johnson, Lowe’s and its customers were able to contribute over $580,000 in response to these two disasters alone. As a co-sponsor with Whirlpool Corporation on the Habitat for Humanity Jimmy Carter Work Project, Lowe’s impacted communities in the Southeast, donating nearly $375,000 to facilitate the construction of more than 100 homes. And as a continuation of its long-standing support, in 2004, Lowe’s will donate $2 million to help families achieve the dream of home ownership by joining forces with Habitat across the country as the national partner for Habitat’s Women Build program. Fulfilling Lowe’s mission to improve the communities it serves, Lowe’s Charitable and Educational Foundation awarded ten $100,000 grants in 2003, with six of them going to K-12 public education systems throughout the country. Additionally, Lowe’s is a proud supporter of the American Red Cross, the Home Safety Council, United Way of America and numerous nonprofit organizations and programs that help communities across the country. Lowe’s also encourages volunteerism through the Lowe’s Heroes program, a company-wide employee volunteer initiative aimed at addressing safety at home. 2003 ANNUAL REPORT 15
  • 18. “What you want.” “This is my store.” Our customers’ homes are a piece of their dreams. Quality products and trusted brands are necessary to turn those dreams into reality. With over 40,000 products in our stores and hundreds of thousands available through our Special Order program, our diverse customers have the freedom to express their unique tastes throughout their homes. “How you want it.” “The way you want it.” Customers return to our stores knowing that whether We know the importance of delivering more than just they need an accurate cut, a precise color match, products, whether it’s a commercial business customer professional installation or a quick delivery, they can get pressed for time, or a family beginning a major remodeling it at Lowe’s at low prices, every day, guaranteed. project. With well-staffed, organized stores and knowledgeable employees who stand ready to provide exceptional customer service, Lowe’s delivers a shopping experience that’s second to none. 16 LOWE’S COMPANIES, INC.
  • 19. “When you want it.” “Where you want it.” With a state-of-the-art distribution and logistics network With 130 new stores in 2003, we are continuing to meet that can replenish merchandise quickly, our customers find our customers where they live. And convenience goes well-stocked shelves with the products they need when they beyond adding new stores. It continues both inside and need them, in the right quantities for their jobs. outside of our stores with online shopping services, computer project design, convenient credit options and delivery services available seven days a week. Investing in our future. We see tremendous opportunity ahead for Lowe’s. Our expansion continues with 140 stores planned for 2004 and 150 planned for 2005. And we will continue to work toward growth within our existing product categories to gain market share in the highly fragmented home improvement marketplace. Our technology continues to evolve to meet the ever-changing needs of our growing customer base, and we will continue to seek opportunities to serve our customers more efficiently and more effectively, furthering our vision to be our customers’ first choice for home improvement. As ENERGY STAR® retail partner of the year, FORTUNE® magazine’s Most Admired Specialty Retailer and a supporter of numerous nonprofit organizations and programs across the country, we take our responsibilities as a corporate citizen seriously. We look forward to continuing to be good neighbors and socially responsible citizens, adding jobs in our communities, and lending a helping hand where it’s needed. We continue to define new opportunities for Lowe’s as the home improvement landscape continues to evolve, but there is one thing that will not change … our unwavering focus on serving our customers, making sure they each know they are Lowe’s most important customer. 2003 ANNUAL REPORT 17
  • 20. 2003 Financial Report 18. Management’s Responsibility for 27. Consolidated Balance Sheets. 39. Quarterly Review of Performance. Financial Reporting. 28. Consolidated Statements 40. Stock Performance, Stock Splits 19. Management’s Discussion and of Shareholders’ Equity. and Stock Dividends. Analysis of Financial Condition 29. Consolidated Statements 41. Selected Financial Data. and Results of Operations. of Cash Flows. 42. 10-Year Financial History. 25. Independent Auditors’ Report. 30. Notes to Consolidated 26. Consolidated Statements Financial Statements. of Earnings. Management’s Responsibility for Financial Reporting Lowe’s management is responsible for the preparation, integrity and fair presentation of its published financial statements. These statements have been prepared in accordance with accounting principles generally accepted in the United States of America and as such, include amounts based on management’s best estimates and judgments. Lowe’s management also prepared the other information included in the annual report and is responsible for its accuracy and consistency with the financial statements. The Company’s financial statements have been audited by the independent accounting firm Deloitte & Touche LLP, which was given unrestricted access to all financial records and related data. The Company believes that all representations made to the independent auditors during their audit were valid and appropriate. Deloitte & Touche’s audit report presented here provides an independent opinion upon the fairness of the financial statements. The Company maintains a system of internal control over financial reporting, which is designed to provide reasonable assurance to Lowe’s management and Board of Directors regarding the preparation of reliable published financial statements. The system includes appropriate divisions of responsibility, established policies and procedures which include a code of conduct to foster a strong ethical climate, each of which are communicated throughout the Company, and the careful selection, training and development of its people. Internal auditors monitor the operation of the internal control system and report findings and recommendations to management and the Board of Directors, and corrective actions are taken to address control deficiencies and other opportunities for improving the system as they are identified. The Board, operating through its audit committee, provides oversight to the financial reporting process. robert l. tillman r o b e r t f. h u l l , j r . chairman of the board and senior vice president and chief executive officer chief financial officer Disclosure Regarding Forward-Looking Statements Our Annual Report talks about our future, particularly in the “Letter to Shareholders” and “Management’s Discussion and Analysis of Financial Condition and Results of Operations.” While we believe our expectations are reasonable, they are not guarantees of future performance. Our actual results could differ substantially from our expectations because, for example: * Our sales are dependent upon the general economic health of the country, variations in the number of new housing starts, the level of repairs, remodeling and additions to existing homes, commercial building activity, and the availability and cost of financing. An economic downturn can impact sales because much of our inventory is purchased for discretionary projects, which can be delayed. In addition, on a short-term basis, weather may impact sales of product groups like lawn and garden, lumber, and building materials. * Our expansion strategy may be impacted by environmental regulations, local zoning issues and delays, availability and development of land, and more stringent land use regulations than we have traditionally experienced as well as the availability of sufficient labor to facilitate our growth. * Many of our products, like lumber and plywood, are commodities whose prices fluctuate erratically within an economic cycle. * Our business is highly competitive, and as we expand to larger markets and to the internet, we may face new forms of competition which do not exist in some of the markets we have traditionally served. * The ability to continue our everyday competitive pricing strategy and provide the products that customers want depends on our vendors providing a reliable supply of inventory at competitive prices and our ability to effectively manage our inventory. * Our commitment to increase market share and keep prices low requires us to make substantial investment in new technology and processes whose benefits could take longer than expected and could be difficult to implement. 18 LOWE’S COMPANIES, INC.
  • 21. Management’s Discussion and Analysis of Financial Condition and Results of Operations This discussion summarizes the significant factors affecting Initiatives Driving Performance Lowe’s believes the EDLP strat- the Company’s consolidated operating results, financial condition, egy and its low-price guarantee increase homeowner and com- liquidity and capital resources during the three-year period ended mercial business customer traffic, which leads to increased sales. January 30, 2004 (i.e., fiscal years 2003, 2002, and 2001). Each of Lowe’s is able to maintain its commitment to EDLP primarily by the fiscal years presented contains 52 weeks of sales and expenses. controlling inventory costs. The Company uses product line This discussion should be read in conjunction with the financial reviews and its global sourcing offices in Asia and other parts of the statements and financial statement footnotes included in this world to enhance margins while still providing its customers the annual report. value they have come to expect from Lowe’s. During the fourth quarter of fiscal 2003, the Company sold 26 To ensure that Lowe’s is satisfying its customers’ needs, from commodity-focused locations operating under The Contractor opening price points to premium products, the Company per- Yard name (the “Contractor Yards”). This sale was effected to allow forms rigorous product line reviews. Product line reviews involve the Company to continue to focus on its retail and commercial extensive market research, collaboration with vendors, and input business. In accordance with Statement of Financial Accounting from cross-functional teams to identify the optimal assortments, Standards (SFAS) No. 144, “Accounting for the Impairment or selection, brands and displays, as well as ways to lower costs. Disposal of Long-Lived Assets,” the Company has reported the Through the product line review process, Lowe’s has identified results of operations of the Contractor Yards as discontinued oper- areas in which its customers have expressed a desire for products ations for fiscal 2003, 2002 and 2001. that are more unique, higher quality or provide more options than an opening price point product may offer. To satisfy this customer desire, Lowe’s implemented its up-the-continuum strategy for a Executive overview. variety of products, which involves offering more product choices Lowe’s serves approximately 10 million customers a week at more in the middle and upper end of a price range. This initiative results than 950 home improvement stores in 45 states. Lowe’s vision is to in higher operating margins, defined as gross margin less selling, be its customers’ first choice for home improvement in each and general and administrative expenses (SG&A) and depreciation, for every market served. To do this, Lowe’s focuses on gaining cus- the Company. As a result of this initiative, Lowe’s is capturing an tomer loyalty by differentiating itself from competitors. Lowe’s increasing amount of the high-end market, which has grown sub- current strategy is to achieve this vision through excellent cus- stantially in the past several years. Based on the success the tomer service, Everyday Low Prices (EDLP), continued expansion, Company has experienced to date with this initiative in nearly development of the appropriate infrastructure to support growth, every product category, management believes that “up-the- retention of its best employees, innovative merchandising strate- continuum” is the right strategy for Lowe’s to continue to capital- gies, and specialty sales initiatives including Installed Sales, the ize on this trend and increase comparable store sales growth. Commercial Business Customer and Special Order Sales. The market research performed during product line reviews These strategies encompass a variety of initiatives driving has also led the Company to concentrate on differentiating itself Lowe’s current performance, which collectively contributed to from competitors through valued national brands. Lowe’s brand- Lowe’s comparable store sales growth of 6.7% for fiscal 2003. ing strategy is designed to build the Lowe’s brand quickly, effi- Other factors contributing to Lowe’s 2003 sales performance ciently, and effectively by offering its customers the best-known, include strong demand fueled by its customers’ commitment to and most-respected national brands. These are brands that Lowe’s investing in their homes, supplemented by a solid housing market customers value and trust and increasingly include Lowe’s exclu- and increased disposable income aided by lower Federal individual sive brands. income tax withholding rates and income tax rebates. Increased As “do-it-yourself” expands to more “do-it-for-me” projects, wholesale prices of lumber and plywood, which translated into Lowe’s targets three key specialty sales areas: Installed Sales, the higher retail prices of these products, also contributed to the Commercial Business Customer and Special Order Sales. The increased comparable store sales. Company is targeting these areas because its commercial cus- In spite of concerns about the impact of potential increases in tomers perform a significant portion of the “do-it-for-me” remod- interest rates on the home improvement market, the strength in eling services. Lowe’s currently offers a variety of installation serv- the housing market has continued. Mortgage rates have remained ices, driven by three main categories: kitchen (cabinets, appliances low, keeping housing affordable and facilitating continued and countertops), floor coverings, and millwork products. Lowe’s demand. Consumer confidence has improved, which management goal with all installed projects is to make the process as easy as pos- believes will contribute to further growth. In addition, the Home sible for customers. To do this and keep up with the continued Improvement Research Institute predicts an average of nearly 5% growth in installed sales, Lowe’s has been working to build a scala- industry growth per year for the next several years. ble model to enhance its services and improve customer experi- ence. The Company expects to have this model available in all Lowe’s stores by the end of fiscal 2004. 2003 ANNUAL REPORT 19
  • 22. When it comes to commercial customers, Lowe’s targets the long-length products like lumber, plywood, ladders, and pipe. professionals serving the needs of homeowners. These profession- Delivering these products on flat-bed trucks allows employees at als include remodelers, small builders, maintenance and property the stores to off-load them quickly. To support Lowe’s store expan- managers and specialty trades, like electricians, plumbers and sion plans, the Company is planning to open three additional landscapers. Lowe’s also wants to position itself as an alternative to flatbed distribution centers in 2004. traditional supply houses and leverage core business strengths to The Company expects to open 140 stores in 2004 (including build the commercial business. These strengths include conven- approximately four relocations), increasing total square footage by ience, ease of finding supplies, the EDLP strategy and specialized approximately 14%. To manage this expansion, the Company is commercial credit programs. The Company believes increasing adding two more divisions in fiscal 2004, bringing the total num- sales to commercial business customers offers the opportunity for ber of divisions to five. With the addition of these two divisions, increasing overall sales and developing a more loyal customer base. Lowe’s will increase its number of regions from 19 to 22 and its Lowe’s currently offers hundreds of thousands of products on number of districts from 135 to 150. Lowe’s goal is to maintain a special order. Sales of these products have continued to outpace the ratio of approximately 7-8 stores per district manager and 50-60 Company’s overall sales growth. Lowe’s focus in 2003 was on per regional vice president. This is consistent with Lowe’s commit- developing new technology that will allow the Company to effec- ment to ensure that its stores are executing the Company’s plans tively and efficiently add and maintain special order options for its and programs to continue to increase market share and better sat- customers. The Company created an electronic sales tool that isfy customers with more convenience through additional store automates the configuration, ordering, fulfillment and replenish- openings and an infrastructure to support growth. ment processes for special orders, reduces errors and lead time and Lowe’s is also continuing to focus on improved management in increases visibility. In addition, the system will list other items cus- its stores. As a result, in 2003, Lowe’s changed the management tomers may need to complete their project, which should improve structure in its stores to provide store managers with a more struc- customer satisfaction and increase average ticket. tured management team and to provide employees with new career opportunities. Lowe’s believes this focus on improved man- Expansion and Growth Potential Management believes there is agement will help attract and retain the best employees. opportunity for Lowe’s continued growth as the Company moves forward with store expansion focused on major metropolitan mar- Critical accounting policies kets. These metropolitan markets, which the Company defines as and estimates. populations greater than 500,000, represent a significant untapped The following discussion and analysis of the results of operations opportunity for Lowe’s. In fiscal 2003, Lowe’s opened its first stores and financial condition are based on the Company’s financial in the Chicago metropolitan market and has also announced plans statements that have been prepared in accordance with accounting to open stores in other metropolitan markets. In addition, Lowe’s principles generally accepted in the United States of America. The expanded its store count in Florida and California, two of the preparation of these financial statements requires management to fastest-growing states in the U.S. make estimates that affect the reported amounts of assets, liabili- While Lowe’s growth plans are increasingly targeting larger ties, revenues and expenses, and related disclosures of contingent metropolitan areas, the Company continues to expand in smaller assets and liabilities. The Company bases these estimates on his- markets. As a result, Lowe’s store opening plans include two proto- torical results and various other assumptions believed to be rea- types: a 116,000-square-foot (116K) store for major metropolitan sonable, the results of which form the basis for making estimates markets and a 94,000-square-foot (94K) store primarily to serve concerning the carrying values of assets and liabilities that are not smaller markets. This smaller prototype will provide hundreds of readily available from other sources. Actual results may differ from additional storing opportunities in smaller markets across the these estimates. country. The store includes 94,000 square feet of retail selling space The Company’s significant accounting polices are described in plus an approximate 26,000-square-foot garden center, and has the Note 1 to the consolidated financial statements. Management same look and feel of Lowe’s larger stores. In the 94K store, Lowe’s believes that the following accounting policies affect the more sig- has consolidated service in a number of departments and stocks nificant estimates used in preparing the consolidated financial 20% fewer SKUs than in the 116K stores. While there are fewer statements. SKUs, the 94K store still offers strong assortments with a rational mix from opening price points to premium products. For items Merchandise Inventory The Company records an inventory not stocked in a 94K store, special order options are available to reserve for the loss associated with selling discontinued inventories meet customer needs. Expanding into these smaller markets is below cost. This reserve is based on management’s current knowl- made possible by Lowe’s logistics and distribution capabilities that edge with respect to inventory levels, sales trends and historical allow the Company to quickly and efficiently supply products to experience relating to the liquidation of discontinued inventory. these stores. Management does not believe the Company’s merchandise inven- The Company currently has nine regional distribution centers tories are subject to significant risk of obsolescence in the near- located across the United States and plans to open an additional term, and management has the ability to adjust purchasing center in 2004 and another in fiscal 2005. The Company also has practices based on anticipated sales trends and general economic nine flatbed distribution centers for warehousing and distributing 20 LOWE’S COMPANIES, INC.
  • 23. conditions. However, changes in consumer purchasing patterns Self-Insurance The Company is self-insured for certain losses could result in the need for additional reserves. The Company also relating to worker’s compensation, automobile, general and prod- records an inventory reserve for the estimated shrinkage between uct liability claims. Self-insurance claims filed and claims incurred physical inventories. This reserve is based primarily on actual but not reported are accrued based upon management’s estimates shrinkage results from previous physical inventories. Changes of the discounted aggregate liability for uninsured claims incurred in actual shrinkage results from completed physical inventories using actuarial assumptions followed in the insurance industry could result in revisions to previously estimated shrinkage and historical experience. These estimates are subject to changes in expense. Management believes it has sufficient current and histor- forecasted payroll, sales and vehicle units, as well as the frequency ical knowledge to record reasonable estimates for both of these and severity of claims. Although management believes it has the inventory reserves. ability to adequately record estimated losses related to claims, it is possible that actual results could differ from recorded self-insur- Vendor Funds The Company receives funds from vendors in the ance liabilities. normal course of business for a variety of reasons, including pur- chase-volume-related rebates, defective merchandise allowances, Operations. advertising allowances, reimbursement for selling expenses, dis- Net earnings for 2003 increased 28% to $1.9 billion or 6.1% of plays and third-party, in-store service-related costs. Management sales compared to $1.5 billion or 5.6% of sales for 2002. Net earn- uses projected purchase volumes to determine earnings rates, vali- ings for 2002 increased 44% to $1.5 billion or 5.6% of sales com- dates those projections based on actual and historical purchase pared to $1.0 billion or 4.7% of sales for 2001. Diluted earnings per trends and applies those rates to actual purchase volumes to deter- share were $2.34 for 2003 compared to $1.85 for 2002 and $1.30 mine the amount of funds earned by the Company and receivable for 2001. Return on beginning assets, defined as net earnings divid- from the vendor. Amounts earned could be impacted if actual ed by beginning total assets, was 11.7% for 2003, compared to purchase volumes differ from projected purchase volumes. The 10.7% for 2002 and 9.0% for 2001, and return on beginning share- Company has historically treated volume-related discounts or holders’ equity, defined as net earnings divided by beginning rebates as a reduction of inventory cost and reimbursements of shareholders’ equity, was 22.6% for 2003, compared to 22.0% for operating expenses received from vendors as a reduction of those 2002 and 18.6% for 2001. Return on invested capital, defined as net specific expenses. The Company’s historical accounting treatment earnings plus after-tax interest divided by the sum of beginning for these vendor-provided funds is consistent with Emerging debt and equity, was 16.5% for 2003, compared to 15.1% for 2002 Issues Task Force (EITF) 02-16 “Accounting by a Customer and 13.8% for 2001. (Including a Reseller) for Certain Consideration Received From a Sales amounts are from continuing operations and exclude Vendor” with the exception of certain cooperative advertising sales from the Contractor Yard locations. The Company recorded allowances and in-store services provided by third parties for sales of $30.8 billion in 2003, an 18% increase over 2002 sales of which the costs are ultimately funded by vendors. The Company $26.1 billion. Sales for 2002 were 20% higher than 2001 levels. The previously treated the cooperative advertising allowances and in- increases in sales are attributable to the Company’s ongoing store store service funds as a reduction of the related expense. Under expansion and relocation program and comparable store sales EITF 02-16, cooperative advertising allowances and in-store serv- increases. Comparable store sales increased 6.7% in 2003, com- ice funds should be treated as a reduction of inventory cost, unless pared to 5.8% in 2002. Average ticket increased 4% from $56.80 in they represent a reimbursement of specific, incremental and iden- 2002 to $59.21 in 2003 due in part to the success of the up-the- tifiable costs incurred by the customer to sell the vendor’s product. continuum initiative as well as Lowe’s credit programs. The cooperative advertising and in-store service funds that the The comparable store sales increase in 2003 primarily resulted Company receives do not meet the specific, incremental and iden- from improved sales in every merchandising category due to the tifiable criteria in EITF 02-16. Therefore, for cooperative advertis- initiatives previously described. During the year, the Company ing and third-party, in-store service fund agreements entered into experienced its strongest sales increases in lumber, building mate- after December 31, 2002, which was the effective date of the relat- rials, outdoor power equipment, paint, flooring and home organi- ed provision of EITF 02-16, the Company is treating these funds as zation. Major appliances continue to perform well and also exceed- a reduction in the cost of inventory and recognizing these funds as ed the Company average comparable store sales increase. In addi- a reduction of cost of sales when the inventory is sold. There is no tion, millwork, hardware, walls & windows, nursery and cabinets impact to the timing of when the funds are received from vendors performed at approximately the overall corporate average compa- or the associated cash flows, but there is an impact to the timing of rable store sales increase. Comparable store sales were positive for income recognition. This accounting change did not have a mate- every product category and all geographic regions due in part to rial impact on the fiscal 2003 financial results, since substantially all the implementation of the merchandising and operations strate- of the cooperative advertising allowance and in-store service fund gies previously discussed. The Company experienced slight infla- agreements for fiscal 2003 were entered into prior to December 31, tion in lumber and building material prices during the year, which 2002. The Company estimates that this one-time change in positively impacted comparable store sales by 50 basis points. The accounting will reduce fiscal 2004 earnings per share by approxi- following table presents sales and store information excluding dis- mately $0.13 per share. continued operations: 2003 ANNUAL REPORT 21
  • 24. Depreciation, reflecting continued expansion, increased 22% to 2003 2002 2001 Sales (in millions) $30,838 $26,112 $21,714 $758 million in 2003, compared to increases of 21% and 26% in Sales Increases 18% 20% 18% 2002 and 2001, respectively. Depreciation as a percentage of sales Comparable Store Sales Increases 6.7% 5.8% 2.5% was 2.5% for 2003, a slight increase from 2.4% in 2002 and 2001. Average Ticket $ 59.21 $ 56.80 $ 55.05 Approximately 95% of new stores opened in the last three years Average Ticket Increases 4% 3% 2% have been owned. Property, less accumulated depreciation, At end of year: increased to $11.9 billion at January 30, 2004 compared to Stores 952 828 718 $10.4 billion at January 31, 2003. The increase in property resulted Sales Floor Square Feet (in millions) 108.8 94.7 80.7 primarily from the Company’s store expansion program and Average Store Size Square Feet (in thousands) 114 114 112 increased distribution capacity. Gross margin in 2003 was 31.2% of sales compared to 30.4% in Net interest costs as a percent of sales were 0.6% for 2003, 0.7% 2002. Both of these years showed improvement over the 29.0% rate for 2002 and 0.8% for 2001. Net interest costs totaled $180 million achieved in 2001. The gross margin increases were driven not by in 2003, $182 million in 2002 and $174 million in 2001. Interest higher prices, but rather the reduction of inventory acquisition costs have decreased due to lower debt levels resulting from sched- costs. These lower inventory acquisition costs resulted in part from uled debt repayments. Interest costs relating to capital leases were the product line review process, which takes costs out of the supply $40 million for 2003 and 2002 and $41 million for 2001. See the chain, as well as the use of the Company’s sourcing offices to import following discussion of liquidity and capital resources. products when possible. A reduction in inventory shrinkage as a The Company’s effective income tax rates were 37.9%, 37.6% percentage of sales in all three years presented also contributed to and 37.0% in 2003, 2002 and 2001, respectively. The higher rates the increase in margin. From 2002 to 2003, the reduction of inven- were primarily related to expansion into states with higher state tory shrinkage resulted in a 14 basis point increase in gross margin. income tax rates. SG&A expenses were $5.5 billion or 18.0% of sales in 2003. SG&A expenses in the two previous years were $4.7 billion and Financial condition, liquidity $3.9 billion or 17.9% and 17.8% of sales, respectively. During 2003, and capital resources. SG&A increased 19% compared to the 18% increase in sales. In 2002, SG&A increased 21% compared to the 20% sales increase. In The following table summarizes the Company’s significant 2001, SG&A increased 17% compared to the 18% sales increase. contractual obligations and commercial commitments. The increase as a percent to sales in SG&A in 2003 was primarily Payments Due by Period Contractual due to stock compensation expense recorded as a result of the –––––––––––––––––––––––––––––––––––––––––––––––––––––––––––––––––––––––––––––––––––––––––––––––––––––––––––––––––––––––––––––––––––––––––––––––––––––––––––––––––– Obligations Less than 1-3 4-5 After 5 adoption of the fair value recognition provisions of Statement of (In Millions) Total 1 year years years years Financial Accounting Standards (SFAS) No. 123, “Accounting for Long-Term Debt (net of discount) $ 3,773 $ 54 $ 616 $ 67 $ 3,036 Stock-Based Compensation,” prospectively for all employee awards Capital Lease granted or modified after January 31, 2003. The increase as a per- Obligations 770 60 120 118 472 cent to sales in SG&A in 2002 was primarily due to increased store Operating Leases 3,220 225 438 432 2,125 salaries combined with increased bonus achievement levels driven Purchase Obligations1 105 105 – – – by increased earnings. The decrease as a percent to sales in SG&A Total Contractual during 2001 was primarily attributable to expense controls involv- Cash Obligations $ 7,868 $ 444 $1,174 $ 617 $ 5,633 ing payroll and advertising costs. 1Represents contracts for purchases of property and construction of buildings. Store opening costs, which were expensed as incurred, were $128 million for 2003 compared to $129 million and $140 million The primary sources of liquidity are cash flows from operating in 2002 and 2001, respectively. These costs are associated with the activities. Net cash provided by operating activities from continu- opening of 130 stores in 2003 (125 new and five relocated). This ing operations was $3.0 billion for 2003 compared to $2.7 billion compares to 123 stores in 2002 (112 new and 11 relocated) and 115 and $1.6 billion in 2002 and 2001, respectively. The increase in cash stores in 2001 (101 new and 14 relocated). Because store opening provided by operating activities during 2003 resulted primarily costs are expensed as incurred, the expenses recognized may fluc- from increased net earnings. The increase in cash provided by tuate based on the timing of store openings in future or prior peri- operating activities during 2002 resulted primarily from increased ods. As a percentage of sales, store opening costs were 0.4% for net earnings, improved payables leverage due to better inventory 2003 compared to 0.5% and 0.6% in 2002 and 2001, respectively. turns and an increase in operating liabilities primarily due to the Store opening costs averaged approximately $1.0 million per store increase in sales volume. Working capital at January 30, 2004 was in 2003 and 2002, and $1.2 million in 2001. $2.3 billion compared to $2.0 billion at January 31, 2003. The primary component of net cash used in investing activities from continuing operations continues to be new store facilities and the infrastructure to support this growth. Cash acquisitions of fixed assets were $2.4 billion for both 2003 and 2002. This com- pares to $2.2 billion for 2001. Retail selling space of 108.8 million square feet as of January 30, 2004 increased 15% over the selling 22 LOWE’S COMPANIES, INC.