SlideShare uma empresa Scribd logo
1 de 155
Baixar para ler offline
UNITED STATES
                                   SECURITIES AND EXCHANGE COMMISSION
                                                            Washington, D.C. 20549


                                                             Form 10-K
(Mark One)
    ¥                            ANNUAL REPORT PURSUANT TO SECTION 13 OR 15(d) OF
                                      THE SECURITIES EXCHANGE ACT OF 1934
                                                        For the fiscal year ended December 31, 2006
                                                                             OR
     n                       TRANSITION REPORT PURSUANT TO SECTION 13 OR 15(d) OF
                                     THE SECURITIES EXCHANGE ACT OF 1934
                                                  For the transition period from                     to             .
                                                   Commission File Number 1-14365
                                                  El Paso Corporation
                                            (Exact Name of Registrant as Specified in Its Charter)
                               Delaware                                                                   76-0568816
                      (State or Other Jurisdiction of                                                  (I.R.S. Employer
                       Incorporation or Organization)                                                 Identification No.)

                         El Paso Building
                       1001 Louisiana Street
                          Houston, Texas                                                                    77002
                 (Address of Principal Executive Offices)                                                  (Zip Code)
                                                     Telephone Number: (713) 420-2600
                                                     Internet Website: www.elpaso.com
                                         Securities registered pursuant to Section 12(b) of the Act:
                                                                                                   Name of Each Exchange
                          Title of Each Class                                                       on which Registered

            Common Stock, par value $3 per share                                               New York Stock Exchange
                                 Securities registered pursuant to Section 12(g) of the Act: None
     Indicate by check mark if the registrant is a well-known seasoned issuer, as defined in Rule 405 of the Securities
Act. Yes ¥           No n.
     Indicate by check mark if the registrant is not required to file reports pursuant to Section 13 or Section 15(d) of the
Act. Yes n           No ¥.
     Indicate by check mark whether the registrant (1) has filed all reports required to be filed by Section 13 or 15(d) of the Securities
Exchange Act of 1934 during the preceding 12 months (or for such shorter period that the registrant was required to file such reports), and
(2) has been subject to such filing requirements for the past 90 days. Yes ¥             No n.
     Indicate by check mark if disclosure of delinquent filers pursuant to Item 405 of Regulation S-K is not contained herein, and will not be
contained, to the best of registrant’s knowledge, in definitive proxy or information statements incorporated by reference in Part III of this
Form 10-K or any amendment to this Form 10-K. ¥
     Indicate by check mark whether the registrant is a large accelerated filer, an accelerated filer, or a non-accelerated filer. See definition of
“accelerated filer and large accelerated filer” in Rule 12b-2 of the Exchange Act. (Check one):
Large accelerated filer ¥                                      Accelerated filer n                                       Non-accelerated filer n
     Indicate by check mark whether the registrant is a shell company (as defined in Rule 12b-2 of the Exchange Act). Yes n                No ¥.
     State the aggregate market value of the voting and non-voting common equity held by non-affiliates of the registrant.
     Aggregate market value of the voting stock (which consists solely of shares of common stock) held by non-affiliates of the registrant as of
June 30, 2006 computed by reference to the closing sale price of the registrant’s common stock on the New York Stock Exchange on such date:
$10,437,735,495.
     Indicate the number of shares outstanding of each of the registrant’s classes of common stock, as of the latest practicable date.
     Common Stock, par value $3 per share. Shares outstanding on February 21, 2007: 698,334,034
                                                 Documents Incorporated by Reference
     List hereunder the following documents if incorporated by reference and the part of the Form 10-K (e.g., Part I, Part II, etc.) into which the
document is incorporated: Portions of our definitive proxy statement for the 2007 Annual Meeting of Stockholders are incorporated by
reference into Part III of this report. These will be filed no later than April 30, 2007.
EL PASO CORPORATION
                                                           TABLE OF CONTENTS

                                                                            Caption                                                                   Page


                                                                      PART I
Item   1.      Business . . . . . . . . . . . . . . . . . . . . . . . . . . . . . . . . . . . . . . .   .......................                         1
Item   1A.     Risk Factors . . . . . . . . . . . . . . . . . . . . . . . . . . . . . . . . . . . .     .......................                        22
Item   1B.     Unresolved Staff Comments . . . . . . . . . . . . . . . . . . . . . . . . .              .......................                        31
Item   2.      Properties . . . . . . . . . . . . . . . . . . . . . . . . . . . . . . . . . . . . . .   .......................                        31
Item   3.      Legal Proceedings . . . . . . . . . . . . . . . . . . . . . . . . . . . . . . . .        .......................                        31
Item   4.      Submission of Matters to a Vote of Security Holders. . . . . . .                         .......................                        31

                                                          PART II
Item 5.  Market for Registrant’s Common Equity, Related Stockholder Matters and Issuer Purchases
           of Equity Securities . . . . . . . . . . . . . . . . . . . . . . . . . . . . . . . . . . . . . . . . . . . . . . . . . . . .                32
Item 6.  Selected Financial Data . . . . . . . . . . . . . . . . . . . . . . . . . . . . . . . . . . . . . . . . . . . . . . . . . . .                 34
Item 7.  Management’s Discussion and Analysis of Financial Condition and Results of Operations . .                                                     35
Item 7A. Quantitative and Qualitative Disclosures About Market Risk . . . . . . . . . . . . . . . . . . . . . . . .                                    74
Item 8.  Financial Statements and Supplementary Data . . . . . . . . . . . . . . . . . . . . . . . . . . . . . . . . . .                               77
Item 9.  Changes in and Disagreements with Accountants on Accounting and Financial Disclosure . .                                                     149
Item 9A. Controls and Procedures. . . . . . . . . . . . . . . . . . . . . . . . . . . . . . . . . . . . . . . . . . . . . . . . . . .                 149
Item 9B. Other Information . . . . . . . . . . . . . . . . . . . . . . . . . . . . . . . . . . . . . . . . . . . . . . . . . . . . . . .              149
                                                              PART III
Item 10.       Directors, Executive Officers and Corporate Governance . . . . . . . . . . . . . . . . . . . . . . . . . . .                           150
Item 11.       Executive Compensation . . . . . . . . . . . . . . . . . . . . . . . . . . . . . . . . . . . . . . . . . . . . . . . . . .             150
Item 12.       Security Ownership of Certain Beneficial Owners and Management and Related
                 Stockholder Matters . . . . . . . . . . . . . . . . . . . . . . . . . . . . . . . . . . . . . . . . . . . . . . . . . . . .          150
Item 13.       Certain Relationships and Related Transactions, and Director Independence . . . . . . . . . . . . .                                    150
Item 14.       Principal Accountant Fees and Services . . . . . . . . . . . . . . . . . . . . . . . . . . . . . . . . . . . . . . .                   150

                                                                     PART IV
Item 15.       Exhibits and Financial Statement Schedules . . . . . . . . . . . . . . . . . . . . . . . . . . . . . . . . . . . .                     150
               Signatures . . . . . . . . . . . . . . . . . . . . . . . . . . . . . . . . . . . . . . . . . . . . . . . . . . . . . . . . . . . . .   152

       Below is a list of terms that are common to our industry and used throughout this document:
/d         =   per day                                                            MDth        =   thousand dekatherms
Bbl        =   barrel                                                             MMBtu       =   million British thermal units
BBtu       =   billion British thermal units                                      MMcf        =   million cubic feet
Bcf        =   billion cubic feet                                                 MMcfe       =   million cubic feet of natural gas equivalents
Bcfe       =   billion cubic feet of natural gas equivalents                      GWh         =   thousand megawatt hours
LNG        =   liquefied natural gas                                              MW          =   megawatt
MBbls      =   thousand barrels                                                   NGL         =   natural gas liquids
Mcf        =   thousand cubic feet                                                TBtu        =   trillion British thermal units
Mcfe       =   thousand cubic feet of natural gas equivalents                     Tcfe        =   trillion cubic feet of natural gas equivalents

     When we refer to natural gas and oil in “equivalents,” we are doing so to compare quantities of oil with
quantities of natural gas or to express these different commodities in a common unit. In calculating equivalents, we
use a generally recognized standard in which one Bbl of oil is equal to six Mcf of natural gas. Also, when we refer to
cubic feet measurements, all measurements are at a pressure of 14.73 pounds per square inch.

    When we refer to “us”, “we”, “our”, “ours”, “the Company”, or “El Paso”, we are describing El Paso
Corporation and/or our subsidiaries.

                                                                             i
PART I

ITEM 1. BUSINESS
  Business and Strategy
     We are an energy company, originally founded in 1928 in El Paso, Texas that primarily operates in the
regulated natural gas transmission and exploration and production sectors of the energy industry. Our purpose is to
provide natural gas and related energy products in a safe, efficient and dependable manner.
     Regulated Natural Gas Transmission. We own or have interests in North America’s largest interstate pipeline
system with approximately 55,000 miles of pipe that connect North America’s major producing basins to its major
consuming markets. We also provide approximately 470 Bcf of storage capacity and have an LNG receiving
terminal and related facilities in Elba Island, Georgia with 806 MMcf of daily base load sendout capacity. In
February 2007, we sold ANR Pipeline Company (ANR), our Michigan storage assets and our 50 percent interest in
Great Lakes Gas Transmission, which comprised approximately 12,600 miles of pipeline and 236 Bcf of storage
capacity. The size, connectivity and diversity of our remaining U.S. pipeline system provides growth opportunities
through infrastructure development or large scale expansion projects and gives us the capability to adapt to the
dynamics of shifting supply and demand. We are focused on enhancing the value of our transmission business
through successful recontracting, continual efficiency improvements through reliable and safe operations, cost
management, developing growth projects and prudent capital spending in the United States and Mexico.
     Exploration and Production. Our exploration and production business is currently focused on the explo-
ration for and the acquisition, development and production of natural gas, oil and NGL in the United States, Brazil
and Egypt. As of December 31, 2006, we held an estimated 2.4 Tcfe of proved natural gas and oil reserves, exclusive
of our equity share in the proved reserves of an unconsolidated affiliate of 222 Bcfe. In this business, we are focused
on growing our reserve base through disciplined capital allocation and portfolio management, cost control and
marketing and selling our natural gas and oil production at optimal prices while managing associated price risks.
     Our operations are conducted through three primary segments: Pipelines, Exploration and Production and
Marketing. We also have a Power segment which holds our remaining interests in international power plants in
Brazil, Asia and Central America. Our business segments provide a variety of energy products and services and are
managed separately as each segment requires different technology and marketing strategies. For further discussion
of our business segments, see Part II, Item 7, Management’s Discussion and Analysis of Financial Condition and
Results of Operations and Part II, Item 8, Financial Statements and Supplementary Data, Note 17.

Pipelines Segment
     Our Pipelines segment includes our interstate natural gas transmission systems and related operations. These
operations are conducted through eight separate, wholly owned pipeline systems and five partially owned systems.
These systems connect the nation’s principal natural gas supply regions to the five largest consuming regions in the
United States: the Gulf Coast, California, the northeast, the southwest and the southeast. We also have access to
systems in Canada and assets in Mexico. Our pipelines segment also includes (i) our ownership of storage capacity
through our wholly owned transmission systems, two wholly owned storage facilities, and three partially owned
storage systems as well as (ii) our LNG terminal and related facilities.
     Each of our U.S. pipeline systems and storage facilities operate under Federal Energy Regulatory Commission
(FERC) approved tariffs that establish rates, cost recovery mechanisms, and other terms and conditions of service to
our customers. The fees or rates established under our tariffs are a function of our costs of providing services to our
customers, including a reasonable return on our invested capital.
     Our strategy is to enhance the value of our transmission and storage business by:
     • Expanding our systems by attracting new customers, markets or supply sources;
     • Identifying and developing growth opportunities;
     • Recontracting or contracting available or expiring capacity;

                                                          1
• Focusing on efficiency in our operations and cost control, including efficiencies that may be available across
      our systems;
    • Maintaining the value and ensuring the safety of our pipeline systems and assets; and
    • Providing outstanding customer service.

Wholly Owned Interstate Transmission Systems
                                                               As of December 31, 2006
                                                                                             Average Throughput(1)
   Transmission                  Supply and                 Miles of   Design     Storage
      System                    Market Region               Pipeline Capacity Capacity      2006     2005     2004
                                                                      (MMcf/d)     (Bcf)           (BBtu/d)
Tennessee Gas       Extends from Louisiana, the Gulf        14,100      6,961       90      4,534   4,443     4,469
  Pipeline          of Mexico and south Texas to the
  (TGP)             northeast section of the U.S.,
                    including the metropolitan areas of
                    New York City and Boston.
ANR Pipeline(2)     Extends from Louisiana,                 10,500      7,311      197      3,954   4,100     4,067
 (ANR)              Oklahoma, Texas and the Gulf of
                    Mexico to the midwestern and
                    northeastern regions of the U.S.,
                    including the metropolitan areas of
                    Detroit, Chicago and Milwaukee.
                                                                      5,650(3)
El Paso Natural     Extends from San Juan, Permian          10,300                  44      4,179   4,053     4,074
  Gas (EPNG)        and Anadarko basins to California,
                    its single largest market, as well as
                    markets in Arizona, Nevada,
                    New Mexico, Oklahoma, Texas
                    and northern Mexico.
Southern Natural    Extends from natural gas fields in       7,500      3,450       60      2,211   1,984     2,163
  Gas (SNG)         Texas, Louisiana, Mississippi,
                    Alabama and the Gulf of Mexico
                    to Louisiana, Mississippi,
                    Alabama, Florida, Georgia, South
                    Carolina and Tennessee, including
                    the metropolitan areas of Atlanta
                    and Birmingham.
Colorado            Extends from production areas in         4,000      3,000       29      2,008   1,902     1,744
  Interstate Gas    the Rocky Mountain region and the
  (CIG)             Anadarko Basin to the front range
                    of the Rocky Mountains and
                    multiple interconnections with
                    pipeline systems transporting gas
                    to the midwest, the southwest,
                    California and the Pacific
                    northwest.
Wyoming             Extends from western Wyoming,              700      2,330       —       1,914   1,572     1,214
 Interstate         western Colorado and the Powder
 (WIC)              River Basin to various pipeline
                    interconnections near Cheyenne,
                    Wyoming.


                                                        2
As of December 31, 2006
                                                                                                      Average Throughput(1)
      Transmission                    Supply and                    Miles of   Design     Storage
         System                      Market Region                  Pipeline Capacity Capacity       2006     2005     2004
                                                                              (MMcf/d)     (Bcf)            (BBtu/d)
Mojave Pipeline         Connects with the EPNG system                  400           407      —       461      161        161
 (MPC)                  near Cadiz, California, the EPNG
                        and Transwestern systems at
                        Topock, Arizona and to the Kern
                        River Gas Transmission Company
                        system in California to customers
                        in the vicinity of Bakersfield,
                        California.
Cheyenne Plains         Extends from Cheyenne hub in                   400           838      —       583      433        89
  Gas Pipeline(4)       Colorado to various pipeline
  (CPG)                 interconnections near Greensburg,
                        Kansas.
(1)
      Includes throughput transported on behalf of affiliates.
(2)
      Sold in February 2007.
(3)
      This capacity reflects winter-sustainable west-flow capacity of 4,850 MMcf/d and approximately 800 MMcf/d of east-end
      delivery capacity.
(4)
      This system was completed in 2005.
     As of December 31, 2006, we had the following pipeline and storage expansion projects on our existing
systems that have been approved by the FERC:
                                  Capacity                                                                    Anticipated
Project                          (MMcf/d)                              Description                          Completion Date

Louisiana Deepwater                 850        To construct a 300 foot extension of our 20-inch             July 2007
  Link                                         Grand Isle supply lateral, construct 2,100 feet of
                                               24-inch West Delta supply lateral, abandon
                                               3,100 feet of the 20-inch line connected to the
                                               Grand Isle platform, and install appurtenant
                                               facilities on Enterprise Product Partners
                                               Independence Hub platform located in Mississippi
                                               Canyon Block 920.
Triple-T Extension                  200        To construct 6.2 miles of 24-inch pipeline to                September 2007
                                               extend our existing 30-inch Triple-T Line,
                                               beginning in Eugene Island Block 349, to
                                               interconnect with Enterprise Products Partners
                                               L.P.’s Anaconda System on the El 371 platform, as
                                               well as associated piping and other appurtenant
                                               facilities.
Essex Middlesex Project              80        To construct 7.8 miles of 24-inch pipeline                   November 2007
                                               connecting our Beverly-Salem line to the DOMAC
                                               line in Essex and Middlesex Counties,
                                               Massachusetts.
Northeast ConneXion —               108        To construct a compression station and modify                November 2007
  New England                                  compression at six existing facilities on our
                                               interstate pipeline system in Pennsylvania,
                                               New York, and Massachusetts.
                                                                                                            May 2007(1)
Cypress Expansion                   500        To construct approximately 177 miles of pipeline
                                               to connect our Elba Island facility with markets in
                                               Georgia and Florida.
(1)
      Project will consist of three phases. The anticipated completion date is related to phase 1.


                                                                3
Partially Owned Interstate Transmission Systems
                                                                                    As of December 31, 2006
                                                                                                                     Average Throughput(2)
      Transmission                          Supply and                        Ownership     Miles of     Design
        System(1)                                                                          Pipeline(2) Capacity(2)
                                           Market Region                        Interest                             2006    2005   2004
                                                                               (Percent)               (MMcf/d)            (BBtu/d)
Florida Gas                Extends from South Texas to South                          50      4,868       2,090      2,018      1,916     2,014
  Transmission(3)          Florida.
Great Lakes Gas            Extends from Manitoba-Minnesota                            50      2,115       2,600      2,244      2,376     2,200
  Transmission(4)          border to the Michigan-Ontario border
                           at St. Clair, Michigan.
Samalayuca                 Extends from U.S.-Mexico border to                         50         23         460          442      423      433
  Pipeline and             the state of Chihuahua, Mexico.
  Gloria a Dios
  Compression
  Station
San Fernando               Extends from Pemex Compression                             50         71       1,000          951      951      951
  Pipeline                 Station 19 to the Pemex metering
                           station in San Fernando, Mexico in the
                           State of Tamaulipas.

(1)
      These systems are accounted for as equity investments.
(2)
      Miles, volumes and average throughput represent the systems’ totals and are not adjusted for our ownership interest.
(3)
      We have a 50 percent equity interest in Citrus Corp. (Citrus), which owns this system.
(4)
      Sold in February 2007.

Partially Owned Intrastate Transmission Systems
     We also have a 50 percent interest in WYCO Development, L.L.C. (WYCO). WYCO owns a state regulated
intrastate gas pipeline extending from the Cheyenne Hub in northeast Colorado to Public Service Company of
Colorado’s (PSCo) Fort St. Vrain electric generation plant. WYCO also owns a compressor station on our WIC
system’s Medicine Bow lateral in Wyoming and leases these pipeline and compression facilities to PSCo and WIC,
respectively, under long-term leases.

Underground Natural Gas Storage Entities
     In addition to the storage capacity on our transmission systems, we own or have interests in the following
natural gas storage entities:
                                                                                              As of December 31, 2006
                                                                                              Ownership     Storage
                                                                                                           Capacity(1)
       Storage Entity                                                                           Interest                       Location
                                                                                               (Percent)      (Bcf)
       Bear Creek Storage . . . . . . . . . . . . . . . . . . . . . . . . . . . .     .....      100           58          Louisiana
       ANR Storage(2) . . . . . . . . . . . . . . . . . . . . . . . . . . . . . . .   .....      100           56          Michigan
       Blue Lake Gas Storage(2) . . . . . . . . . . . . . . . . . . . . . . . .       .....       75           47          Michigan
       Eaton Rapids Gas Storage(2)(3) . . . . . . . . . . . . . . . . . . . .         .....       50           13          Michigan
       Young Gas Storage(3) . . . . . . . . . . . . . . . . . . . . . . . . . . .     .....       48            6          Colorado
(1)
      Approximately 135 Bcf is contracted to affiliates. Amounts are not adjusted for our ownership interest.
(2)
      Sold in February 2007.
(3)
      This system is accounted for as an equity investment.

LNG Facility
     We own an LNG receiving terminal located on Elba Island, near Savannah, Georgia with a peak sendout
capacity of 1,215 MMcf/d and a base load sendout capacity of 806 MMcf/d. The capacity at the terminal is
contracted with subsidiaries of British Gas Group and Royal Dutch Shell PLC.

                                                                         4
Markets and Competition

     We provide natural gas services to a variety of customers, including natural gas producers, marketers, end-
users and other natural gas transmission, distribution and electric generation companies. In performing these
services, we compete with other pipeline service providers as well as alternative energy sources such as coal,
nuclear, wind, hydroelectric and fuel oil.

     Imported LNG is one of the fastest growing supply sectors of the natural gas market. Terminals and other
regasification facilities can serve as important sources of supply for pipelines, enhancing their delivery capabilities and
operational flexibility and complementing traditional supply transported into market areas. These LNG delivery
systems, however, may also compete with our pipelines for transportation of gas into the market areas we serve.

     Electric power generation is the fastest growing demand sector of the natural gas market. The growth of the
electric power industry potentially benefits the natural gas industry by creating more demand for natural gas turbine
generated electric power. This potential benefit is offset, in varying degrees, by increased generation efficiency, the
more effective use of surplus electric capacity, increased natural gas prices and the use and availability of other fuel
sources for power generation. In addition, in several regions of the country, new additions in electric generating
capacity have exceeded load growth and electric transmission capabilities out of those regions. These developments
may inhibit owners of new power generation facilities from signing firm contracts with pipelines.

      Our existing contracts mature at various times and in varying amounts of throughput capacity. Our ability to
extend our existing contracts or remarket expiring capacity is dependent on competitive alternatives, the regulatory
environment at the federal, state and local levels and market supply and demand factors at the relevant dates these
contracts are extended or expire. The duration of new or renegotiated contracts will be affected by current prices,
competitive conditions and judgments concerning future market trends and volatility. Subject to regulatory
requirements, we attempt to recontract or remarket our capacity at the rates allowed under our tariffs although,
at times, we discount these rates to remain competitive. The level of discount varies for each of our pipeline systems.
The table below shows the contracted capacity that expires by year over the next five years and thereafter.


                                                      Contract Expirations(1)


                                                                                            40%
                                                                                           12,615
                                  13,000
                                  12,000
                                  11,000
                                  10,000
                                   9,000
                         MDth/d


                                   8,000
                                   7,000
                                                                           15%
                                   6,000     13%       13%                 4,687
                                   5,000     4,055     3,926     10%                9%
                                   4,000                         3,032             2,656
                                   3,000
                                   2,000
                                   1,000
                                       0
                                             2007      2008      2009      2010    2011    Beyond
                                                                        Year
                         (1)
                                  Includes ANR sold in February 2007.

     The following table details information related to our customers, contracts, the markets we serve, and the
competition faced by each of our wholly owned pipeline transmission systems as of December 31, 2006. Our firm
customers reserve capacity on our pipeline system, storage facilities or LNG terminalling facilities and are
obligated to pay a monthly reservation or demand charge, regardless of the amount of natural gas they transport or

                                                                    5
store, for the term of their contracts. Interruptible customers are customers without reserved capacity that pay usage
charges based on the volume of gas actually transported, stored, injected or withdrawn.
TGP
Customer Information                                 Contract Information                               Competition
Approximately 460 firm and interruptible   Approximately 470 firm transportation        TGP faces competition in its northeast,
  customers, none of which individually    contracts. Weighted average remaining        Appalachian, midwest and southeast market
  represents more than 10 percent of       contract term of approximately four years.   areas. It competes with other interstate and
  revenues                                                                              intrastate pipelines for deliveries to
                                                                                        multiple-connection customers who can
                                                                                        take deliveries at alternative points. Natural
                                                                                        gas delivered on the TGP system competes
                                                                                        with alternative energy sources such as
                                                                                        electricity, hydroelectric power, coal and
                                                                                        fuel oil. In addition, TGP competes with
                                                                                        pipelines and gathering systems for
                                                                                        connection to new supply sources in Texas,
                                                                                        the Gulf of Mexico and from the Canadian
                                                                                        border.
                                                                                        In the offshore areas of the Gulf of Mexico,
                                                                                        factors such as the distance of the supply
                                                                                        fields from the pipeline, relative basis
                                                                                        pricing of the pipeline receipt points, and
                                                                                        costs of intermediate gathering or required
                                                                                        processing of the natural gas to be
                                                                                        transported may influence determinations of
                                                                                        whether natural gas is ultimately attached to
                                                                                        the TGP system.

ANR(1)
Customer Information                                 Contract Information                               Competition
Approximately 290 firm and                 Approximately 670 firm transportation        In its market areas, ANR competes directly
  interruptible customers                  contracts. Weighted average remaining        with Guardian Pipeline, for markets in
                                           contract term of approximately five years.   Wisconsin. ANR also competes directly
                                                                                        with other interstate pipelines in the
Major Customer:                                                                         northeast markets to serve electric
 We Energies                                                                            generation and local distribution companies.
    (799 BBtu/d)                           Expire in 2007-2016.                         In its supply areas, ANR competes directly
                                                                                        with numerous pipelines and gathering
                                                                                        systems for access to new supply sources.
                                                                                        ANR’s principal supply sources are the
                                                                                        Rockies and mid-continent production
                                                                                        accessed in Kansas and Oklahoma, western
                                                                                        Canadian production delivered to Wisconsin
                                                                                        and the Chicago area and Gulf of Mexico
                                                                                        sources, including deepwater production
                                                                                        and LNG imports.
(1)
      Sold in February 2007

EPNG
Customer Information                                                                                    Competition
                                                     Contract Information
Approximately 160 firm and                 Approximately 190 firm transportation        EPNG faces competition in the west and
  interruptible customers                  contracts. Weighted average remaining        southwest from other existing and proposed
                                           contract term of approximately four years.   pipelines, from California storage facilities,
                                                                                        and alternative energy sources that are used
Major Customers:                                                                        to generate electricity such as hydroelectric,
 Southern California Gas Company                                                        nuclear, wind, coal and fuel oil. In addition,
    (101 BBtu/d)                           Expires in 2007.                             construction of facilities to bring LNG into
    (187 BBtu/d)                           Expires in 2009.                             California and northern Mexico are
    (561 BBtu/d)                           Expire in 2010 - 2011.                       underway.

      Southwest Gas Corporation
        (11 BBtu/d)                        Expires in 2008.
        (476 BBtu/d)                       Expire in 2011 - 2015.


                                                                  6
SNG
Customer Information                                 Contract Information                              Competition
Approximately 274 firm and                 Approximately 200 firm transportation       SNG faces competition in a number of its
  interruptible customers                  contracts. Weighted average remaining       key markets. SNG competes with other
                                           contract term of approximately six years.   interstate and intrastate pipelines for
                                                                                       deliveries to multiple-connection customers
                                                                                       who can take deliveries at alternative
Major Customers:                                                                       points. Natural gas delivered on SNG’s
 Atlanta Gas Light Company                                                             system competes with alternative energy
     (959 BBtu/d)                          Expire in 2009-2015.                        sources used to generate electricity, such as
                                                                                       hydroelectric power, nuclear power, coal
   Southern Company Services                                                           and fuel oil. SNG’s four largest customers
     (418 BBtu/d)                          Expire in 2010-2018.                        are able to obtain a significant portion of
                                                                                       their natural gas requirements through
  Alabama Gas Corporation                                                              transportation from other pipelines. Also,
     (413 BBtu/d)                          Expire in 2010-2013.                        SNG competes with several pipelines for
                                                                                       the transportation business of their other
   Scana Corporation                                                                   customers. In addition, SNG competes with
    (316 BBtu/d)                           Expire in 2007-2019.                        pipelines and gathering systems for
                                                                                       connection to new supply services.

CIG
Customer Information                                 Contract Information                              Competition
Approximately 110 firm and interruptible   Approximately 170 firm transportation       CIG serves two major markets, an ‘‘on-
  customers                                contracts. Weighted average remaining       system” market and an ‘‘off-system”
                                           contract term of approximately six years.   market. Its ‘on-system‘ market consists of
                                                                                       utilities and other customers located along
                                                                                       the front range of the Rocky Mountains in
  Major Customers:                                                                     Colorado and Wyoming. Competitors in this
   Public Service Company of Colorado                                                  market consist of an intrastate pipeline, a
                                                                                       new interstate pipeline, local production
       (187 BBtu/d)                        Expires in 2008.                            from the Denver-Julesburg basin, and long-
       (9 BBtu/d)                          Expires in 2009.                            haul shippers who elect to sell into this
       (1,106 BBtu/d)                      Expire in 2012-2014.                        market rather than the off-system market.
                                                                                       CIG’s off- system market consists of the
                                                                                       transportation of Rocky Mountain
                                                                                       production from multiple supply basins to
                                                                                       interconnections with other pipelines bound
                                                                                       for the midwest, the southwest, California
      Williams Power Company                                                           and the Pacific northwest. Competition for
                                                                                       this off-system market consists of a new
       (30 BBtu/d)                         Expires in 2007.                            interstate pipeline and other existing
       (53 BBtu/d)                         Expires in 2009.                            interstate pipelines that are directly
       (348 BBtu/d)                        Expire in 2010 - 2013.                      connected to its supply sources.


    Anadarko Petroleum Corporation and
      subsidiaries

        (10 BBtu/d)                        Expires in 2007.
        (60 BBtu/d)                        Expires in 2008.
        (12 BBtu/d)                        Expires in 2009.
        (208 BBtu/d)                       Expire in 2010 - 2015.


                                                                  7
WIC
Customer Information                           Contract Information                               Competition
Approximately 50 firm and            Approximately 50 firm transportation          WIC competes with existing pipelines and
  interruptible customers            contracts. Weighted average remaining         a new interstate pipeline to provide
                                     contract term of approximately six years.     transportation services to pipeline
                                                                                   interconnects in northeast Colorado and
Major Customers:                                                                   western Wyoming.
 Williams Power Company
     (25 BBtu/d)                     Expires in 2008.
     (678 BBtu/d)                    Expire in 2010-2021.

Anadarko Petroleum Corporation and
  subsidiaries
     (25 BBtu/d)                     Expires in 2008.
     (385 BBtu/d)                    Expire in 2011-2017.


MPC
Customer Information                           Contract Information                               Competition
Approximately 20 firm and            Approximately six firm transportation         MPC faces competition from other existing
interruptible customers              contracts. Weighted average remaining         and proposed pipelines, and alternative
                                     contract term of approximately seven years.   energy sources that are used to generate
                                                                                   electricity such as hydroelectric, nuclear,
Major Customers:                                                                   wind, coal and fuel oil. In addition,
 Los Angeles Department of Water                                                   construction of facilities to bring LNG into
    and Power                                                                      California and northern Mexico are
    (50 BBtu/d)                      Expires in 2015.                              underway.

  EPNG
    (312 BBtu/d)

  Los Angeles Department of Water
    and Power
    (50 BBtu/d)                      Expires in 2007.


CPG
Customer Information                           Contract Information                               Competition
Approximately 30 firm and            Approximately 30 firm transportation          CPG competes directly with other interstate
interruptible customers              contracts. Weighted average remaining         pipelines serving the mid-continent region.
                                     contract term of approximately eight years.   Indirectly, CPG competes with pipelines
                                                                                   that are existing and currently under
                                                                                   construction to transport Rocky Mountain
Major Customers:                                                                   gas to other markets.
 Oneok Energy Services
    Company L.P.
    (195 BBtu/d)                     Expire in 2015.

  Encana Marketing
    (USA) Inc.
    (170 BBtu/d)                     Expire in 2015.

  Anadarko Petroleum Corporation
    (195 BBtu/d)                     Expire in 2015-2016.


                                                            8
Exploration and Production Segment
     Our Exploration and Production segment’s current business strategy focuses on the exploration for and the
acquisition, development and production of natural gas, oil and NGL in the United States, Brazil and Egypt. As of
December 31, 2006, we controlled over 2.9 million net leasehold acres. During 2006, daily equivalent natural gas
production averaged approximately 730 MMcfe/d and our proved natural gas and oil reserves at December 31,
2006, were approximately 2.4 Tcfe, excluding 0.2 Tcfe related to our unconsolidated investment in Four Star Oil &
Gas Company. We have a balanced portfolio of development and exploration projects, including long-lived and
shorter-lived properties divided into the following regions discussed below:


                                                   United States
      Onshore. The Onshore region includes operations that are primarily focused on unconventional tight gas
sands and coal bed methane producing areas, which are generally characterized by lower development costs, higher
drilling success rates and longer reserve lives. We have a large inventory of drilling prospects in this region. During
2006, we invested $500 million on capital projects and production averaged 345 MMcfe/d. The principal operating
areas are listed below:
                                                                                                2006
                                                                                                              Average
                                                                                 Net           Capital       Production
        Region                               Description                        Acres        Investment      (MMcfe/d)

East Texas/north          Concentrated land position primarily focused         104,000     $203 million         122
  Louisiana               on tight gas sands production in the Travis
  (Arklatex)              Peak/Hosston and Cotton Valley formations.
Black Warrior Basin       Established shallow coal bed methane                 172,000      $49 million          64
                          producing areas of northwestern Alabama.
                          We have high average working interests in
                          our operated properties in addition to an
                          average 50 percent working interest covering
                          approximately 46,000 net acres operated by
                          Black Warrior Methane which produces
                          from the Brookwood Field.
Mid-Continent             Primarily in Oklahoma with a focus on                319,000      $56 million          28
                          development projects in the Arkoma Basin
                          where we utilize horizontal drilling in the
                          Hartshorne Coals area, West Verdon field, an
                          oil producing waterflood project and shallow
                          natural gas production in the Hugoton field.
Rocky Mountain            Primarily in Wyoming and Utah with a                 364,000     $120 million          55
  (Rockies)               focus in the Powder River and Uintah
                          basins, consisting predominantly of operated
                          oil fields utilizing both primary and
                          secondary recovery methods combined with
                          non-operated coal bed methane fields. We
                          also operate the Altamont and Bluebell
                          processing plants and related gathering
                          systems in Utah.
Raton Basin               Primarily focused on coal bed methane                605,000      $72 million          76
                          production in northern New Mexico and
                          southern Colorado where we own the
                          minerals and have a 100 percent working
                          interest in the Vermejo Park Ranch.
    Included in our Mid-Continent region is our interest in 127,000 net acres in the Illinois Basin, primarily in the
New Albany Shale area in southwestern Indiana. We are the operator of these properties and maintain a 50 percent

                                                           9
working interest in this large emerging area which is still under evaluation. We have drilled 22 wells through the end
of 2006.
     Texas Gulf Coast. The Texas Gulf Coast region focuses on developing and exploring for tight gas sands in
south Texas. In this area, we have an inventory of over 10,000 square miles of three dimensional (3D) seismic data.
During 2006, we invested $217 million on capital projects and production averaged 187 MMcfe/d. The principal
operating areas are listed below:
                                                                                               2006
                                                                                                             Average
                                                                                              Capital       Production
         Region                              Description                      Net Acres     Investment      (MMcfe/d)

Vicksburg/Frio Trends     Includes concentrated and contiguous assets,        81,000      $111 million         123
                          located in south Texas, including the Jeffress
                          and Monte Christo fields primarily in
                          Hidalgo county, in which we have an
                          average 90 percent working interest.
Upper Gulf Coast          Located onshore Texas Gulf Coast,                   31,000       $60 million          32
  Wilcox                  including Renger, Dry Hollow and Speaks
                          fields in Lavaca County. In this area,
                          average well depth is between 13,000 to
                          18,000 feet.
South Texas Wilcox        Includes the Bob West and Roleta fields in          25,000       $29 million          27
                          Zapata County where in January 2007 we
                          completed the acquisition described below.
     In January 2007, we acquired operated producing properties and undeveloped acreage in Zapata County, Texas
with an average working interest of 85 percent. These properties complement our existing south Texas Wilcox
operations providing a re-entry into the Lobo trend and a multi-year drilling inventory with significant additional
exploration and development drilling opportunities. The 23,000 net acres acquired had production of approximately
12 MMcfe/d on the acquisition date. Estimated proved reserves at the acquisition date were approximately 84 Bcfe,
of which approximately 73 percent was undeveloped.
     Gulf of Mexico Shelf and south Louisiana. Our Gulf of Mexico shelf and south Louisiana operations are
generally characterized by relatively high initial production rates, resulting in near-term cash flows, and high
decline rates. During 2006, we invested $310 million on drilling, workover and facilities projects and production
averaged 174 MMcfe/d. The principal operating areas are listed below:
                                                                                               2006
                                                                                                             Average
                                                                                              Capital       Production
Region                                       Description                      Net Acres     Investment      (MMcfe/d)

Gulf of Mexico Shelf      Primarily deep shelf drilling interests in 173      688,000     $246 million         163
                          Blocks (generally nine square miles) south
                          of the Louisiana, Texas and Alabama
                          shorelines focused on deep (greater than
                          12,000 feet) gas reserves in relatively
                          shallow waters depths (less than 400 feet).
South Louisiana           Primarily in Vermillion Parish and                   34,000      $64 million          11
                          associated bays and waters in southwestern
                          Louisiana covered by the Catapult 3D
                          seismic project. We have internally
                          processed 2,600 square miles of contiguous
                          3D seismic data in this project.


                                                           10
Unconsolidated Investment in Four Star. We own a 43.1 percent investment in Four Star. Four Star operates
onshore in the San Juan, Permian, Hugoton and South Alabama Basins and the Gulf of Mexico. During 2006, our
proportionate share of Four Star’s daily equivalent natural gas production averaged approximately 68 MMcfe/d and
at December 31, 2006, proved natural gas and oil reserves, net to our interest, were 222 Bcfe. In January 2007, Four
Star acquired 79 wells in the San Juan basin that had daily production of approximately 5 MMcfe/d and proved
reserves of 16 Bcfe, net to our interest, on the acquisition date.

                                                    International
     Brazil. Our Brazil operations cover approximately 361,000 net acres. These operations include interests in
13 concessions located in the Espirito Santo, Potiguar and Camamu Basins, including our 35 percent working
interest in the Pescada Arabaiana Fields in the Potiguar Basin. In 2006, we invested $80 million in capital projects in
Brazil and production averaged approximately 24 MMcfe/d from the Pescada Arabaiana Fields.
     Egypt. Our Egypt operations include a 20 percent non-operated working interest in approximately 13,000 net
acres in the South Feiran concession located in the Gulf of Suez, which is in the seismic, exploratory drilling and
evaluation phases of the project. Our total funding commitment to the South Feiran concession is $3 million. In
addition, we were the winning bidder of the South Mariut Block in the second quarter of 2006 with a $3 million
payment due on final receipt of the concession and an agreement for a $22 million firm working commitment over
three years. The block is approximately 1.2 million acres and is located onshore in the western part of the Nile Delta.
We expect to receive formal governmental approvals and sign the concession agreement during the first quarter of
2007.


                                                          11
Natural Gas and Oil Properties


Natural Gas, Oil and Condensate and NGL Reserves and Production

     The table below presents our estimated proved reserves based on our internal reserve report as of December 31,
2006 by region and classification as well as our 2006 production by region. Net proved reserves exclude royalties
and interests owned by others and reflect contractual arrangements and royalty obligations in effect at the time of
the estimate.:
                                                                         Net Proved Reserves
                                                                                                                            2006
                                                                                                       Total
                                                  Natural Gas   Oil/Condensate    NGL                                    Production
                                                    (MMcf)          (MBbls)      (MBbls)        (MMcfe)      (Percent)    (MMcfe)

Reserves and Production by
  Region
United States
  Onshore . . . . . . . . . . . . . . . . .       1,308,742        28,947          1,060       1,488,789         62%     126,093
  Texas Gulf Coast . . . . . . . . . .              344,596         2,265          8,004         406,209         17%      68,269
  Gulf of Mexico Shelf and
     south Louisiana . . . . . . . . . .            209,897         9,467            948        272,384          11%       63,537
  Total United States . . . . . . . . .           1,863,235        40,679         10,012       2,167,382         90%     257,899
Brazil. . . . . . . . . . . . . . . . . . . . .      56,383        31,847             —          247,466         10%       8,619
   Total . . . . . . . . . . . . . . . . . . .    1,919,618        72,526         10,012       2,414,848       100%      266,518
Unconsolidated investment in
  Four Star . . . . . . . . . . . . . . . .         167,046         2,947          6,209        221,984        100%        24,663

Reserves by Classification
United States
  Producing . . . . . . . . . . . . . . . .       1,251,019        22,415          7,402       1,429,923         66%
  Non-Producing . . . . . . . . . . . .             217,881         7,201          1,263         268,665         12%
  Undeveloped. . . . . . . . . . . . . .            394,335        11,063          1,347         468,794         22%
      Total proved . . . . . . . . . . . .        1,863,235        40,679         10,012       2,167,382       100%
Brazil
  Producing . . . . . . . . . . . . . . . .          19,931           489             —          22,864           9%
  Non-Producing . . . . . . . . . . . .               3,405           335             —           5,418           2%
  Undeveloped. . . . . . . . . . . . . .             33,047        31,023             —         219,184          89%
      Total proved . . . . . . . . . . . .           56,383        31,847             —         247,466        100%
Worldwide
 Producing . . . . . . . . . . . . . . . .        1,270,950        22,904          7,402       1,452,787         60%
 Non-Producing . . . . . . . . . . . .              221,286         7,536          1,263         274,083         11%
 Undeveloped. . . . . . . . . . . . . .             427,382        42,086          1,347         687,978         29%
      Total proved . . . . . . . . . . . .        1,919,618        72,526         10,012       2,414,848       100%
Unconsolidated investment in
  Four Star
  Producing . . . . . . . . . . . . . . . .         136,489         2,874          5,068        184,140          83%
  Non-Producing . . . . . . . . . . . .               2,733            —              26          2,892           1%
  Undeveloped. . . . . . . . . . . . . .             27,824            73          1,115         34,952          16%
      Total Four Star . . . . . . . . . .           167,046         2,947          6,209        221,984        100%

                                                                    12
Our consolidated reserves in the table above are consistent with estimates of reserves filed with other federal
agencies except for differences of less than five percent resulting from actual production, acquisitions, property
sales, necessary reserve revisions and additions to reflect actual experience.
     Ryder Scott Company, L.P. (Ryder Scott), an independent reservoir engineering firm that reports to the Audit
Committee of our Board of Directors, prepared an estimate on 84 percent of our consolidated natural gas and oil
reserves. Additionally, Ryder Scott prepared an estimate of 80 percent of the proved reserves of Four Star, our
unconsolidated affiliate. Our estimates of Four Star’s proved natural gas and oil reserves are prepared by our internal
reservoir engineers and do not reflect those prepared by the engineers of Four Star. Based on the amount of proved
reserves determined by Ryder Scott, we believe our reported reserve amounts are reasonable. Ryder Scott’s reports
are included as exhibits to this Annual Report on Form 10-K.
      There are numerous uncertainties inherent in estimating quantities of proved reserves, projecting future rates
of production costs, and projecting the timing of development expenditures, including many factors beyond our
control. Reservoir engineering is a subjective process of estimating underground accumulations of natural gas and
oil that cannot be measured in an exact manner. The reserve data represents only estimates which are often different
from the quantities of natural gas and oil that are ultimately recovered. The accuracy of any reserve estimate is
highly dependent on the quality of available data, the accuracy of the assumptions on which they are based, and on
engineering and geological interpretations and judgment.
      All estimates of proved reserves are determined according to the rules prescribed by the SEC. These rules
indicate that the standard of “reasonable certainty” be applied to proved reserve estimates. This concept of
reasonable certainty implies that as more technical data becomes available, a positive, or upward, revision is more
likely than a negative, or downward, revision. Estimates are subject to revision based upon a number of factors,
including reservoir performance, prices, economic conditions and government restrictions. In addition, results of
drilling, testing and production subsequent to the date of an estimate may justify revision of that estimate.
     In general, the volume of production from natural gas and oil properties we own declines as reserves are
depleted. Except to the extent we conduct successful exploration and development activities or acquire additional
properties containing proved reserves, or both, our proved reserves will decline as reserves are produced. Recovery
of proved undeveloped reserves requires significant capital expenditures and successful drilling operations. The
reserve data assumes that we can and will make these expenditures and conduct these operations successfully, but
future events, including commodity price changes, may cause these assumptions to change. In addition, estimates of
proved undeveloped reserves and proved non-producing reserves are subject to greater uncertainties than estimates
of proved producing reserves. For further discussion of our reserves, see Part II, Item 8, Financial Statements and
Supplementary Data, under the heading Supplemental Natural Gas and Oil Operations.

Acreage and Wells
     The following tables detail (i) our interest in developed and undeveloped acreage at December 31, 2006, (ii) our
interest in natural gas and oil wells at December 31, 2006 and (iii) our exploratory and development wells drilled
during the years 2004 through 2006. Any acreage in which our interest is limited to owned royalty, overriding
royalty and other similar interests is excluded.
                                                                            Developed            Undeveloped                     Total
                                                                        Gross(1)    Net(2)    Gross(1)    Net(2)      Gross(1)           Net(2)
Acreage
United States
  Onshore . . . . . . . . . . . . . . . . . . . . . . . . . . . .       874,525     556,828 1,612,025 1,135,010 2,486,550           1,691,838
  Texas Gulf Coast. . . . . . . . . . . . . . . . . . . . . .            93,573      73,373    91,230    63,452   184,803             136,825
  Gulf of Mexico Shelf and south Louisiana . . . .                      508,716     359,064   401,075   363,046   909,791             722,110
    Total . . . . . . . . . . . . . . . . . . . . . . . . . . . .      1,476,814    989,265 2,104,330 1,561,508 3,581,144           2,550,773
Brazil . . . . . . . . . . . . . . . . . . . . . . . . . . . . . . .      49,262     17,242 1,158,643   343,563 1,207,905             360,805
Egypt . . . . . . . . . . . . . . . . . . . . . . . . . . . . . . .           —          —     64,740    12,948    64,740              12,948
      Worldwide Total . . . . . . . . . . . . . . . . . . . .          1,526,076 1,006,507   3,327,713   1,918,019   4,853,789      2,924,526


                                                                              13
In the United States, our net developed acreage is concentrated primarily in the Gulf of Mexico (36 percent),
Utah (13 percent), Texas (9 percent), Alabama (9 percent), New Mexico (9 percent), Oklahoma (8 percent) and
Louisiana (7 percent). Our net undeveloped acreage is concentrated primarily in New Mexico (31 percent), the
Gulf of Mexico (22 percent), Wyoming (10 percent), West Virginia (8 percent), Indiana (7 percent), Alabama
(5 percent), Texas (4 percent) and Louisiana (3 percent). Approximately 23 percent, 20 percent and 8 percent of our
total United States net undeveloped acreage is held under leases that have minimum remaining primary terms
expiring in 2007, 2008 and 2009. Approximately 16 percent, 25 percent and 12 percent of our total Brazilian net
undeveloped acreage is held under leases that have minimum remaining primary terms expiring in 2007, 2008 and
2009. Approximately 33 percent of our total Egyptian net undeveloped acreage is held under leases that have
minimum remaining primary terms expiring in 2008. We employ various techniques to manage the expiration of
leases, including extending lease terms, drilling the acreage ourselves, or through farm-out agreements with other
operators.
                                                                                                                                       Wells Being
                                                                                                                                        Drilled at
                                                                                                                                      December 31,
                                                           Natural Gas                     Oil                       Total                 2006
                                                         Gross(1)  Net(2)           Gross(1)   Net(2)         Gross(1)   Net(2)(3)   Gross(1)   Net(2)
Productive Wells
United States
  Onshore . . . . . . . . .      ...   ........           3,880         2,954          801          548        4,681       3,502       52          38
  Texas Gulf Coast . . .         ...   ........             843           703           —            —           843         703        6           5
  Gulf of Mexico Shelf           and   south
     Louisiana . . . . . . .     ...   ........              187          122            58           40          245        162        6          4
    Total . . . . . . . . . . . . . . . . . . . . .       4,910         3,779          859          588        5,769       4,367       64          47
Brazil . . . . . . . . . . . . . . . . . . . . . . . .        4             1            6            2           10           3       —           —
      Worldwide Total . . . . . . . . . . . . .           4,914         3,780          865          590        5,779       4,370       64          47


                                                                                                             Net Exploratory(2)       Net Development(2)
                                                                                                            2006   2005    2004      2006   2005    2004
Wells Drilled
United States
  Productive . . . . . . . . . . . . . . . . . . . . . . . . . . . . . . . . . . . . . . . . . . . . .      106      86      13      319     279        298
  Dry . . . . . . . . . . . . . . . . . . . . . . . . . . . . . . . . . . . . . . . . . . . . . . . . . .     6       2      10        2       4          3
      Total . . . . . . . . . . . . . . . . . . . . . . . . . . . . . . . . . . . . . . . . . . . . . . .   112      88      23      321     283        301
Brazil
  Productive . . . . . . . . . . . . . . . . . . . . . . . . . . . . . . . . . . . . . . . . . . . . .       —       —       —        —       —          —
  Dry . . . . . . . . . . . . . . . . . . . . . . . . . . . . . . . . . . . . . . . . . . . . . . . . . .    —       —       1        —       —          —
      Total . . . . . . . . . . . . . . . . . . . . . . . . . . . . . . . . . . . . . . . . . . . . . . .    —       —         1      —       —          —
Worldwide
 Productive . . . . . . . . . . . . . . . . . . . . . . . . . . . . . . . . . . . . . . . . . . . . .       106      86      13      319     279        298
 Dry . . . . . . . . . . . . . . . . . . . . . . . . . . . . . . . . . . . . . . . . . . . . . . . . . .      6       2      11        2       4          3
      Total . . . . . . . . . . . . . . . . . . . . . . . . . . . . . . . . . . . . . . . . . . . . . . .   112      88      24      321     283        301

(1)
      Gross interest reflects the total acreage or wells we participated in, regardless of our ownership interest in the acreage or
      wells.
(2)
      Net interest is the aggregate of the fractional working interests that we have in the gross acreage, gross wells or gross wells
      drilled.
(3)
      At December 31, 2006, we operated 3,957 of the 4,370 net productive wells.

      The drilling performance above should not be considered indicative of future drilling performance, nor should
it be assumed that there is any correlation between the number of productive wells drilled and the amount of natural
gas and oil that may ultimately be recovered.

                                                                                  14
Net Production, Sales Prices, Transportation and Production Costs
     The following table details our net production volumes, average sales prices received, average transportation
costs and average production costs (including production taxes) associated with the sale of natural gas and oil for
each of the three years ended December 31:
                                                                                                 2006         2005          2004

     Consolidated Volumes, Prices, and Costs per Unit:
     Net Production Volumes
       United States
         Natural gas (MMcf) . . . . . . . . . . . . . . . . . . . .        .........         213,262      206,714          238,009
         Oil, condensate and NGL (MBbls) . . . . . . . . .                 .........           7,439        7,516            8,498
               Total (MMcfe) . . . . . . . . . . . . . . . . . . . . .     .........         257,899      251,807          288,994
       Brazil(1)
         Natural gas (MMcf) . . . . . . . . . . . . . . . . . . . .        .........              7,140       15,578         6,848
         Oil, condensate and NGL (MBbls) . . . . . . . . .                 .........                247          620           320
               Total (MMcfe) . . . . . . . . . . . . . . . . . . . . .     .........              8,619       19,300         8,772
       Worldwide
         Natural gas (MMcf) . . . . . . . . . . . . . . . . . . . .        .........         220,402      222,292          244,857
         Oil, condensate and NGL (MBbls) . . . . . . . . .                 .........           7,686        8,136            8,818
               Total (MMcfe) . . . . . . . . . . . . . . . . . . . . .     .........         266,518      271,107          297,766
               Total (MMcfe/d) . . . . . . . . . . . . . . . . . . .       .........             730          743              814
     Natural Gas Average Realized Sales Price ($/Mcf)
       United States
         Excluding hedges . . . . . . . . . . . . . . . . . . . . . .      ......... $             6.77   $     7.92   $      6.02
         Including hedges . . . . . . . . . . . . . . . . . . . . . . .    ......... $             6.50   $     6.69   $      5.94
       Brazil
         Excluding hedges . . . . . . . . . . . . . . . . . . . . . .      ......... $             2.61   $     2.33   $      2.01
         Including hedges . . . . . . . . . . . . . . . . . . . . . . .    ......... $             2.61   $     2.33   $      2.01
       Worldwide
         Excluding hedges . . . . . . . . . . . . . . . . . . . . . .      ......... $             6.64   $     7.53   $      5.90
         Including hedges . . . . . . . . . . . . . . . . . . . . . . .    ......... $             6.38   $     6.39   $      5.83
     Oil, Condensate, and NGL Average Realized Sales Price ($/Bbl)
       United States
          Excluding hedges . . . . . . . . . . . . . . . . . . . . . . . . . . . . . . .     $    55.95   $    45.86   $     34.44
          Including hedges . . . . . . . . . . . . . . . . . . . . . . . . . . . . . . . .   $    55.95   $    45.86   $     34.44
       Brazil
          Excluding hedges . . . . . . . . . . . . . . . . . . . . . . . . . . . . . . .     $    64.02   $    53.42   $     43.01
          Including hedges . . . . . . . . . . . . . . . . . . . . . . . . . . . . . . . .   $    54.48   $    42.42   $     39.19
       Worldwide
          Excluding hedges . . . . . . . . . . . . . . . . . . . . . . . . . . . . . . .     $    56.21   $    46.43   $     34.75
          Including hedges . . . . . . . . . . . . . . . . . . . . . . . . . . . . . . . .   $    55.90   $    45.60   $     34.61
     Average Transportation Cost
       United States
         Natural gas ($/Mcf) . . . . . . . . . . . . . . . . . . . .       ......... $             0.24   $     0.20   $      0.17
         Oil, condensate and NGL ($/Bbl) . . . . . . . . . .               ......... $             0.85   $     0.69   $      1.16
       Worldwide
         Natural gas ($/Mcf) . . . . . . . . . . . . . . . . . . . .       ......... $             0.23   $     0.18   $      0.17
         Oil, condensate and NGL ($/Bbl) . . . . . . . . . .               ......... $             0.82   $     0.63   $      1.12
     Average Production Cost($/Mcfe)(2)
       United States
         Average lease operating cost . . . . . . . . . . . . . . . . . . . . . . . $              0.97   $     0.73   $      0.62
         Average production taxes . . . . . . . . . . . . . . . . . . . . . . . . .                0.28         0.27          0.11
              Total production cost . . . . . . . . . . . . . . . . . . . . . . . . . $            1.25   $     1.00   $      0.73


                                                                      15
2006                 2005               2004

           Brazil
             Average lease operating cost . . . . . . . . . . . . . . . . . . . . . . . $                   0.28         $      0.42         $          —
             Average production taxes . . . . . . . . . . . . . . . . . . . . . . . . .                     0.53                  —                     —
                  Total production cost . . . . . . . . . . . . . . . . . . . . . . . . . $                 0.81         $      0.42         $          —
           Worldwide
            Average lease operating cost . . . . . . . . . . . . . . . . . . . . . . . $                    0.95         $      0.72         $     0.60
            Average production taxes . . . . . . . . . . . . . . . . . . . . . . . . .                      0.29                0.24               0.11
                 Total production cost . . . . . . . . . . . . . . . . . . . . . . . . . $                  1.24         $      0.96         $     0.71

        Unconsolidated affiliate volumes (Four Star)(3)
              Natural gas (MMcf) . . . . . . . . . . . . . . . . . .              .........              18,140                6,689
              Oil, condensate and NGL (MBbls) . . . . . . . .                     .........               1,087                  359
                 Total equivalent volumes
                 MMcfe . . . . . . . . . . . . . . . . . . . . . . . . . .        .........              24,663                8,844
                 MMcfe/d . . . . . . . . . . . . . . . . . . . . . . . . .        .........                  68                   24
(1)
      Production volumes in Brazil decreased due to a contractual reduction of our ownership interest in the Pescada-Arabaiana Field in 2006.
(2)
      Production cost includes lease operating costs and production related taxes (including ad valorem and severance taxes).
(3)
      Includes our proportionate share of volumes in Four Star which was acquired in the third quarter of 2005.

Acquisition, Development and Exploration Expenditures
     The following table details information regarding the costs incurred in our acquisition, development and
exploration activities for each of the three years ended December 31:
                                                                                                                       2006         2005           2004
                                                                                                                               (In millions)
        United States
          Acquisition Costs:
             Proved . . . . . . . . . . . . . . . . . . . . . . . . . . . . . . . . . . . . . . . . . . . . . .    $      2          $ 643        $ 33
             Unproved . . . . . . . . . . . . . . . . . . . . . . . . . . . . . . . . . . . . . . . . . . . .            34            143          32
          Development Costs . . . . . . . . . . . . . . . . . . . . . . . . . . . . . . . . . . . . . .                 738            503         395
          Exploration Costs:
             Delay rentals . . . . . . . . . . . . . . . . . . . . . . . . . . . . . . . . . . . . . . . . .              6                 3        7
             Seismic acquisition and reprocessing . . . . . . . . . . . . . . . . . . . . . . . .                        23                 7       29
             Drilling . . . . . . . . . . . . . . . . . . . . . . . . . . . . . . . . . . . . . . . . . . . . .         294               133      149
          Asset Retirement Obligations . . . . . . . . . . . . . . . . . . . . . . . . . . . . . . .                      3                 1       30
              Total full cost pool expenditures . . . . . . . . . . . . . . . . . . . . . . . . . . .               1,100                1,433     675
              Non-full cost pool expenditures. . . . . . . . . . . . . . . . . . . . . . . . . . . .                    8                   22      11
                  Total cost incurred(1) . . . . . . . . . . . . . . . . . . . . . . . . . . . . . . . . . .       $1,108            $1,455       $686
                                                                                       (1)
           Acquisition of unconsolidated investment in Four Star                             ...........           $     —           $ 769        $—
        Brazil and Other International
          Acquisition Costs:
            Proved . . . . . . . . . . . . . . . . . . . . . . . . . . . . . . . . . . . . . . . . . . . . . .     $      2          $      8     $ 69
            Unproved . . . . . . . . . . . . . . . . . . . . . . . . . . . . . . . . . . . . . . . . . . . .              1                 1        3
          Development Costs . . . . . . . . . . . . . . . . . . . . . . . . . . . . . . . . . . . . . .                  40                 6        1
          Exploration Costs:
            Seismic acquisition and reprocessing . . . . . . . . . . . . . . . . . . . . . . . .                          7                 7           15
            Drilling . . . . . . . . . . . . . . . . . . . . . . . . . . . . . . . . . . . . . . . . . . . . .           46                 8           10

                                                                             16
2006        2005       2004
                                                                                                                           (In millions)
          Asset Retirement Obligations . . . . . . . . . . . . . . . . . . . . . . . . . . . . . . .                  —             —         3
             Total full cost pool expenditures . . . . . . . . . . . . . . . . . . . . . . . . . . .                  96            30     101
             Non-full cost pool expenditures. . . . . . . . . . . . . . . . . . . . . . . . . . . .                   —             —        3
                 Total cost incurred . . . . . . . . . . . . . . . . . . . . . . . . . . . . . . . . . . .      $     96      $     30     $104
       Worldwide
        Acquisition Costs:
           Proved . . . . . . . . . . . . . . . . . . . . . . . . . . . . . . . . . . . . . . . . . . . . . .   $      4      $ 651        $102
           Unproved . . . . . . . . . . . . . . . . . . . . . . . . . . . . . . . . . . . . . . . . . . . .           35        144          35
        Development Costs . . . . . . . . . . . . . . . . . . . . . . . . . . . . . . . . . . . . . .                778        509         396
        Exploration Costs:
           Delay rentals . . . . . . . . . . . . . . . . . . . . . . . . . . . . . . . . . . . . . . . . .             6             3       7
           Seismic acquisition and reprocessing . . . . . . . . . . . . . . . . . . . . . . . .                       30            14      44
           Drilling . . . . . . . . . . . . . . . . . . . . . . . . . . . . . . . . . . . . . . . . . . . . .        340           141     159
        Asset Retirement Obligations . . . . . . . . . . . . . . . . . . . . . . . . . . . . . . .                     3             1      33
             Total full cost pool expenditures . . . . . . . . . . . . . . . . . . . . . . . . . . .             1,196            1,463    776
             Non-full cost pool expenditures. . . . . . . . . . . . . . . . . . . . . . . . . . . .                  8               22     14
                 Total cost incurred(1) . . . . . . . . . . . . . . . . . . . . . . . . . . . . . . . . . .     $1,204        $1,485       $790
                                                                                     (1)
          Acquisition of unconsolidated investment in Four Star                            ...........          $     —       $ 769        $—

(1)
      In 2005, amount includes $179 million of deferred income tax adjustments related to the acquisition of full-cost pool properties and
      $217 million related to the acquisition of our unconsolidated investment in Four Star.

    We spent approximately $192 million in 2006, $247 million in 2005 and $156 million in 2004 to develop
proved undeveloped reserves that were included in our reserve report as of January 1 of each year.

Markets and Competition
      We primarily sell our domestic natural gas and oil to third parties through our Marketing segment at spot
market prices, subject to customary adjustments. We sell our NGL at market prices under monthly or long-term
contracts, subject to customary adjustments. In Brazil, we sell the majority of our natural gas and oil to Petrobras,
Brazil’s state-owned energy company. We also enter into derivative contracts on our natural gas and oil production
to stabilize our cash flows, reduce the risk and financial impact of downward commodity price movements and to
protect the economic assumptions associated with our capital investment programs. As of December 31, 2006, we
had entered into derivative contracts on approximately 133,000 BBtu of our anticipated natural gas production in
2007 and approximately 21,000 BBtu of our total anticipated natural gas production from 2008 through 2012. We
also have derivative contracts on our Brazilian oil production that provides us with a fixed price on approximately
192 MBbls in 2007. For a further discussion of these contracts, see Part II, Item 7, Management’s Discussion and
Analysis of Financial Condition and Results of Operations. Our Marketing segment has also entered into additional
production related derivative contracts as further described below.
     The exploration and production business is highly competitive in the search for and acquisition of additional
natural gas and oil reserves and in the sale of natural gas, oil and NGL. Our competitors include major and
intermediate sized natural gas and oil companies, independent natural gas and oil operators and individual
producers or operators with varying scopes of operations and financial resources. Competitive factors include price
and contract terms, our ability to access drilling and other equipment and our ability to hire and retain skilled
personnel on a timely and cost effective basis. Ultimately, our future success in the exploration and production
business will be dependent on our ability to find or acquire additional reserves at costs that yield acceptable returns
on the capital invested.

                                                                           17
Marketing Segment
     Our Marketing segment’s primary focus is to market our Exploration and Production segment’s natural gas and
oil production and to manage the company’s overall price risk, primarily through the use of natural gas and oil
derivative contracts. In addition, we continue to manage and liquidate various natural gas supply, transportation,
power and other natural gas related contracts remaining from our historical trading activities, which were primarily
entered into prior to the deterioration of the energy trading environment in 2002. As of December 31, 2006, we
managed the following types of contacts:
       • Production-Related Natural Gas and Oil Derivatives. Includes options that provide price protection on our
         Exploration and Production segment’s natural gas and oil production.
       • Natural Gas Transportation-Related Contracts. Includes contracts that provide transportation capacity
         primarily with our affiliates.
       • Historical Natural Gas and Power Contracts. Includes supply agreements with Midland Cogeneration
         Venture and power contracts in the Pennsylvania-New Jersey-Maryland region.

Production-Related Natural Gas and Oil Derivatives
      Our natural gas and oil contracts include options designed to provide price protection to El Paso from
fluctuations in natural gas and oil prices. These contracts are in addition to contracts entered into by our Exploration
and Production segment described on page 12. For a further discussion of the entirety of El Paso’s production-
related price risk management activities, refer to our liquidity discussion beginning on page 62. As of December 31,
2006, Marketing’s contracts provided El Paso with price protection on the following quantities of future natural gas
and oil production:
                                                                                                                      2007      2008     2009

       Natural Gas (TBtu)
         Volumes with floor price . . . . . . . . . . . . . . . . . . . . . . . . . . . . . . . . . . . . . . . . .      89       18      17
         Volumes with ceiling price . . . . . . . . . . . . . . . . . . . . . . . . . . . . . . . . . . . . . . .        —        18      17
       Oil (MBbls)
         Volumes with floor and ceiling prices . . . . . . . . . . . . . . . . . . . . . . . . . . . . . . .          1,009      930      —

Contracts Related to Historical Trading Operations
     Natural gas transportation-related contracts. Our transportation contracts give us the right to transport
natural gas using pipeline capacity for a fixed reservation charge plus variable transportation costs. We typically
refer to the fixed reservation cost as a demand charge. Our ability to utilize our transportation capacity under these
contracts is dependent on several factors, including the difference in natural gas prices at receipt and delivery
locations along the pipeline system, the amount of working capital needed to use this capacity and the capacity
required to meet our other long-term obligations. The following table details our transportation contracts as of
December 31, 2006:
                                                                                                     Affiliated Pipelines(1)
                                                                            Alliance Pipeline                                  Other Pipelines

       Daily capacity (MMBtu/d). . . . . . . . . . . . . . .              160,000                    521,000                   156,000
                                                                          October 31, 2007(2)
       Expiration . . . . . . . . . . . . . . . . . . . . . . . . . . .                              2008 to 2028              2007 to 2026
       Receipt points . . . . . . . . . . . . . . . . . . . . . . . .     AECO Canada                Various                   Various
       Delivery points . . . . . . . . . . . . . . . . . . . . . . .      Chicago                    Various                   Various
(1)
      Primarily consists of contracts with TGP and EPNG.
(2)
      In December 2006, we paid a third party to assume our capacity obligations under this contract beginning November 1, 2007 through the
      contractual term of the contract which ends in 2015.

     Other natural gas contracts. As of December 31, 2006, we had a variety of natural gas derivative contracts
and long-term gas supply obligations, including ten significant physical natural gas contracts with power plants
associated with our historical trading activities. These contracts obligate us to sell gas to these plants and have

                                                                          18
various expiration dates ranging from 2008 to 2028, with expected obligations under individual contracts with third
parties ranging from 21,500 to 130,000 MMBtu/d.
      Power contracts. As of December 31, 2006, we had four derivative contracts that require us to swap locational
differences in power prices between four power plants in the Pennsylvania-New Jersey-Maryland (PJM) eastern
region with the PJM west hub. In total, these contracts require us annually to swap locational differences in power
prices on approximately 4,000 GWh of power through 2008, 3,700 GWh from 2009 to 2013 and 1,700 GWh from
2014 to 2016. Additionally, these contracts require us to provide installed capacity of approximately 71 GWh in the
PJM power pool through 2016. While we have basis and capacity risk associated with the contracts, we do not have
commodity risk associated with these contracts due to positions we put in place in 2005 and 2006.

Markets and Competition
     Our Marketing segment operates in a highly competitive environment, competing on the basis of price,
operating efficiency, technological advances, experience in the marketplace and counterparty credit. Each market
served is influenced directly or indirectly by energy market economics. Our primary competitors include:
        • Major oil and natural gas producers and their affiliates;
        • Large domestic and foreign utility companies;
        • Large local distribution companies and their affiliates;
        • Other interstate and intrastate pipelines and their affiliates; and
        • Independent energy marketers and power producers with varying scopes of operations and financial
          resources.

Power Segment
      As of December 31, 2006, our Power segment primarily included the ownership and operation of investments
in international power generation facilities listed in the table below. These facilities primarily sell power under long-
term power purchase agreements with power transmission and distribution companies owned by local governments.
As a result, we are subject to certain political risks related to these facilities. We currently expect to complete the
sale of substantially all of the Asian and Central American facilities in the first half of 2007.
                                                       El Paso                                              Expiration
                                                     Ownership     Gross                                  Year of Power
Project                                   Area         Interest   Capacity         Power Purchaser        Sales Contracts         Fuel Type
                                                      (Percent)    (MW)
Brazil
  Manaus(1) . . . . . . . .      ..         Brazil      100         238        Manaus Energia                    2008       Oil
  Porto Velho(2) . . . . . .     ..         Brazil       50         404        Eletronorte                    2010, 2023    Oil
  Rio Negro(1) . . . . . . .     ..         Brazil      100         158        Manaus Energia                    2008       Oil
Asia & Central America
  Habibullah . . . . . . . .     .   .   Pakistan        50         136        Pakistan Water and Power         2029        Natural Gas
  Saba Power Co. . . . .         .   .   Pakistan        94         128        Pakistan Water and Power         2029        Residual Fuel Oil
  Khulna Power Co. . .           .   . Bangladesh        74         113        BPDB                             2013        Heavy Fuel Oil
  Tipitapa . . . . . . . . . .   .   .  Nicaragua        60          51        Union Fenosa                     2014        Heavy Fuel Oil

(1)
      Ownership of these plants will transfer to the power purchaser no later than January 2008.
(2)
      The power purchaser has approached us with the opportunity to sell them our interest in the facility.

     In addition to the international power plants above, we also have investments in two operating pipelines in
South America with a total design capacity and average 2006 throughput of 1,197 MMcf/d and 1,037 BBtu/d,
unadjusted for our ownership interest. We also have an interest in a pipeline project in Brazil that is in the
development stage.

Regulatory Environment
    Pipelines. Our interstate natural gas transmission systems and storage operations are regulated by the FERC
under the Natural Gas Act of 1938, the Natural Gas Policy Act of 1978 and the Energy Policy Act of 2005. Each of

                                                                          19
EP10K
EP10K
EP10K
EP10K
EP10K
EP10K
EP10K
EP10K
EP10K
EP10K
EP10K
EP10K
EP10K
EP10K
EP10K
EP10K
EP10K
EP10K
EP10K
EP10K
EP10K
EP10K
EP10K
EP10K
EP10K
EP10K
EP10K
EP10K
EP10K
EP10K
EP10K
EP10K
EP10K
EP10K
EP10K
EP10K
EP10K
EP10K
EP10K
EP10K
EP10K
EP10K
EP10K
EP10K
EP10K
EP10K
EP10K
EP10K
EP10K
EP10K
EP10K
EP10K
EP10K
EP10K
EP10K
EP10K
EP10K
EP10K
EP10K
EP10K
EP10K
EP10K
EP10K
EP10K
EP10K
EP10K
EP10K
EP10K
EP10K
EP10K
EP10K
EP10K
EP10K
EP10K
EP10K
EP10K
EP10K
EP10K
EP10K
EP10K
EP10K
EP10K
EP10K
EP10K
EP10K
EP10K
EP10K
EP10K
EP10K
EP10K
EP10K
EP10K
EP10K
EP10K
EP10K
EP10K
EP10K
EP10K
EP10K
EP10K
EP10K
EP10K
EP10K
EP10K
EP10K
EP10K
EP10K
EP10K
EP10K
EP10K
EP10K
EP10K
EP10K
EP10K
EP10K
EP10K
EP10K
EP10K
EP10K
EP10K
EP10K
EP10K
EP10K
EP10K
EP10K
EP10K
EP10K
EP10K
EP10K
EP10K
EP10K
EP10K
EP10K
EP10K

Mais conteúdo relacionado

Mais procurados

comcast Annual Report on Form 10-K —2006
comcast Annual Report on Form 10-K  —2006comcast Annual Report on Form 10-K  —2006
comcast Annual Report on Form 10-K —2006finance8
 
el paso 2007_EP10K
el paso 2007_EP10Kel paso 2007_EP10K
el paso 2007_EP10Kfinance49
 
EPC2005AnnualReportForm10K
EPC2005AnnualReportForm10KEPC2005AnnualReportForm10K
EPC2005AnnualReportForm10Kfinance49
 
usg AR_10K2005
usg AR_10K2005usg AR_10K2005
usg AR_10K2005finance40
 
whole food market 2006_10K
whole food market 2006_10Kwhole food market 2006_10K
whole food market 2006_10Kfinance44
 
burlington northern santa fe 10K railway 2008
 burlington northern santa fe 10K railway 2008 burlington northern santa fe 10K railway 2008
burlington northern santa fe 10K railway 2008finance16
 
Celadon 2008 Annual Report
Celadon	2008 Annual ReportCeladon	2008 Annual Report
Celadon 2008 Annual Reportearningsreport
 

Mais procurados (12)

comcast Annual Report on Form 10-K —2006
comcast Annual Report on Form 10-K  —2006comcast Annual Report on Form 10-K  —2006
comcast Annual Report on Form 10-K —2006
 
el paso 2007_EP10K
el paso 2007_EP10Kel paso 2007_EP10K
el paso 2007_EP10K
 
EPC2005AnnualReportForm10K
EPC2005AnnualReportForm10KEPC2005AnnualReportForm10K
EPC2005AnnualReportForm10K
 
EP10K3706
EP10K3706EP10K3706
EP10K3706
 
usg AR_10K2005
usg AR_10K2005usg AR_10K2005
usg AR_10K2005
 
30975861
3097586130975861
30975861
 
whole food market 2006_10K
whole food market 2006_10Kwhole food market 2006_10K
whole food market 2006_10K
 
burlington northern santa fe 10K railway 2008
 burlington northern santa fe 10K railway 2008 burlington northern santa fe 10K railway 2008
burlington northern santa fe 10K railway 2008
 
E8 ade980d01
E8 ade980d01E8 ade980d01
E8 ade980d01
 
Celadon 2008 Annual Report
Celadon	2008 Annual ReportCeladon	2008 Annual Report
Celadon 2008 Annual Report
 
Q1 2009 Earning Report of Emrise Corp
Q1 2009 Earning Report of Emrise CorpQ1 2009 Earning Report of Emrise Corp
Q1 2009 Earning Report of Emrise Corp
 
Q2 2009 Earning Report of H&R Block, Inc.
Q2 2009 Earning Report of H&R Block, Inc.Q2 2009 Earning Report of H&R Block, Inc.
Q2 2009 Earning Report of H&R Block, Inc.
 

Destaque

EP09_19Foshee_BankofAmerica_FINAL
EP09_19Foshee_BankofAmerica_FINALEP09_19Foshee_BankofAmerica_FINAL
EP09_19Foshee_BankofAmerica_FINALfinance49
 
EP3Q08OpStatsFinal
EP3Q08OpStatsFinalEP3Q08OpStatsFinal
EP3Q08OpStatsFinalfinance49
 
el paso 02_274Q2006Earnings_FINAL_FINAL_bb
el paso  02_274Q2006Earnings_FINAL_FINAL_bbel paso  02_274Q2006Earnings_FINAL_FINAL_bb
el paso 02_274Q2006Earnings_FINAL_FINAL_bbfinance49
 
2Q08_Op_Stats_Final
2Q08_Op_Stats_Final2Q08_Op_Stats_Final
2Q08_Op_Stats_Finalfinance49
 
el paso 3Q2005Earnings
el paso  3Q2005Earningsel paso  3Q2005Earnings
el paso 3Q2005Earningsfinance49
 
PoliticalAccountability
PoliticalAccountabilityPoliticalAccountability
PoliticalAccountabilityfinance49
 
EP05_24AnnualMeetingofStockholders
EP05_24AnnualMeetingofStockholdersEP05_24AnnualMeetingofStockholders
EP05_24AnnualMeetingofStockholdersfinance49
 
3Q2006OperatingStatistics
3Q2006OperatingStatistics3Q2006OperatingStatistics
3Q2006OperatingStatisticsfinance49
 
el paso PlattsRockiesConference
el paso  PlattsRockiesConferenceel paso  PlattsRockiesConference
el paso PlattsRockiesConferencefinance49
 
EPElPasoCorporation1Q06WebcastFinal
EPElPasoCorporation1Q06WebcastFinalEPElPasoCorporation1Q06WebcastFinal
EPElPasoCorporation1Q06WebcastFinalfinance49
 
el paso 08_11_Leland_UBS
el paso  08_11_Leland_UBSel paso  08_11_Leland_UBS
el paso 08_11_Leland_UBSfinance49
 
el paso 08_072QEarnings
el paso  08_072QEarningsel paso  08_072QEarnings
el paso 08_072QEarningsfinance49
 
EP4Q07OpStats_Final
EP4Q07OpStats_FinalEP4Q07OpStats_Final
EP4Q07OpStats_Finalfinance49
 
EP3Q07OpStats_FINAL
EP3Q07OpStats_FINALEP3Q07OpStats_FINAL
EP3Q07OpStats_FINALfinance49
 
jarden 2002_AR
jarden   2002_ARjarden   2002_AR
jarden 2002_ARfinance49
 
el paso 2004EPAnnual
el paso 2004EPAnnualel paso 2004EPAnnual
el paso 2004EPAnnualfinance49
 

Destaque (17)

EP09_19Foshee_BankofAmerica_FINAL
EP09_19Foshee_BankofAmerica_FINALEP09_19Foshee_BankofAmerica_FINAL
EP09_19Foshee_BankofAmerica_FINAL
 
EP3Q08OpStatsFinal
EP3Q08OpStatsFinalEP3Q08OpStatsFinal
EP3Q08OpStatsFinal
 
el paso 02_274Q2006Earnings_FINAL_FINAL_bb
el paso  02_274Q2006Earnings_FINAL_FINAL_bbel paso  02_274Q2006Earnings_FINAL_FINAL_bb
el paso 02_274Q2006Earnings_FINAL_FINAL_bb
 
2Q08_Op_Stats_Final
2Q08_Op_Stats_Final2Q08_Op_Stats_Final
2Q08_Op_Stats_Final
 
el paso 3Q2005Earnings
el paso  3Q2005Earningsel paso  3Q2005Earnings
el paso 3Q2005Earnings
 
PoliticalAccountability
PoliticalAccountabilityPoliticalAccountability
PoliticalAccountability
 
EPQ10710Q
EPQ10710QEPQ10710Q
EPQ10710Q
 
EP05_24AnnualMeetingofStockholders
EP05_24AnnualMeetingofStockholdersEP05_24AnnualMeetingofStockholders
EP05_24AnnualMeetingofStockholders
 
3Q2006OperatingStatistics
3Q2006OperatingStatistics3Q2006OperatingStatistics
3Q2006OperatingStatistics
 
el paso PlattsRockiesConference
el paso  PlattsRockiesConferenceel paso  PlattsRockiesConference
el paso PlattsRockiesConference
 
EPElPasoCorporation1Q06WebcastFinal
EPElPasoCorporation1Q06WebcastFinalEPElPasoCorporation1Q06WebcastFinal
EPElPasoCorporation1Q06WebcastFinal
 
el paso 08_11_Leland_UBS
el paso  08_11_Leland_UBSel paso  08_11_Leland_UBS
el paso 08_11_Leland_UBS
 
el paso 08_072QEarnings
el paso  08_072QEarningsel paso  08_072QEarnings
el paso 08_072QEarnings
 
EP4Q07OpStats_Final
EP4Q07OpStats_FinalEP4Q07OpStats_Final
EP4Q07OpStats_Final
 
EP3Q07OpStats_FINAL
EP3Q07OpStats_FINALEP3Q07OpStats_FINAL
EP3Q07OpStats_FINAL
 
jarden 2002_AR
jarden   2002_ARjarden   2002_AR
jarden 2002_AR
 
el paso 2004EPAnnual
el paso 2004EPAnnualel paso 2004EPAnnual
el paso 2004EPAnnual
 

Semelhante a EP10K

CIT_10K_2006
CIT_10K_2006CIT_10K_2006
CIT_10K_2006finance28
 
western digital 2278-001005-A02
western digital  2278-001005-A02western digital  2278-001005-A02
western digital 2278-001005-A02finance37
 
plains all american Table of Contents and Forward Looking Statements 2007
plains all american Table of Contents and Forward Looking Statements  2007plains all american Table of Contents and Forward Looking Statements  2007
plains all american Table of Contents and Forward Looking Statements 2007finance13
 
cit 2007_10-K
cit 2007_10-Kcit 2007_10-K
cit 2007_10-Kfinance28
 
GPI2006AR_Form10K
GPI2006AR_Form10KGPI2006AR_Form10K
GPI2006AR_Form10Kfinance45
 
GPI2006AR_Form10K
GPI2006AR_Form10KGPI2006AR_Form10K
GPI2006AR_Form10Kfinance45
 
cit B6ECBCC8-387D-47CD-8386-D05A207C86FB_34562pr11clean
cit B6ECBCC8-387D-47CD-8386-D05A207C86FB_34562pr11cleancit B6ECBCC8-387D-47CD-8386-D05A207C86FB_34562pr11clean
cit B6ECBCC8-387D-47CD-8386-D05A207C86FB_34562pr11cleanfinance28
 
reliance steel & aluminum 2007_Form_10K
reliance steel & aluminum  2007_Form_10Kreliance steel & aluminum  2007_Form_10K
reliance steel & aluminum 2007_Form_10Kfinance32
 
EPC2005AnnualReportForm10K
EPC2005AnnualReportForm10KEPC2005AnnualReportForm10K
EPC2005AnnualReportForm10Kfinance49
 
usg AR_10K2006
usg AR_10K2006usg AR_10K2006
usg AR_10K2006finance40
 
owens & minor 200610K
owens & minor  200610Kowens & minor  200610K
owens & minor 200610Kfinance33
 
tenet healthcare CY0810KFinal
tenet healthcare CY0810KFinaltenet healthcare CY0810KFinal
tenet healthcare CY0810KFinalfinance42
 
tenet healthcare CY0810KFinal
tenet healthcare CY0810KFinaltenet healthcare CY0810KFinal
tenet healthcare CY0810KFinalfinance42
 
tenet healthcare CY0810KFinal
tenet healthcare CY0810KFinaltenet healthcare CY0810KFinal
tenet healthcare CY0810KFinalfinance42
 
tenet healthcare CY0810KFinal
tenet healthcare CY0810KFinaltenet healthcare CY0810KFinal
tenet healthcare CY0810KFinalfinance42
 
reliance steel & aluminum 2006_Form_10K
reliance steel & aluminum  2006_Form_10Kreliance steel & aluminum  2006_Form_10K
reliance steel & aluminum 2006_Form_10Kfinance32
 
universal helath services 2003Financials
universal helath services  2003Financialsuniversal helath services  2003Financials
universal helath services 2003Financialsfinance49
 
universal helath services 2003Financials
universal helath services  2003Financialsuniversal helath services  2003Financials
universal helath services 2003Financialsfinance49
 

Semelhante a EP10K (20)

CIT_10K_2006
CIT_10K_2006CIT_10K_2006
CIT_10K_2006
 
western digital 2278-001005-A02
western digital  2278-001005-A02western digital  2278-001005-A02
western digital 2278-001005-A02
 
plains all american Table of Contents and Forward Looking Statements 2007
plains all american Table of Contents and Forward Looking Statements  2007plains all american Table of Contents and Forward Looking Statements  2007
plains all american Table of Contents and Forward Looking Statements 2007
 
cit 2007_10-K
cit 2007_10-Kcit 2007_10-K
cit 2007_10-K
 
GPI2006AR_Form10K
GPI2006AR_Form10KGPI2006AR_Form10K
GPI2006AR_Form10K
 
GPI2006AR_Form10K
GPI2006AR_Form10KGPI2006AR_Form10K
GPI2006AR_Form10K
 
cit B6ECBCC8-387D-47CD-8386-D05A207C86FB_34562pr11clean
cit B6ECBCC8-387D-47CD-8386-D05A207C86FB_34562pr11cleancit B6ECBCC8-387D-47CD-8386-D05A207C86FB_34562pr11clean
cit B6ECBCC8-387D-47CD-8386-D05A207C86FB_34562pr11clean
 
reliance steel & aluminum 2007_Form_10K
reliance steel & aluminum  2007_Form_10Kreliance steel & aluminum  2007_Form_10K
reliance steel & aluminum 2007_Form_10K
 
EPC2005AnnualReportForm10K
EPC2005AnnualReportForm10KEPC2005AnnualReportForm10K
EPC2005AnnualReportForm10K
 
EP10K3706
EP10K3706EP10K3706
EP10K3706
 
2010
20102010
2010
 
usg AR_10K2006
usg AR_10K2006usg AR_10K2006
usg AR_10K2006
 
owens & minor 200610K
owens & minor  200610Kowens & minor  200610K
owens & minor 200610K
 
tenet healthcare CY0810KFinal
tenet healthcare CY0810KFinaltenet healthcare CY0810KFinal
tenet healthcare CY0810KFinal
 
tenet healthcare CY0810KFinal
tenet healthcare CY0810KFinaltenet healthcare CY0810KFinal
tenet healthcare CY0810KFinal
 
tenet healthcare CY0810KFinal
tenet healthcare CY0810KFinaltenet healthcare CY0810KFinal
tenet healthcare CY0810KFinal
 
tenet healthcare CY0810KFinal
tenet healthcare CY0810KFinaltenet healthcare CY0810KFinal
tenet healthcare CY0810KFinal
 
reliance steel & aluminum 2006_Form_10K
reliance steel & aluminum  2006_Form_10Kreliance steel & aluminum  2006_Form_10K
reliance steel & aluminum 2006_Form_10K
 
universal helath services 2003Financials
universal helath services  2003Financialsuniversal helath services  2003Financials
universal helath services 2003Financials
 
universal helath services 2003Financials
universal helath services  2003Financialsuniversal helath services  2003Financials
universal helath services 2003Financials
 

Mais de finance49

jarden 2001_ar
jarden   2001_arjarden   2001_ar
jarden 2001_arfinance49
 
jarden 2001_ar
jarden   2001_arjarden   2001_ar
jarden 2001_arfinance49
 
jarden 2002_AR
jarden   2002_ARjarden   2002_AR
jarden 2002_ARfinance49
 
jarden 2004AR
jarden   2004ARjarden   2004AR
jarden 2004ARfinance49
 
jarden 2004AR
jarden   2004ARjarden   2004AR
jarden 2004ARfinance49
 
jarden AR2006
jarden   AR2006jarden   AR2006
jarden AR2006finance49
 
chiquita brands international annual
chiquita brands international annualchiquita brands international annual
chiquita brands international annualfinance49
 
chiquita brands international 2000annual
chiquita brands international 2000annualchiquita brands international 2000annual
chiquita brands international 2000annualfinance49
 
chiquita brands international 2001annual
chiquita brands international 2001annualchiquita brands international 2001annual
chiquita brands international 2001annualfinance49
 
chiquita brands international 2002annual
chiquita brands international 2002annualchiquita brands international 2002annual
chiquita brands international 2002annualfinance49
 
chiquita brands international 2003annual
chiquita brands international 2003annualchiquita brands international 2003annual
chiquita brands international 2003annualfinance49
 
chiquita brands international 2004annual
chiquita brands international 2004annualchiquita brands international 2004annual
chiquita brands international 2004annualfinance49
 
chiquita brands international 2005annual
chiquita brands international 2005annualchiquita brands international 2005annual
chiquita brands international 2005annualfinance49
 
chiquita brands international 2006annual
chiquita brands international 2006annualchiquita brands international 2006annual
chiquita brands international 2006annualfinance49
 

Mais de finance49 (20)

Jah112008
Jah112008Jah112008
Jah112008
 
Jah112008
Jah112008Jah112008
Jah112008
 
jarden 2001_ar
jarden   2001_arjarden   2001_ar
jarden 2001_ar
 
jarden 2001_ar
jarden   2001_arjarden   2001_ar
jarden 2001_ar
 
jarden 2002_AR
jarden   2002_ARjarden   2002_AR
jarden 2002_AR
 
Jarden_AR
Jarden_ARJarden_AR
Jarden_AR
 
Jarden_AR
Jarden_ARJarden_AR
Jarden_AR
 
jarden 2004AR
jarden   2004ARjarden   2004AR
jarden 2004AR
 
jarden 2004AR
jarden   2004ARjarden   2004AR
jarden 2004AR
 
jarden ar05
jarden   ar05jarden   ar05
jarden ar05
 
jarden ar05
jarden   ar05jarden   ar05
jarden ar05
 
jarden AR2006
jarden   AR2006jarden   AR2006
jarden AR2006
 
chiquita brands international annual
chiquita brands international annualchiquita brands international annual
chiquita brands international annual
 
chiquita brands international 2000annual
chiquita brands international 2000annualchiquita brands international 2000annual
chiquita brands international 2000annual
 
chiquita brands international 2001annual
chiquita brands international 2001annualchiquita brands international 2001annual
chiquita brands international 2001annual
 
chiquita brands international 2002annual
chiquita brands international 2002annualchiquita brands international 2002annual
chiquita brands international 2002annual
 
chiquita brands international 2003annual
chiquita brands international 2003annualchiquita brands international 2003annual
chiquita brands international 2003annual
 
chiquita brands international 2004annual
chiquita brands international 2004annualchiquita brands international 2004annual
chiquita brands international 2004annual
 
chiquita brands international 2005annual
chiquita brands international 2005annualchiquita brands international 2005annual
chiquita brands international 2005annual
 
chiquita brands international 2006annual
chiquita brands international 2006annualchiquita brands international 2006annual
chiquita brands international 2006annual
 

Último

Quantitative Analysis of Retail Sector Companies
Quantitative Analysis of Retail Sector CompaniesQuantitative Analysis of Retail Sector Companies
Quantitative Analysis of Retail Sector Companiesprashantbhati354
 
Amil Baba In Pakistan amil baba in Lahore amil baba in Islamabad amil baba in...
Amil Baba In Pakistan amil baba in Lahore amil baba in Islamabad amil baba in...Amil Baba In Pakistan amil baba in Lahore amil baba in Islamabad amil baba in...
Amil Baba In Pakistan amil baba in Lahore amil baba in Islamabad amil baba in...amilabibi1
 
NO1 WorldWide Genuine vashikaran specialist Vashikaran baba near Lahore Vashi...
NO1 WorldWide Genuine vashikaran specialist Vashikaran baba near Lahore Vashi...NO1 WorldWide Genuine vashikaran specialist Vashikaran baba near Lahore Vashi...
NO1 WorldWide Genuine vashikaran specialist Vashikaran baba near Lahore Vashi...Amil baba
 
Managing Finances in a Small Business (yes).pdf
Managing Finances  in a Small Business (yes).pdfManaging Finances  in a Small Business (yes).pdf
Managing Finances in a Small Business (yes).pdfmar yame
 
Bladex 1Q24 Earning Results Presentation
Bladex 1Q24 Earning Results PresentationBladex 1Q24 Earning Results Presentation
Bladex 1Q24 Earning Results PresentationBladex
 
原版1:1复刻温哥华岛大学毕业证Vancouver毕业证留信学历认证
原版1:1复刻温哥华岛大学毕业证Vancouver毕业证留信学历认证原版1:1复刻温哥华岛大学毕业证Vancouver毕业证留信学历认证
原版1:1复刻温哥华岛大学毕业证Vancouver毕业证留信学历认证rjrjkk
 
Call Girls Near Me WhatsApp:+91-9833363713
Call Girls Near Me WhatsApp:+91-9833363713Call Girls Near Me WhatsApp:+91-9833363713
Call Girls Near Me WhatsApp:+91-9833363713Sonam Pathan
 
Classical Theory of Macroeconomics by Adam Smith
Classical Theory of Macroeconomics by Adam SmithClassical Theory of Macroeconomics by Adam Smith
Classical Theory of Macroeconomics by Adam SmithAdamYassin2
 
Governor Olli Rehn: Dialling back monetary restraint
Governor Olli Rehn: Dialling back monetary restraintGovernor Olli Rehn: Dialling back monetary restraint
Governor Olli Rehn: Dialling back monetary restraintSuomen Pankki
 
AfRESFullPaper22018EmpiricalPerformanceofRealEstateInvestmentTrustsandShareho...
AfRESFullPaper22018EmpiricalPerformanceofRealEstateInvestmentTrustsandShareho...AfRESFullPaper22018EmpiricalPerformanceofRealEstateInvestmentTrustsandShareho...
AfRESFullPaper22018EmpiricalPerformanceofRealEstateInvestmentTrustsandShareho...yordanosyohannes2
 
(中央兰开夏大学毕业证学位证成绩单-案例)
(中央兰开夏大学毕业证学位证成绩单-案例)(中央兰开夏大学毕业证学位证成绩单-案例)
(中央兰开夏大学毕业证学位证成绩单-案例)twfkn8xj
 
Stock Market Brief Deck for "this does not happen often".pdf
Stock Market Brief Deck for "this does not happen often".pdfStock Market Brief Deck for "this does not happen often".pdf
Stock Market Brief Deck for "this does not happen often".pdfMichael Silva
 
PMFBY , Pradhan Mantri Fasal bima yojna
PMFBY , Pradhan Mantri  Fasal bima yojnaPMFBY , Pradhan Mantri  Fasal bima yojna
PMFBY , Pradhan Mantri Fasal bima yojnaDharmendra Kumar
 
Tenets of Physiocracy History of Economic
Tenets of Physiocracy History of EconomicTenets of Physiocracy History of Economic
Tenets of Physiocracy History of Economiccinemoviesu
 
(办理学位证)加拿大萨省大学毕业证成绩单原版一比一
(办理学位证)加拿大萨省大学毕业证成绩单原版一比一(办理学位证)加拿大萨省大学毕业证成绩单原版一比一
(办理学位证)加拿大萨省大学毕业证成绩单原版一比一S SDS
 
《加拿大本地办假证-寻找办理Dalhousie毕业证和达尔豪斯大学毕业证书的中介代理》
《加拿大本地办假证-寻找办理Dalhousie毕业证和达尔豪斯大学毕业证书的中介代理》《加拿大本地办假证-寻找办理Dalhousie毕业证和达尔豪斯大学毕业证书的中介代理》
《加拿大本地办假证-寻找办理Dalhousie毕业证和达尔豪斯大学毕业证书的中介代理》rnrncn29
 
Stock Market Brief Deck for 4/24/24 .pdf
Stock Market Brief Deck for 4/24/24 .pdfStock Market Brief Deck for 4/24/24 .pdf
Stock Market Brief Deck for 4/24/24 .pdfMichael Silva
 
NO1 Certified Amil Baba In Lahore Kala Jadu In Lahore Best Amil In Lahore Ami...
NO1 Certified Amil Baba In Lahore Kala Jadu In Lahore Best Amil In Lahore Ami...NO1 Certified Amil Baba In Lahore Kala Jadu In Lahore Best Amil In Lahore Ami...
NO1 Certified Amil Baba In Lahore Kala Jadu In Lahore Best Amil In Lahore Ami...Amil baba
 

Último (20)

Quantitative Analysis of Retail Sector Companies
Quantitative Analysis of Retail Sector CompaniesQuantitative Analysis of Retail Sector Companies
Quantitative Analysis of Retail Sector Companies
 
Amil Baba In Pakistan amil baba in Lahore amil baba in Islamabad amil baba in...
Amil Baba In Pakistan amil baba in Lahore amil baba in Islamabad amil baba in...Amil Baba In Pakistan amil baba in Lahore amil baba in Islamabad amil baba in...
Amil Baba In Pakistan amil baba in Lahore amil baba in Islamabad amil baba in...
 
NO1 WorldWide Genuine vashikaran specialist Vashikaran baba near Lahore Vashi...
NO1 WorldWide Genuine vashikaran specialist Vashikaran baba near Lahore Vashi...NO1 WorldWide Genuine vashikaran specialist Vashikaran baba near Lahore Vashi...
NO1 WorldWide Genuine vashikaran specialist Vashikaran baba near Lahore Vashi...
 
Managing Finances in a Small Business (yes).pdf
Managing Finances  in a Small Business (yes).pdfManaging Finances  in a Small Business (yes).pdf
Managing Finances in a Small Business (yes).pdf
 
Bladex 1Q24 Earning Results Presentation
Bladex 1Q24 Earning Results PresentationBladex 1Q24 Earning Results Presentation
Bladex 1Q24 Earning Results Presentation
 
原版1:1复刻温哥华岛大学毕业证Vancouver毕业证留信学历认证
原版1:1复刻温哥华岛大学毕业证Vancouver毕业证留信学历认证原版1:1复刻温哥华岛大学毕业证Vancouver毕业证留信学历认证
原版1:1复刻温哥华岛大学毕业证Vancouver毕业证留信学历认证
 
Call Girls Near Me WhatsApp:+91-9833363713
Call Girls Near Me WhatsApp:+91-9833363713Call Girls Near Me WhatsApp:+91-9833363713
Call Girls Near Me WhatsApp:+91-9833363713
 
Classical Theory of Macroeconomics by Adam Smith
Classical Theory of Macroeconomics by Adam SmithClassical Theory of Macroeconomics by Adam Smith
Classical Theory of Macroeconomics by Adam Smith
 
Governor Olli Rehn: Dialling back monetary restraint
Governor Olli Rehn: Dialling back monetary restraintGovernor Olli Rehn: Dialling back monetary restraint
Governor Olli Rehn: Dialling back monetary restraint
 
AfRESFullPaper22018EmpiricalPerformanceofRealEstateInvestmentTrustsandShareho...
AfRESFullPaper22018EmpiricalPerformanceofRealEstateInvestmentTrustsandShareho...AfRESFullPaper22018EmpiricalPerformanceofRealEstateInvestmentTrustsandShareho...
AfRESFullPaper22018EmpiricalPerformanceofRealEstateInvestmentTrustsandShareho...
 
(中央兰开夏大学毕业证学位证成绩单-案例)
(中央兰开夏大学毕业证学位证成绩单-案例)(中央兰开夏大学毕业证学位证成绩单-案例)
(中央兰开夏大学毕业证学位证成绩单-案例)
 
Stock Market Brief Deck for "this does not happen often".pdf
Stock Market Brief Deck for "this does not happen often".pdfStock Market Brief Deck for "this does not happen often".pdf
Stock Market Brief Deck for "this does not happen often".pdf
 
PMFBY , Pradhan Mantri Fasal bima yojna
PMFBY , Pradhan Mantri  Fasal bima yojnaPMFBY , Pradhan Mantri  Fasal bima yojna
PMFBY , Pradhan Mantri Fasal bima yojna
 
Tenets of Physiocracy History of Economic
Tenets of Physiocracy History of EconomicTenets of Physiocracy History of Economic
Tenets of Physiocracy History of Economic
 
(办理学位证)加拿大萨省大学毕业证成绩单原版一比一
(办理学位证)加拿大萨省大学毕业证成绩单原版一比一(办理学位证)加拿大萨省大学毕业证成绩单原版一比一
(办理学位证)加拿大萨省大学毕业证成绩单原版一比一
 
《加拿大本地办假证-寻找办理Dalhousie毕业证和达尔豪斯大学毕业证书的中介代理》
《加拿大本地办假证-寻找办理Dalhousie毕业证和达尔豪斯大学毕业证书的中介代理》《加拿大本地办假证-寻找办理Dalhousie毕业证和达尔豪斯大学毕业证书的中介代理》
《加拿大本地办假证-寻找办理Dalhousie毕业证和达尔豪斯大学毕业证书的中介代理》
 
Stock Market Brief Deck for 4/24/24 .pdf
Stock Market Brief Deck for 4/24/24 .pdfStock Market Brief Deck for 4/24/24 .pdf
Stock Market Brief Deck for 4/24/24 .pdf
 
NO1 Certified Amil Baba In Lahore Kala Jadu In Lahore Best Amil In Lahore Ami...
NO1 Certified Amil Baba In Lahore Kala Jadu In Lahore Best Amil In Lahore Ami...NO1 Certified Amil Baba In Lahore Kala Jadu In Lahore Best Amil In Lahore Ami...
NO1 Certified Amil Baba In Lahore Kala Jadu In Lahore Best Amil In Lahore Ami...
 
Monthly Economic Monitoring of Ukraine No 231, April 2024
Monthly Economic Monitoring of Ukraine No 231, April 2024Monthly Economic Monitoring of Ukraine No 231, April 2024
Monthly Economic Monitoring of Ukraine No 231, April 2024
 
🔝+919953056974 🔝young Delhi Escort service Pusa Road
🔝+919953056974 🔝young Delhi Escort service Pusa Road🔝+919953056974 🔝young Delhi Escort service Pusa Road
🔝+919953056974 🔝young Delhi Escort service Pusa Road
 

EP10K

  • 1. UNITED STATES SECURITIES AND EXCHANGE COMMISSION Washington, D.C. 20549 Form 10-K (Mark One) ¥ ANNUAL REPORT PURSUANT TO SECTION 13 OR 15(d) OF THE SECURITIES EXCHANGE ACT OF 1934 For the fiscal year ended December 31, 2006 OR n TRANSITION REPORT PURSUANT TO SECTION 13 OR 15(d) OF THE SECURITIES EXCHANGE ACT OF 1934 For the transition period from to . Commission File Number 1-14365 El Paso Corporation (Exact Name of Registrant as Specified in Its Charter) Delaware 76-0568816 (State or Other Jurisdiction of (I.R.S. Employer Incorporation or Organization) Identification No.) El Paso Building 1001 Louisiana Street Houston, Texas 77002 (Address of Principal Executive Offices) (Zip Code) Telephone Number: (713) 420-2600 Internet Website: www.elpaso.com Securities registered pursuant to Section 12(b) of the Act: Name of Each Exchange Title of Each Class on which Registered Common Stock, par value $3 per share New York Stock Exchange Securities registered pursuant to Section 12(g) of the Act: None Indicate by check mark if the registrant is a well-known seasoned issuer, as defined in Rule 405 of the Securities Act. Yes ¥ No n. Indicate by check mark if the registrant is not required to file reports pursuant to Section 13 or Section 15(d) of the Act. Yes n No ¥. Indicate by check mark whether the registrant (1) has filed all reports required to be filed by Section 13 or 15(d) of the Securities Exchange Act of 1934 during the preceding 12 months (or for such shorter period that the registrant was required to file such reports), and (2) has been subject to such filing requirements for the past 90 days. Yes ¥ No n. Indicate by check mark if disclosure of delinquent filers pursuant to Item 405 of Regulation S-K is not contained herein, and will not be contained, to the best of registrant’s knowledge, in definitive proxy or information statements incorporated by reference in Part III of this Form 10-K or any amendment to this Form 10-K. ¥ Indicate by check mark whether the registrant is a large accelerated filer, an accelerated filer, or a non-accelerated filer. See definition of “accelerated filer and large accelerated filer” in Rule 12b-2 of the Exchange Act. (Check one): Large accelerated filer ¥ Accelerated filer n Non-accelerated filer n Indicate by check mark whether the registrant is a shell company (as defined in Rule 12b-2 of the Exchange Act). Yes n No ¥. State the aggregate market value of the voting and non-voting common equity held by non-affiliates of the registrant. Aggregate market value of the voting stock (which consists solely of shares of common stock) held by non-affiliates of the registrant as of June 30, 2006 computed by reference to the closing sale price of the registrant’s common stock on the New York Stock Exchange on such date: $10,437,735,495. Indicate the number of shares outstanding of each of the registrant’s classes of common stock, as of the latest practicable date. Common Stock, par value $3 per share. Shares outstanding on February 21, 2007: 698,334,034 Documents Incorporated by Reference List hereunder the following documents if incorporated by reference and the part of the Form 10-K (e.g., Part I, Part II, etc.) into which the document is incorporated: Portions of our definitive proxy statement for the 2007 Annual Meeting of Stockholders are incorporated by reference into Part III of this report. These will be filed no later than April 30, 2007.
  • 2. EL PASO CORPORATION TABLE OF CONTENTS Caption Page PART I Item 1. Business . . . . . . . . . . . . . . . . . . . . . . . . . . . . . . . . . . . . . . . ....................... 1 Item 1A. Risk Factors . . . . . . . . . . . . . . . . . . . . . . . . . . . . . . . . . . . . ....................... 22 Item 1B. Unresolved Staff Comments . . . . . . . . . . . . . . . . . . . . . . . . . ....................... 31 Item 2. Properties . . . . . . . . . . . . . . . . . . . . . . . . . . . . . . . . . . . . . . ....................... 31 Item 3. Legal Proceedings . . . . . . . . . . . . . . . . . . . . . . . . . . . . . . . . ....................... 31 Item 4. Submission of Matters to a Vote of Security Holders. . . . . . . ....................... 31 PART II Item 5. Market for Registrant’s Common Equity, Related Stockholder Matters and Issuer Purchases of Equity Securities . . . . . . . . . . . . . . . . . . . . . . . . . . . . . . . . . . . . . . . . . . . . . . . . . . . . 32 Item 6. Selected Financial Data . . . . . . . . . . . . . . . . . . . . . . . . . . . . . . . . . . . . . . . . . . . . . . . . . . . 34 Item 7. Management’s Discussion and Analysis of Financial Condition and Results of Operations . . 35 Item 7A. Quantitative and Qualitative Disclosures About Market Risk . . . . . . . . . . . . . . . . . . . . . . . . 74 Item 8. Financial Statements and Supplementary Data . . . . . . . . . . . . . . . . . . . . . . . . . . . . . . . . . . 77 Item 9. Changes in and Disagreements with Accountants on Accounting and Financial Disclosure . . 149 Item 9A. Controls and Procedures. . . . . . . . . . . . . . . . . . . . . . . . . . . . . . . . . . . . . . . . . . . . . . . . . . . 149 Item 9B. Other Information . . . . . . . . . . . . . . . . . . . . . . . . . . . . . . . . . . . . . . . . . . . . . . . . . . . . . . . 149 PART III Item 10. Directors, Executive Officers and Corporate Governance . . . . . . . . . . . . . . . . . . . . . . . . . . . 150 Item 11. Executive Compensation . . . . . . . . . . . . . . . . . . . . . . . . . . . . . . . . . . . . . . . . . . . . . . . . . . 150 Item 12. Security Ownership of Certain Beneficial Owners and Management and Related Stockholder Matters . . . . . . . . . . . . . . . . . . . . . . . . . . . . . . . . . . . . . . . . . . . . . . . . . . . . 150 Item 13. Certain Relationships and Related Transactions, and Director Independence . . . . . . . . . . . . . 150 Item 14. Principal Accountant Fees and Services . . . . . . . . . . . . . . . . . . . . . . . . . . . . . . . . . . . . . . . 150 PART IV Item 15. Exhibits and Financial Statement Schedules . . . . . . . . . . . . . . . . . . . . . . . . . . . . . . . . . . . . 150 Signatures . . . . . . . . . . . . . . . . . . . . . . . . . . . . . . . . . . . . . . . . . . . . . . . . . . . . . . . . . . . . . 152 Below is a list of terms that are common to our industry and used throughout this document: /d = per day MDth = thousand dekatherms Bbl = barrel MMBtu = million British thermal units BBtu = billion British thermal units MMcf = million cubic feet Bcf = billion cubic feet MMcfe = million cubic feet of natural gas equivalents Bcfe = billion cubic feet of natural gas equivalents GWh = thousand megawatt hours LNG = liquefied natural gas MW = megawatt MBbls = thousand barrels NGL = natural gas liquids Mcf = thousand cubic feet TBtu = trillion British thermal units Mcfe = thousand cubic feet of natural gas equivalents Tcfe = trillion cubic feet of natural gas equivalents When we refer to natural gas and oil in “equivalents,” we are doing so to compare quantities of oil with quantities of natural gas or to express these different commodities in a common unit. In calculating equivalents, we use a generally recognized standard in which one Bbl of oil is equal to six Mcf of natural gas. Also, when we refer to cubic feet measurements, all measurements are at a pressure of 14.73 pounds per square inch. When we refer to “us”, “we”, “our”, “ours”, “the Company”, or “El Paso”, we are describing El Paso Corporation and/or our subsidiaries. i
  • 3. PART I ITEM 1. BUSINESS Business and Strategy We are an energy company, originally founded in 1928 in El Paso, Texas that primarily operates in the regulated natural gas transmission and exploration and production sectors of the energy industry. Our purpose is to provide natural gas and related energy products in a safe, efficient and dependable manner. Regulated Natural Gas Transmission. We own or have interests in North America’s largest interstate pipeline system with approximately 55,000 miles of pipe that connect North America’s major producing basins to its major consuming markets. We also provide approximately 470 Bcf of storage capacity and have an LNG receiving terminal and related facilities in Elba Island, Georgia with 806 MMcf of daily base load sendout capacity. In February 2007, we sold ANR Pipeline Company (ANR), our Michigan storage assets and our 50 percent interest in Great Lakes Gas Transmission, which comprised approximately 12,600 miles of pipeline and 236 Bcf of storage capacity. The size, connectivity and diversity of our remaining U.S. pipeline system provides growth opportunities through infrastructure development or large scale expansion projects and gives us the capability to adapt to the dynamics of shifting supply and demand. We are focused on enhancing the value of our transmission business through successful recontracting, continual efficiency improvements through reliable and safe operations, cost management, developing growth projects and prudent capital spending in the United States and Mexico. Exploration and Production. Our exploration and production business is currently focused on the explo- ration for and the acquisition, development and production of natural gas, oil and NGL in the United States, Brazil and Egypt. As of December 31, 2006, we held an estimated 2.4 Tcfe of proved natural gas and oil reserves, exclusive of our equity share in the proved reserves of an unconsolidated affiliate of 222 Bcfe. In this business, we are focused on growing our reserve base through disciplined capital allocation and portfolio management, cost control and marketing and selling our natural gas and oil production at optimal prices while managing associated price risks. Our operations are conducted through three primary segments: Pipelines, Exploration and Production and Marketing. We also have a Power segment which holds our remaining interests in international power plants in Brazil, Asia and Central America. Our business segments provide a variety of energy products and services and are managed separately as each segment requires different technology and marketing strategies. For further discussion of our business segments, see Part II, Item 7, Management’s Discussion and Analysis of Financial Condition and Results of Operations and Part II, Item 8, Financial Statements and Supplementary Data, Note 17. Pipelines Segment Our Pipelines segment includes our interstate natural gas transmission systems and related operations. These operations are conducted through eight separate, wholly owned pipeline systems and five partially owned systems. These systems connect the nation’s principal natural gas supply regions to the five largest consuming regions in the United States: the Gulf Coast, California, the northeast, the southwest and the southeast. We also have access to systems in Canada and assets in Mexico. Our pipelines segment also includes (i) our ownership of storage capacity through our wholly owned transmission systems, two wholly owned storage facilities, and three partially owned storage systems as well as (ii) our LNG terminal and related facilities. Each of our U.S. pipeline systems and storage facilities operate under Federal Energy Regulatory Commission (FERC) approved tariffs that establish rates, cost recovery mechanisms, and other terms and conditions of service to our customers. The fees or rates established under our tariffs are a function of our costs of providing services to our customers, including a reasonable return on our invested capital. Our strategy is to enhance the value of our transmission and storage business by: • Expanding our systems by attracting new customers, markets or supply sources; • Identifying and developing growth opportunities; • Recontracting or contracting available or expiring capacity; 1
  • 4. • Focusing on efficiency in our operations and cost control, including efficiencies that may be available across our systems; • Maintaining the value and ensuring the safety of our pipeline systems and assets; and • Providing outstanding customer service. Wholly Owned Interstate Transmission Systems As of December 31, 2006 Average Throughput(1) Transmission Supply and Miles of Design Storage System Market Region Pipeline Capacity Capacity 2006 2005 2004 (MMcf/d) (Bcf) (BBtu/d) Tennessee Gas Extends from Louisiana, the Gulf 14,100 6,961 90 4,534 4,443 4,469 Pipeline of Mexico and south Texas to the (TGP) northeast section of the U.S., including the metropolitan areas of New York City and Boston. ANR Pipeline(2) Extends from Louisiana, 10,500 7,311 197 3,954 4,100 4,067 (ANR) Oklahoma, Texas and the Gulf of Mexico to the midwestern and northeastern regions of the U.S., including the metropolitan areas of Detroit, Chicago and Milwaukee. 5,650(3) El Paso Natural Extends from San Juan, Permian 10,300 44 4,179 4,053 4,074 Gas (EPNG) and Anadarko basins to California, its single largest market, as well as markets in Arizona, Nevada, New Mexico, Oklahoma, Texas and northern Mexico. Southern Natural Extends from natural gas fields in 7,500 3,450 60 2,211 1,984 2,163 Gas (SNG) Texas, Louisiana, Mississippi, Alabama and the Gulf of Mexico to Louisiana, Mississippi, Alabama, Florida, Georgia, South Carolina and Tennessee, including the metropolitan areas of Atlanta and Birmingham. Colorado Extends from production areas in 4,000 3,000 29 2,008 1,902 1,744 Interstate Gas the Rocky Mountain region and the (CIG) Anadarko Basin to the front range of the Rocky Mountains and multiple interconnections with pipeline systems transporting gas to the midwest, the southwest, California and the Pacific northwest. Wyoming Extends from western Wyoming, 700 2,330 — 1,914 1,572 1,214 Interstate western Colorado and the Powder (WIC) River Basin to various pipeline interconnections near Cheyenne, Wyoming. 2
  • 5. As of December 31, 2006 Average Throughput(1) Transmission Supply and Miles of Design Storage System Market Region Pipeline Capacity Capacity 2006 2005 2004 (MMcf/d) (Bcf) (BBtu/d) Mojave Pipeline Connects with the EPNG system 400 407 — 461 161 161 (MPC) near Cadiz, California, the EPNG and Transwestern systems at Topock, Arizona and to the Kern River Gas Transmission Company system in California to customers in the vicinity of Bakersfield, California. Cheyenne Plains Extends from Cheyenne hub in 400 838 — 583 433 89 Gas Pipeline(4) Colorado to various pipeline (CPG) interconnections near Greensburg, Kansas. (1) Includes throughput transported on behalf of affiliates. (2) Sold in February 2007. (3) This capacity reflects winter-sustainable west-flow capacity of 4,850 MMcf/d and approximately 800 MMcf/d of east-end delivery capacity. (4) This system was completed in 2005. As of December 31, 2006, we had the following pipeline and storage expansion projects on our existing systems that have been approved by the FERC: Capacity Anticipated Project (MMcf/d) Description Completion Date Louisiana Deepwater 850 To construct a 300 foot extension of our 20-inch July 2007 Link Grand Isle supply lateral, construct 2,100 feet of 24-inch West Delta supply lateral, abandon 3,100 feet of the 20-inch line connected to the Grand Isle platform, and install appurtenant facilities on Enterprise Product Partners Independence Hub platform located in Mississippi Canyon Block 920. Triple-T Extension 200 To construct 6.2 miles of 24-inch pipeline to September 2007 extend our existing 30-inch Triple-T Line, beginning in Eugene Island Block 349, to interconnect with Enterprise Products Partners L.P.’s Anaconda System on the El 371 platform, as well as associated piping and other appurtenant facilities. Essex Middlesex Project 80 To construct 7.8 miles of 24-inch pipeline November 2007 connecting our Beverly-Salem line to the DOMAC line in Essex and Middlesex Counties, Massachusetts. Northeast ConneXion — 108 To construct a compression station and modify November 2007 New England compression at six existing facilities on our interstate pipeline system in Pennsylvania, New York, and Massachusetts. May 2007(1) Cypress Expansion 500 To construct approximately 177 miles of pipeline to connect our Elba Island facility with markets in Georgia and Florida. (1) Project will consist of three phases. The anticipated completion date is related to phase 1. 3
  • 6. Partially Owned Interstate Transmission Systems As of December 31, 2006 Average Throughput(2) Transmission Supply and Ownership Miles of Design System(1) Pipeline(2) Capacity(2) Market Region Interest 2006 2005 2004 (Percent) (MMcf/d) (BBtu/d) Florida Gas Extends from South Texas to South 50 4,868 2,090 2,018 1,916 2,014 Transmission(3) Florida. Great Lakes Gas Extends from Manitoba-Minnesota 50 2,115 2,600 2,244 2,376 2,200 Transmission(4) border to the Michigan-Ontario border at St. Clair, Michigan. Samalayuca Extends from U.S.-Mexico border to 50 23 460 442 423 433 Pipeline and the state of Chihuahua, Mexico. Gloria a Dios Compression Station San Fernando Extends from Pemex Compression 50 71 1,000 951 951 951 Pipeline Station 19 to the Pemex metering station in San Fernando, Mexico in the State of Tamaulipas. (1) These systems are accounted for as equity investments. (2) Miles, volumes and average throughput represent the systems’ totals and are not adjusted for our ownership interest. (3) We have a 50 percent equity interest in Citrus Corp. (Citrus), which owns this system. (4) Sold in February 2007. Partially Owned Intrastate Transmission Systems We also have a 50 percent interest in WYCO Development, L.L.C. (WYCO). WYCO owns a state regulated intrastate gas pipeline extending from the Cheyenne Hub in northeast Colorado to Public Service Company of Colorado’s (PSCo) Fort St. Vrain electric generation plant. WYCO also owns a compressor station on our WIC system’s Medicine Bow lateral in Wyoming and leases these pipeline and compression facilities to PSCo and WIC, respectively, under long-term leases. Underground Natural Gas Storage Entities In addition to the storage capacity on our transmission systems, we own or have interests in the following natural gas storage entities: As of December 31, 2006 Ownership Storage Capacity(1) Storage Entity Interest Location (Percent) (Bcf) Bear Creek Storage . . . . . . . . . . . . . . . . . . . . . . . . . . . . ..... 100 58 Louisiana ANR Storage(2) . . . . . . . . . . . . . . . . . . . . . . . . . . . . . . . ..... 100 56 Michigan Blue Lake Gas Storage(2) . . . . . . . . . . . . . . . . . . . . . . . . ..... 75 47 Michigan Eaton Rapids Gas Storage(2)(3) . . . . . . . . . . . . . . . . . . . . ..... 50 13 Michigan Young Gas Storage(3) . . . . . . . . . . . . . . . . . . . . . . . . . . . ..... 48 6 Colorado (1) Approximately 135 Bcf is contracted to affiliates. Amounts are not adjusted for our ownership interest. (2) Sold in February 2007. (3) This system is accounted for as an equity investment. LNG Facility We own an LNG receiving terminal located on Elba Island, near Savannah, Georgia with a peak sendout capacity of 1,215 MMcf/d and a base load sendout capacity of 806 MMcf/d. The capacity at the terminal is contracted with subsidiaries of British Gas Group and Royal Dutch Shell PLC. 4
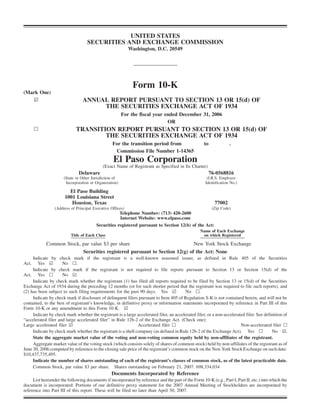
  • 7. Markets and Competition We provide natural gas services to a variety of customers, including natural gas producers, marketers, end- users and other natural gas transmission, distribution and electric generation companies. In performing these services, we compete with other pipeline service providers as well as alternative energy sources such as coal, nuclear, wind, hydroelectric and fuel oil. Imported LNG is one of the fastest growing supply sectors of the natural gas market. Terminals and other regasification facilities can serve as important sources of supply for pipelines, enhancing their delivery capabilities and operational flexibility and complementing traditional supply transported into market areas. These LNG delivery systems, however, may also compete with our pipelines for transportation of gas into the market areas we serve. Electric power generation is the fastest growing demand sector of the natural gas market. The growth of the electric power industry potentially benefits the natural gas industry by creating more demand for natural gas turbine generated electric power. This potential benefit is offset, in varying degrees, by increased generation efficiency, the more effective use of surplus electric capacity, increased natural gas prices and the use and availability of other fuel sources for power generation. In addition, in several regions of the country, new additions in electric generating capacity have exceeded load growth and electric transmission capabilities out of those regions. These developments may inhibit owners of new power generation facilities from signing firm contracts with pipelines. Our existing contracts mature at various times and in varying amounts of throughput capacity. Our ability to extend our existing contracts or remarket expiring capacity is dependent on competitive alternatives, the regulatory environment at the federal, state and local levels and market supply and demand factors at the relevant dates these contracts are extended or expire. The duration of new or renegotiated contracts will be affected by current prices, competitive conditions and judgments concerning future market trends and volatility. Subject to regulatory requirements, we attempt to recontract or remarket our capacity at the rates allowed under our tariffs although, at times, we discount these rates to remain competitive. The level of discount varies for each of our pipeline systems. The table below shows the contracted capacity that expires by year over the next five years and thereafter. Contract Expirations(1) 40% 12,615 13,000 12,000 11,000 10,000 9,000 MDth/d 8,000 7,000 15% 6,000 13% 13% 4,687 5,000 4,055 3,926 10% 9% 4,000 3,032 2,656 3,000 2,000 1,000 0 2007 2008 2009 2010 2011 Beyond Year (1) Includes ANR sold in February 2007. The following table details information related to our customers, contracts, the markets we serve, and the competition faced by each of our wholly owned pipeline transmission systems as of December 31, 2006. Our firm customers reserve capacity on our pipeline system, storage facilities or LNG terminalling facilities and are obligated to pay a monthly reservation or demand charge, regardless of the amount of natural gas they transport or 5
  • 8. store, for the term of their contracts. Interruptible customers are customers without reserved capacity that pay usage charges based on the volume of gas actually transported, stored, injected or withdrawn. TGP Customer Information Contract Information Competition Approximately 460 firm and interruptible Approximately 470 firm transportation TGP faces competition in its northeast, customers, none of which individually contracts. Weighted average remaining Appalachian, midwest and southeast market represents more than 10 percent of contract term of approximately four years. areas. It competes with other interstate and revenues intrastate pipelines for deliveries to multiple-connection customers who can take deliveries at alternative points. Natural gas delivered on the TGP system competes with alternative energy sources such as electricity, hydroelectric power, coal and fuel oil. In addition, TGP competes with pipelines and gathering systems for connection to new supply sources in Texas, the Gulf of Mexico and from the Canadian border. In the offshore areas of the Gulf of Mexico, factors such as the distance of the supply fields from the pipeline, relative basis pricing of the pipeline receipt points, and costs of intermediate gathering or required processing of the natural gas to be transported may influence determinations of whether natural gas is ultimately attached to the TGP system. ANR(1) Customer Information Contract Information Competition Approximately 290 firm and Approximately 670 firm transportation In its market areas, ANR competes directly interruptible customers contracts. Weighted average remaining with Guardian Pipeline, for markets in contract term of approximately five years. Wisconsin. ANR also competes directly with other interstate pipelines in the Major Customer: northeast markets to serve electric We Energies generation and local distribution companies. (799 BBtu/d) Expire in 2007-2016. In its supply areas, ANR competes directly with numerous pipelines and gathering systems for access to new supply sources. ANR’s principal supply sources are the Rockies and mid-continent production accessed in Kansas and Oklahoma, western Canadian production delivered to Wisconsin and the Chicago area and Gulf of Mexico sources, including deepwater production and LNG imports. (1) Sold in February 2007 EPNG Customer Information Competition Contract Information Approximately 160 firm and Approximately 190 firm transportation EPNG faces competition in the west and interruptible customers contracts. Weighted average remaining southwest from other existing and proposed contract term of approximately four years. pipelines, from California storage facilities, and alternative energy sources that are used Major Customers: to generate electricity such as hydroelectric, Southern California Gas Company nuclear, wind, coal and fuel oil. In addition, (101 BBtu/d) Expires in 2007. construction of facilities to bring LNG into (187 BBtu/d) Expires in 2009. California and northern Mexico are (561 BBtu/d) Expire in 2010 - 2011. underway. Southwest Gas Corporation (11 BBtu/d) Expires in 2008. (476 BBtu/d) Expire in 2011 - 2015. 6
  • 9. SNG Customer Information Contract Information Competition Approximately 274 firm and Approximately 200 firm transportation SNG faces competition in a number of its interruptible customers contracts. Weighted average remaining key markets. SNG competes with other contract term of approximately six years. interstate and intrastate pipelines for deliveries to multiple-connection customers who can take deliveries at alternative Major Customers: points. Natural gas delivered on SNG’s Atlanta Gas Light Company system competes with alternative energy (959 BBtu/d) Expire in 2009-2015. sources used to generate electricity, such as hydroelectric power, nuclear power, coal Southern Company Services and fuel oil. SNG’s four largest customers (418 BBtu/d) Expire in 2010-2018. are able to obtain a significant portion of their natural gas requirements through Alabama Gas Corporation transportation from other pipelines. Also, (413 BBtu/d) Expire in 2010-2013. SNG competes with several pipelines for the transportation business of their other Scana Corporation customers. In addition, SNG competes with (316 BBtu/d) Expire in 2007-2019. pipelines and gathering systems for connection to new supply services. CIG Customer Information Contract Information Competition Approximately 110 firm and interruptible Approximately 170 firm transportation CIG serves two major markets, an ‘‘on- customers contracts. Weighted average remaining system” market and an ‘‘off-system” contract term of approximately six years. market. Its ‘on-system‘ market consists of utilities and other customers located along the front range of the Rocky Mountains in Major Customers: Colorado and Wyoming. Competitors in this Public Service Company of Colorado market consist of an intrastate pipeline, a new interstate pipeline, local production (187 BBtu/d) Expires in 2008. from the Denver-Julesburg basin, and long- (9 BBtu/d) Expires in 2009. haul shippers who elect to sell into this (1,106 BBtu/d) Expire in 2012-2014. market rather than the off-system market. CIG’s off- system market consists of the transportation of Rocky Mountain production from multiple supply basins to interconnections with other pipelines bound for the midwest, the southwest, California Williams Power Company and the Pacific northwest. Competition for this off-system market consists of a new (30 BBtu/d) Expires in 2007. interstate pipeline and other existing (53 BBtu/d) Expires in 2009. interstate pipelines that are directly (348 BBtu/d) Expire in 2010 - 2013. connected to its supply sources. Anadarko Petroleum Corporation and subsidiaries (10 BBtu/d) Expires in 2007. (60 BBtu/d) Expires in 2008. (12 BBtu/d) Expires in 2009. (208 BBtu/d) Expire in 2010 - 2015. 7
  • 10. WIC Customer Information Contract Information Competition Approximately 50 firm and Approximately 50 firm transportation WIC competes with existing pipelines and interruptible customers contracts. Weighted average remaining a new interstate pipeline to provide contract term of approximately six years. transportation services to pipeline interconnects in northeast Colorado and Major Customers: western Wyoming. Williams Power Company (25 BBtu/d) Expires in 2008. (678 BBtu/d) Expire in 2010-2021. Anadarko Petroleum Corporation and subsidiaries (25 BBtu/d) Expires in 2008. (385 BBtu/d) Expire in 2011-2017. MPC Customer Information Contract Information Competition Approximately 20 firm and Approximately six firm transportation MPC faces competition from other existing interruptible customers contracts. Weighted average remaining and proposed pipelines, and alternative contract term of approximately seven years. energy sources that are used to generate electricity such as hydroelectric, nuclear, Major Customers: wind, coal and fuel oil. In addition, Los Angeles Department of Water construction of facilities to bring LNG into and Power California and northern Mexico are (50 BBtu/d) Expires in 2015. underway. EPNG (312 BBtu/d) Los Angeles Department of Water and Power (50 BBtu/d) Expires in 2007. CPG Customer Information Contract Information Competition Approximately 30 firm and Approximately 30 firm transportation CPG competes directly with other interstate interruptible customers contracts. Weighted average remaining pipelines serving the mid-continent region. contract term of approximately eight years. Indirectly, CPG competes with pipelines that are existing and currently under construction to transport Rocky Mountain Major Customers: gas to other markets. Oneok Energy Services Company L.P. (195 BBtu/d) Expire in 2015. Encana Marketing (USA) Inc. (170 BBtu/d) Expire in 2015. Anadarko Petroleum Corporation (195 BBtu/d) Expire in 2015-2016. 8
  • 11. Exploration and Production Segment Our Exploration and Production segment’s current business strategy focuses on the exploration for and the acquisition, development and production of natural gas, oil and NGL in the United States, Brazil and Egypt. As of December 31, 2006, we controlled over 2.9 million net leasehold acres. During 2006, daily equivalent natural gas production averaged approximately 730 MMcfe/d and our proved natural gas and oil reserves at December 31, 2006, were approximately 2.4 Tcfe, excluding 0.2 Tcfe related to our unconsolidated investment in Four Star Oil & Gas Company. We have a balanced portfolio of development and exploration projects, including long-lived and shorter-lived properties divided into the following regions discussed below: United States Onshore. The Onshore region includes operations that are primarily focused on unconventional tight gas sands and coal bed methane producing areas, which are generally characterized by lower development costs, higher drilling success rates and longer reserve lives. We have a large inventory of drilling prospects in this region. During 2006, we invested $500 million on capital projects and production averaged 345 MMcfe/d. The principal operating areas are listed below: 2006 Average Net Capital Production Region Description Acres Investment (MMcfe/d) East Texas/north Concentrated land position primarily focused 104,000 $203 million 122 Louisiana on tight gas sands production in the Travis (Arklatex) Peak/Hosston and Cotton Valley formations. Black Warrior Basin Established shallow coal bed methane 172,000 $49 million 64 producing areas of northwestern Alabama. We have high average working interests in our operated properties in addition to an average 50 percent working interest covering approximately 46,000 net acres operated by Black Warrior Methane which produces from the Brookwood Field. Mid-Continent Primarily in Oklahoma with a focus on 319,000 $56 million 28 development projects in the Arkoma Basin where we utilize horizontal drilling in the Hartshorne Coals area, West Verdon field, an oil producing waterflood project and shallow natural gas production in the Hugoton field. Rocky Mountain Primarily in Wyoming and Utah with a 364,000 $120 million 55 (Rockies) focus in the Powder River and Uintah basins, consisting predominantly of operated oil fields utilizing both primary and secondary recovery methods combined with non-operated coal bed methane fields. We also operate the Altamont and Bluebell processing plants and related gathering systems in Utah. Raton Basin Primarily focused on coal bed methane 605,000 $72 million 76 production in northern New Mexico and southern Colorado where we own the minerals and have a 100 percent working interest in the Vermejo Park Ranch. Included in our Mid-Continent region is our interest in 127,000 net acres in the Illinois Basin, primarily in the New Albany Shale area in southwestern Indiana. We are the operator of these properties and maintain a 50 percent 9
  • 12. working interest in this large emerging area which is still under evaluation. We have drilled 22 wells through the end of 2006. Texas Gulf Coast. The Texas Gulf Coast region focuses on developing and exploring for tight gas sands in south Texas. In this area, we have an inventory of over 10,000 square miles of three dimensional (3D) seismic data. During 2006, we invested $217 million on capital projects and production averaged 187 MMcfe/d. The principal operating areas are listed below: 2006 Average Capital Production Region Description Net Acres Investment (MMcfe/d) Vicksburg/Frio Trends Includes concentrated and contiguous assets, 81,000 $111 million 123 located in south Texas, including the Jeffress and Monte Christo fields primarily in Hidalgo county, in which we have an average 90 percent working interest. Upper Gulf Coast Located onshore Texas Gulf Coast, 31,000 $60 million 32 Wilcox including Renger, Dry Hollow and Speaks fields in Lavaca County. In this area, average well depth is between 13,000 to 18,000 feet. South Texas Wilcox Includes the Bob West and Roleta fields in 25,000 $29 million 27 Zapata County where in January 2007 we completed the acquisition described below. In January 2007, we acquired operated producing properties and undeveloped acreage in Zapata County, Texas with an average working interest of 85 percent. These properties complement our existing south Texas Wilcox operations providing a re-entry into the Lobo trend and a multi-year drilling inventory with significant additional exploration and development drilling opportunities. The 23,000 net acres acquired had production of approximately 12 MMcfe/d on the acquisition date. Estimated proved reserves at the acquisition date were approximately 84 Bcfe, of which approximately 73 percent was undeveloped. Gulf of Mexico Shelf and south Louisiana. Our Gulf of Mexico shelf and south Louisiana operations are generally characterized by relatively high initial production rates, resulting in near-term cash flows, and high decline rates. During 2006, we invested $310 million on drilling, workover and facilities projects and production averaged 174 MMcfe/d. The principal operating areas are listed below: 2006 Average Capital Production Region Description Net Acres Investment (MMcfe/d) Gulf of Mexico Shelf Primarily deep shelf drilling interests in 173 688,000 $246 million 163 Blocks (generally nine square miles) south of the Louisiana, Texas and Alabama shorelines focused on deep (greater than 12,000 feet) gas reserves in relatively shallow waters depths (less than 400 feet). South Louisiana Primarily in Vermillion Parish and 34,000 $64 million 11 associated bays and waters in southwestern Louisiana covered by the Catapult 3D seismic project. We have internally processed 2,600 square miles of contiguous 3D seismic data in this project. 10
  • 13. Unconsolidated Investment in Four Star. We own a 43.1 percent investment in Four Star. Four Star operates onshore in the San Juan, Permian, Hugoton and South Alabama Basins and the Gulf of Mexico. During 2006, our proportionate share of Four Star’s daily equivalent natural gas production averaged approximately 68 MMcfe/d and at December 31, 2006, proved natural gas and oil reserves, net to our interest, were 222 Bcfe. In January 2007, Four Star acquired 79 wells in the San Juan basin that had daily production of approximately 5 MMcfe/d and proved reserves of 16 Bcfe, net to our interest, on the acquisition date. International Brazil. Our Brazil operations cover approximately 361,000 net acres. These operations include interests in 13 concessions located in the Espirito Santo, Potiguar and Camamu Basins, including our 35 percent working interest in the Pescada Arabaiana Fields in the Potiguar Basin. In 2006, we invested $80 million in capital projects in Brazil and production averaged approximately 24 MMcfe/d from the Pescada Arabaiana Fields. Egypt. Our Egypt operations include a 20 percent non-operated working interest in approximately 13,000 net acres in the South Feiran concession located in the Gulf of Suez, which is in the seismic, exploratory drilling and evaluation phases of the project. Our total funding commitment to the South Feiran concession is $3 million. In addition, we were the winning bidder of the South Mariut Block in the second quarter of 2006 with a $3 million payment due on final receipt of the concession and an agreement for a $22 million firm working commitment over three years. The block is approximately 1.2 million acres and is located onshore in the western part of the Nile Delta. We expect to receive formal governmental approvals and sign the concession agreement during the first quarter of 2007. 11
  • 14. Natural Gas and Oil Properties Natural Gas, Oil and Condensate and NGL Reserves and Production The table below presents our estimated proved reserves based on our internal reserve report as of December 31, 2006 by region and classification as well as our 2006 production by region. Net proved reserves exclude royalties and interests owned by others and reflect contractual arrangements and royalty obligations in effect at the time of the estimate.: Net Proved Reserves 2006 Total Natural Gas Oil/Condensate NGL Production (MMcf) (MBbls) (MBbls) (MMcfe) (Percent) (MMcfe) Reserves and Production by Region United States Onshore . . . . . . . . . . . . . . . . . 1,308,742 28,947 1,060 1,488,789 62% 126,093 Texas Gulf Coast . . . . . . . . . . 344,596 2,265 8,004 406,209 17% 68,269 Gulf of Mexico Shelf and south Louisiana . . . . . . . . . . 209,897 9,467 948 272,384 11% 63,537 Total United States . . . . . . . . . 1,863,235 40,679 10,012 2,167,382 90% 257,899 Brazil. . . . . . . . . . . . . . . . . . . . . 56,383 31,847 — 247,466 10% 8,619 Total . . . . . . . . . . . . . . . . . . . 1,919,618 72,526 10,012 2,414,848 100% 266,518 Unconsolidated investment in Four Star . . . . . . . . . . . . . . . . 167,046 2,947 6,209 221,984 100% 24,663 Reserves by Classification United States Producing . . . . . . . . . . . . . . . . 1,251,019 22,415 7,402 1,429,923 66% Non-Producing . . . . . . . . . . . . 217,881 7,201 1,263 268,665 12% Undeveloped. . . . . . . . . . . . . . 394,335 11,063 1,347 468,794 22% Total proved . . . . . . . . . . . . 1,863,235 40,679 10,012 2,167,382 100% Brazil Producing . . . . . . . . . . . . . . . . 19,931 489 — 22,864 9% Non-Producing . . . . . . . . . . . . 3,405 335 — 5,418 2% Undeveloped. . . . . . . . . . . . . . 33,047 31,023 — 219,184 89% Total proved . . . . . . . . . . . . 56,383 31,847 — 247,466 100% Worldwide Producing . . . . . . . . . . . . . . . . 1,270,950 22,904 7,402 1,452,787 60% Non-Producing . . . . . . . . . . . . 221,286 7,536 1,263 274,083 11% Undeveloped. . . . . . . . . . . . . . 427,382 42,086 1,347 687,978 29% Total proved . . . . . . . . . . . . 1,919,618 72,526 10,012 2,414,848 100% Unconsolidated investment in Four Star Producing . . . . . . . . . . . . . . . . 136,489 2,874 5,068 184,140 83% Non-Producing . . . . . . . . . . . . 2,733 — 26 2,892 1% Undeveloped. . . . . . . . . . . . . . 27,824 73 1,115 34,952 16% Total Four Star . . . . . . . . . . 167,046 2,947 6,209 221,984 100% 12
  • 15. Our consolidated reserves in the table above are consistent with estimates of reserves filed with other federal agencies except for differences of less than five percent resulting from actual production, acquisitions, property sales, necessary reserve revisions and additions to reflect actual experience. Ryder Scott Company, L.P. (Ryder Scott), an independent reservoir engineering firm that reports to the Audit Committee of our Board of Directors, prepared an estimate on 84 percent of our consolidated natural gas and oil reserves. Additionally, Ryder Scott prepared an estimate of 80 percent of the proved reserves of Four Star, our unconsolidated affiliate. Our estimates of Four Star’s proved natural gas and oil reserves are prepared by our internal reservoir engineers and do not reflect those prepared by the engineers of Four Star. Based on the amount of proved reserves determined by Ryder Scott, we believe our reported reserve amounts are reasonable. Ryder Scott’s reports are included as exhibits to this Annual Report on Form 10-K. There are numerous uncertainties inherent in estimating quantities of proved reserves, projecting future rates of production costs, and projecting the timing of development expenditures, including many factors beyond our control. Reservoir engineering is a subjective process of estimating underground accumulations of natural gas and oil that cannot be measured in an exact manner. The reserve data represents only estimates which are often different from the quantities of natural gas and oil that are ultimately recovered. The accuracy of any reserve estimate is highly dependent on the quality of available data, the accuracy of the assumptions on which they are based, and on engineering and geological interpretations and judgment. All estimates of proved reserves are determined according to the rules prescribed by the SEC. These rules indicate that the standard of “reasonable certainty” be applied to proved reserve estimates. This concept of reasonable certainty implies that as more technical data becomes available, a positive, or upward, revision is more likely than a negative, or downward, revision. Estimates are subject to revision based upon a number of factors, including reservoir performance, prices, economic conditions and government restrictions. In addition, results of drilling, testing and production subsequent to the date of an estimate may justify revision of that estimate. In general, the volume of production from natural gas and oil properties we own declines as reserves are depleted. Except to the extent we conduct successful exploration and development activities or acquire additional properties containing proved reserves, or both, our proved reserves will decline as reserves are produced. Recovery of proved undeveloped reserves requires significant capital expenditures and successful drilling operations. The reserve data assumes that we can and will make these expenditures and conduct these operations successfully, but future events, including commodity price changes, may cause these assumptions to change. In addition, estimates of proved undeveloped reserves and proved non-producing reserves are subject to greater uncertainties than estimates of proved producing reserves. For further discussion of our reserves, see Part II, Item 8, Financial Statements and Supplementary Data, under the heading Supplemental Natural Gas and Oil Operations. Acreage and Wells The following tables detail (i) our interest in developed and undeveloped acreage at December 31, 2006, (ii) our interest in natural gas and oil wells at December 31, 2006 and (iii) our exploratory and development wells drilled during the years 2004 through 2006. Any acreage in which our interest is limited to owned royalty, overriding royalty and other similar interests is excluded. Developed Undeveloped Total Gross(1) Net(2) Gross(1) Net(2) Gross(1) Net(2) Acreage United States Onshore . . . . . . . . . . . . . . . . . . . . . . . . . . . . 874,525 556,828 1,612,025 1,135,010 2,486,550 1,691,838 Texas Gulf Coast. . . . . . . . . . . . . . . . . . . . . . 93,573 73,373 91,230 63,452 184,803 136,825 Gulf of Mexico Shelf and south Louisiana . . . . 508,716 359,064 401,075 363,046 909,791 722,110 Total . . . . . . . . . . . . . . . . . . . . . . . . . . . . 1,476,814 989,265 2,104,330 1,561,508 3,581,144 2,550,773 Brazil . . . . . . . . . . . . . . . . . . . . . . . . . . . . . . . 49,262 17,242 1,158,643 343,563 1,207,905 360,805 Egypt . . . . . . . . . . . . . . . . . . . . . . . . . . . . . . . — — 64,740 12,948 64,740 12,948 Worldwide Total . . . . . . . . . . . . . . . . . . . . 1,526,076 1,006,507 3,327,713 1,918,019 4,853,789 2,924,526 13
  • 16. In the United States, our net developed acreage is concentrated primarily in the Gulf of Mexico (36 percent), Utah (13 percent), Texas (9 percent), Alabama (9 percent), New Mexico (9 percent), Oklahoma (8 percent) and Louisiana (7 percent). Our net undeveloped acreage is concentrated primarily in New Mexico (31 percent), the Gulf of Mexico (22 percent), Wyoming (10 percent), West Virginia (8 percent), Indiana (7 percent), Alabama (5 percent), Texas (4 percent) and Louisiana (3 percent). Approximately 23 percent, 20 percent and 8 percent of our total United States net undeveloped acreage is held under leases that have minimum remaining primary terms expiring in 2007, 2008 and 2009. Approximately 16 percent, 25 percent and 12 percent of our total Brazilian net undeveloped acreage is held under leases that have minimum remaining primary terms expiring in 2007, 2008 and 2009. Approximately 33 percent of our total Egyptian net undeveloped acreage is held under leases that have minimum remaining primary terms expiring in 2008. We employ various techniques to manage the expiration of leases, including extending lease terms, drilling the acreage ourselves, or through farm-out agreements with other operators. Wells Being Drilled at December 31, Natural Gas Oil Total 2006 Gross(1) Net(2) Gross(1) Net(2) Gross(1) Net(2)(3) Gross(1) Net(2) Productive Wells United States Onshore . . . . . . . . . ... ........ 3,880 2,954 801 548 4,681 3,502 52 38 Texas Gulf Coast . . . ... ........ 843 703 — — 843 703 6 5 Gulf of Mexico Shelf and south Louisiana . . . . . . . ... ........ 187 122 58 40 245 162 6 4 Total . . . . . . . . . . . . . . . . . . . . . 4,910 3,779 859 588 5,769 4,367 64 47 Brazil . . . . . . . . . . . . . . . . . . . . . . . . 4 1 6 2 10 3 — — Worldwide Total . . . . . . . . . . . . . 4,914 3,780 865 590 5,779 4,370 64 47 Net Exploratory(2) Net Development(2) 2006 2005 2004 2006 2005 2004 Wells Drilled United States Productive . . . . . . . . . . . . . . . . . . . . . . . . . . . . . . . . . . . . . . . . . . . . . 106 86 13 319 279 298 Dry . . . . . . . . . . . . . . . . . . . . . . . . . . . . . . . . . . . . . . . . . . . . . . . . . . 6 2 10 2 4 3 Total . . . . . . . . . . . . . . . . . . . . . . . . . . . . . . . . . . . . . . . . . . . . . . . 112 88 23 321 283 301 Brazil Productive . . . . . . . . . . . . . . . . . . . . . . . . . . . . . . . . . . . . . . . . . . . . . — — — — — — Dry . . . . . . . . . . . . . . . . . . . . . . . . . . . . . . . . . . . . . . . . . . . . . . . . . . — — 1 — — — Total . . . . . . . . . . . . . . . . . . . . . . . . . . . . . . . . . . . . . . . . . . . . . . . — — 1 — — — Worldwide Productive . . . . . . . . . . . . . . . . . . . . . . . . . . . . . . . . . . . . . . . . . . . . . 106 86 13 319 279 298 Dry . . . . . . . . . . . . . . . . . . . . . . . . . . . . . . . . . . . . . . . . . . . . . . . . . . 6 2 11 2 4 3 Total . . . . . . . . . . . . . . . . . . . . . . . . . . . . . . . . . . . . . . . . . . . . . . . 112 88 24 321 283 301 (1) Gross interest reflects the total acreage or wells we participated in, regardless of our ownership interest in the acreage or wells. (2) Net interest is the aggregate of the fractional working interests that we have in the gross acreage, gross wells or gross wells drilled. (3) At December 31, 2006, we operated 3,957 of the 4,370 net productive wells. The drilling performance above should not be considered indicative of future drilling performance, nor should it be assumed that there is any correlation between the number of productive wells drilled and the amount of natural gas and oil that may ultimately be recovered. 14
  • 17. Net Production, Sales Prices, Transportation and Production Costs The following table details our net production volumes, average sales prices received, average transportation costs and average production costs (including production taxes) associated with the sale of natural gas and oil for each of the three years ended December 31: 2006 2005 2004 Consolidated Volumes, Prices, and Costs per Unit: Net Production Volumes United States Natural gas (MMcf) . . . . . . . . . . . . . . . . . . . . ......... 213,262 206,714 238,009 Oil, condensate and NGL (MBbls) . . . . . . . . . ......... 7,439 7,516 8,498 Total (MMcfe) . . . . . . . . . . . . . . . . . . . . . ......... 257,899 251,807 288,994 Brazil(1) Natural gas (MMcf) . . . . . . . . . . . . . . . . . . . . ......... 7,140 15,578 6,848 Oil, condensate and NGL (MBbls) . . . . . . . . . ......... 247 620 320 Total (MMcfe) . . . . . . . . . . . . . . . . . . . . . ......... 8,619 19,300 8,772 Worldwide Natural gas (MMcf) . . . . . . . . . . . . . . . . . . . . ......... 220,402 222,292 244,857 Oil, condensate and NGL (MBbls) . . . . . . . . . ......... 7,686 8,136 8,818 Total (MMcfe) . . . . . . . . . . . . . . . . . . . . . ......... 266,518 271,107 297,766 Total (MMcfe/d) . . . . . . . . . . . . . . . . . . . ......... 730 743 814 Natural Gas Average Realized Sales Price ($/Mcf) United States Excluding hedges . . . . . . . . . . . . . . . . . . . . . . ......... $ 6.77 $ 7.92 $ 6.02 Including hedges . . . . . . . . . . . . . . . . . . . . . . . ......... $ 6.50 $ 6.69 $ 5.94 Brazil Excluding hedges . . . . . . . . . . . . . . . . . . . . . . ......... $ 2.61 $ 2.33 $ 2.01 Including hedges . . . . . . . . . . . . . . . . . . . . . . . ......... $ 2.61 $ 2.33 $ 2.01 Worldwide Excluding hedges . . . . . . . . . . . . . . . . . . . . . . ......... $ 6.64 $ 7.53 $ 5.90 Including hedges . . . . . . . . . . . . . . . . . . . . . . . ......... $ 6.38 $ 6.39 $ 5.83 Oil, Condensate, and NGL Average Realized Sales Price ($/Bbl) United States Excluding hedges . . . . . . . . . . . . . . . . . . . . . . . . . . . . . . . $ 55.95 $ 45.86 $ 34.44 Including hedges . . . . . . . . . . . . . . . . . . . . . . . . . . . . . . . . $ 55.95 $ 45.86 $ 34.44 Brazil Excluding hedges . . . . . . . . . . . . . . . . . . . . . . . . . . . . . . . $ 64.02 $ 53.42 $ 43.01 Including hedges . . . . . . . . . . . . . . . . . . . . . . . . . . . . . . . . $ 54.48 $ 42.42 $ 39.19 Worldwide Excluding hedges . . . . . . . . . . . . . . . . . . . . . . . . . . . . . . . $ 56.21 $ 46.43 $ 34.75 Including hedges . . . . . . . . . . . . . . . . . . . . . . . . . . . . . . . . $ 55.90 $ 45.60 $ 34.61 Average Transportation Cost United States Natural gas ($/Mcf) . . . . . . . . . . . . . . . . . . . . ......... $ 0.24 $ 0.20 $ 0.17 Oil, condensate and NGL ($/Bbl) . . . . . . . . . . ......... $ 0.85 $ 0.69 $ 1.16 Worldwide Natural gas ($/Mcf) . . . . . . . . . . . . . . . . . . . . ......... $ 0.23 $ 0.18 $ 0.17 Oil, condensate and NGL ($/Bbl) . . . . . . . . . . ......... $ 0.82 $ 0.63 $ 1.12 Average Production Cost($/Mcfe)(2) United States Average lease operating cost . . . . . . . . . . . . . . . . . . . . . . . $ 0.97 $ 0.73 $ 0.62 Average production taxes . . . . . . . . . . . . . . . . . . . . . . . . . 0.28 0.27 0.11 Total production cost . . . . . . . . . . . . . . . . . . . . . . . . . $ 1.25 $ 1.00 $ 0.73 15
  • 18. 2006 2005 2004 Brazil Average lease operating cost . . . . . . . . . . . . . . . . . . . . . . . $ 0.28 $ 0.42 $ — Average production taxes . . . . . . . . . . . . . . . . . . . . . . . . . 0.53 — — Total production cost . . . . . . . . . . . . . . . . . . . . . . . . . $ 0.81 $ 0.42 $ — Worldwide Average lease operating cost . . . . . . . . . . . . . . . . . . . . . . . $ 0.95 $ 0.72 $ 0.60 Average production taxes . . . . . . . . . . . . . . . . . . . . . . . . . 0.29 0.24 0.11 Total production cost . . . . . . . . . . . . . . . . . . . . . . . . . $ 1.24 $ 0.96 $ 0.71 Unconsolidated affiliate volumes (Four Star)(3) Natural gas (MMcf) . . . . . . . . . . . . . . . . . . ......... 18,140 6,689 Oil, condensate and NGL (MBbls) . . . . . . . . ......... 1,087 359 Total equivalent volumes MMcfe . . . . . . . . . . . . . . . . . . . . . . . . . . ......... 24,663 8,844 MMcfe/d . . . . . . . . . . . . . . . . . . . . . . . . . ......... 68 24 (1) Production volumes in Brazil decreased due to a contractual reduction of our ownership interest in the Pescada-Arabaiana Field in 2006. (2) Production cost includes lease operating costs and production related taxes (including ad valorem and severance taxes). (3) Includes our proportionate share of volumes in Four Star which was acquired in the third quarter of 2005. Acquisition, Development and Exploration Expenditures The following table details information regarding the costs incurred in our acquisition, development and exploration activities for each of the three years ended December 31: 2006 2005 2004 (In millions) United States Acquisition Costs: Proved . . . . . . . . . . . . . . . . . . . . . . . . . . . . . . . . . . . . . . . . . . . . . . $ 2 $ 643 $ 33 Unproved . . . . . . . . . . . . . . . . . . . . . . . . . . . . . . . . . . . . . . . . . . . . 34 143 32 Development Costs . . . . . . . . . . . . . . . . . . . . . . . . . . . . . . . . . . . . . . 738 503 395 Exploration Costs: Delay rentals . . . . . . . . . . . . . . . . . . . . . . . . . . . . . . . . . . . . . . . . . 6 3 7 Seismic acquisition and reprocessing . . . . . . . . . . . . . . . . . . . . . . . . 23 7 29 Drilling . . . . . . . . . . . . . . . . . . . . . . . . . . . . . . . . . . . . . . . . . . . . . 294 133 149 Asset Retirement Obligations . . . . . . . . . . . . . . . . . . . . . . . . . . . . . . . 3 1 30 Total full cost pool expenditures . . . . . . . . . . . . . . . . . . . . . . . . . . . 1,100 1,433 675 Non-full cost pool expenditures. . . . . . . . . . . . . . . . . . . . . . . . . . . . 8 22 11 Total cost incurred(1) . . . . . . . . . . . . . . . . . . . . . . . . . . . . . . . . . . $1,108 $1,455 $686 (1) Acquisition of unconsolidated investment in Four Star ........... $ — $ 769 $— Brazil and Other International Acquisition Costs: Proved . . . . . . . . . . . . . . . . . . . . . . . . . . . . . . . . . . . . . . . . . . . . . . $ 2 $ 8 $ 69 Unproved . . . . . . . . . . . . . . . . . . . . . . . . . . . . . . . . . . . . . . . . . . . . 1 1 3 Development Costs . . . . . . . . . . . . . . . . . . . . . . . . . . . . . . . . . . . . . . 40 6 1 Exploration Costs: Seismic acquisition and reprocessing . . . . . . . . . . . . . . . . . . . . . . . . 7 7 15 Drilling . . . . . . . . . . . . . . . . . . . . . . . . . . . . . . . . . . . . . . . . . . . . . 46 8 10 16
  • 19. 2006 2005 2004 (In millions) Asset Retirement Obligations . . . . . . . . . . . . . . . . . . . . . . . . . . . . . . . — — 3 Total full cost pool expenditures . . . . . . . . . . . . . . . . . . . . . . . . . . . 96 30 101 Non-full cost pool expenditures. . . . . . . . . . . . . . . . . . . . . . . . . . . . — — 3 Total cost incurred . . . . . . . . . . . . . . . . . . . . . . . . . . . . . . . . . . . $ 96 $ 30 $104 Worldwide Acquisition Costs: Proved . . . . . . . . . . . . . . . . . . . . . . . . . . . . . . . . . . . . . . . . . . . . . . $ 4 $ 651 $102 Unproved . . . . . . . . . . . . . . . . . . . . . . . . . . . . . . . . . . . . . . . . . . . . 35 144 35 Development Costs . . . . . . . . . . . . . . . . . . . . . . . . . . . . . . . . . . . . . . 778 509 396 Exploration Costs: Delay rentals . . . . . . . . . . . . . . . . . . . . . . . . . . . . . . . . . . . . . . . . . 6 3 7 Seismic acquisition and reprocessing . . . . . . . . . . . . . . . . . . . . . . . . 30 14 44 Drilling . . . . . . . . . . . . . . . . . . . . . . . . . . . . . . . . . . . . . . . . . . . . . 340 141 159 Asset Retirement Obligations . . . . . . . . . . . . . . . . . . . . . . . . . . . . . . . 3 1 33 Total full cost pool expenditures . . . . . . . . . . . . . . . . . . . . . . . . . . . 1,196 1,463 776 Non-full cost pool expenditures. . . . . . . . . . . . . . . . . . . . . . . . . . . . 8 22 14 Total cost incurred(1) . . . . . . . . . . . . . . . . . . . . . . . . . . . . . . . . . . $1,204 $1,485 $790 (1) Acquisition of unconsolidated investment in Four Star ........... $ — $ 769 $— (1) In 2005, amount includes $179 million of deferred income tax adjustments related to the acquisition of full-cost pool properties and $217 million related to the acquisition of our unconsolidated investment in Four Star. We spent approximately $192 million in 2006, $247 million in 2005 and $156 million in 2004 to develop proved undeveloped reserves that were included in our reserve report as of January 1 of each year. Markets and Competition We primarily sell our domestic natural gas and oil to third parties through our Marketing segment at spot market prices, subject to customary adjustments. We sell our NGL at market prices under monthly or long-term contracts, subject to customary adjustments. In Brazil, we sell the majority of our natural gas and oil to Petrobras, Brazil’s state-owned energy company. We also enter into derivative contracts on our natural gas and oil production to stabilize our cash flows, reduce the risk and financial impact of downward commodity price movements and to protect the economic assumptions associated with our capital investment programs. As of December 31, 2006, we had entered into derivative contracts on approximately 133,000 BBtu of our anticipated natural gas production in 2007 and approximately 21,000 BBtu of our total anticipated natural gas production from 2008 through 2012. We also have derivative contracts on our Brazilian oil production that provides us with a fixed price on approximately 192 MBbls in 2007. For a further discussion of these contracts, see Part II, Item 7, Management’s Discussion and Analysis of Financial Condition and Results of Operations. Our Marketing segment has also entered into additional production related derivative contracts as further described below. The exploration and production business is highly competitive in the search for and acquisition of additional natural gas and oil reserves and in the sale of natural gas, oil and NGL. Our competitors include major and intermediate sized natural gas and oil companies, independent natural gas and oil operators and individual producers or operators with varying scopes of operations and financial resources. Competitive factors include price and contract terms, our ability to access drilling and other equipment and our ability to hire and retain skilled personnel on a timely and cost effective basis. Ultimately, our future success in the exploration and production business will be dependent on our ability to find or acquire additional reserves at costs that yield acceptable returns on the capital invested. 17
  • 20. Marketing Segment Our Marketing segment’s primary focus is to market our Exploration and Production segment’s natural gas and oil production and to manage the company’s overall price risk, primarily through the use of natural gas and oil derivative contracts. In addition, we continue to manage and liquidate various natural gas supply, transportation, power and other natural gas related contracts remaining from our historical trading activities, which were primarily entered into prior to the deterioration of the energy trading environment in 2002. As of December 31, 2006, we managed the following types of contacts: • Production-Related Natural Gas and Oil Derivatives. Includes options that provide price protection on our Exploration and Production segment’s natural gas and oil production. • Natural Gas Transportation-Related Contracts. Includes contracts that provide transportation capacity primarily with our affiliates. • Historical Natural Gas and Power Contracts. Includes supply agreements with Midland Cogeneration Venture and power contracts in the Pennsylvania-New Jersey-Maryland region. Production-Related Natural Gas and Oil Derivatives Our natural gas and oil contracts include options designed to provide price protection to El Paso from fluctuations in natural gas and oil prices. These contracts are in addition to contracts entered into by our Exploration and Production segment described on page 12. For a further discussion of the entirety of El Paso’s production- related price risk management activities, refer to our liquidity discussion beginning on page 62. As of December 31, 2006, Marketing’s contracts provided El Paso with price protection on the following quantities of future natural gas and oil production: 2007 2008 2009 Natural Gas (TBtu) Volumes with floor price . . . . . . . . . . . . . . . . . . . . . . . . . . . . . . . . . . . . . . . . . 89 18 17 Volumes with ceiling price . . . . . . . . . . . . . . . . . . . . . . . . . . . . . . . . . . . . . . . — 18 17 Oil (MBbls) Volumes with floor and ceiling prices . . . . . . . . . . . . . . . . . . . . . . . . . . . . . . . 1,009 930 — Contracts Related to Historical Trading Operations Natural gas transportation-related contracts. Our transportation contracts give us the right to transport natural gas using pipeline capacity for a fixed reservation charge plus variable transportation costs. We typically refer to the fixed reservation cost as a demand charge. Our ability to utilize our transportation capacity under these contracts is dependent on several factors, including the difference in natural gas prices at receipt and delivery locations along the pipeline system, the amount of working capital needed to use this capacity and the capacity required to meet our other long-term obligations. The following table details our transportation contracts as of December 31, 2006: Affiliated Pipelines(1) Alliance Pipeline Other Pipelines Daily capacity (MMBtu/d). . . . . . . . . . . . . . . 160,000 521,000 156,000 October 31, 2007(2) Expiration . . . . . . . . . . . . . . . . . . . . . . . . . . . 2008 to 2028 2007 to 2026 Receipt points . . . . . . . . . . . . . . . . . . . . . . . . AECO Canada Various Various Delivery points . . . . . . . . . . . . . . . . . . . . . . . Chicago Various Various (1) Primarily consists of contracts with TGP and EPNG. (2) In December 2006, we paid a third party to assume our capacity obligations under this contract beginning November 1, 2007 through the contractual term of the contract which ends in 2015. Other natural gas contracts. As of December 31, 2006, we had a variety of natural gas derivative contracts and long-term gas supply obligations, including ten significant physical natural gas contracts with power plants associated with our historical trading activities. These contracts obligate us to sell gas to these plants and have 18
  • 21. various expiration dates ranging from 2008 to 2028, with expected obligations under individual contracts with third parties ranging from 21,500 to 130,000 MMBtu/d. Power contracts. As of December 31, 2006, we had four derivative contracts that require us to swap locational differences in power prices between four power plants in the Pennsylvania-New Jersey-Maryland (PJM) eastern region with the PJM west hub. In total, these contracts require us annually to swap locational differences in power prices on approximately 4,000 GWh of power through 2008, 3,700 GWh from 2009 to 2013 and 1,700 GWh from 2014 to 2016. Additionally, these contracts require us to provide installed capacity of approximately 71 GWh in the PJM power pool through 2016. While we have basis and capacity risk associated with the contracts, we do not have commodity risk associated with these contracts due to positions we put in place in 2005 and 2006. Markets and Competition Our Marketing segment operates in a highly competitive environment, competing on the basis of price, operating efficiency, technological advances, experience in the marketplace and counterparty credit. Each market served is influenced directly or indirectly by energy market economics. Our primary competitors include: • Major oil and natural gas producers and their affiliates; • Large domestic and foreign utility companies; • Large local distribution companies and their affiliates; • Other interstate and intrastate pipelines and their affiliates; and • Independent energy marketers and power producers with varying scopes of operations and financial resources. Power Segment As of December 31, 2006, our Power segment primarily included the ownership and operation of investments in international power generation facilities listed in the table below. These facilities primarily sell power under long- term power purchase agreements with power transmission and distribution companies owned by local governments. As a result, we are subject to certain political risks related to these facilities. We currently expect to complete the sale of substantially all of the Asian and Central American facilities in the first half of 2007. El Paso Expiration Ownership Gross Year of Power Project Area Interest Capacity Power Purchaser Sales Contracts Fuel Type (Percent) (MW) Brazil Manaus(1) . . . . . . . . .. Brazil 100 238 Manaus Energia 2008 Oil Porto Velho(2) . . . . . . .. Brazil 50 404 Eletronorte 2010, 2023 Oil Rio Negro(1) . . . . . . . .. Brazil 100 158 Manaus Energia 2008 Oil Asia & Central America Habibullah . . . . . . . . . . Pakistan 50 136 Pakistan Water and Power 2029 Natural Gas Saba Power Co. . . . . . . Pakistan 94 128 Pakistan Water and Power 2029 Residual Fuel Oil Khulna Power Co. . . . . Bangladesh 74 113 BPDB 2013 Heavy Fuel Oil Tipitapa . . . . . . . . . . . . Nicaragua 60 51 Union Fenosa 2014 Heavy Fuel Oil (1) Ownership of these plants will transfer to the power purchaser no later than January 2008. (2) The power purchaser has approached us with the opportunity to sell them our interest in the facility. In addition to the international power plants above, we also have investments in two operating pipelines in South America with a total design capacity and average 2006 throughput of 1,197 MMcf/d and 1,037 BBtu/d, unadjusted for our ownership interest. We also have an interest in a pipeline project in Brazil that is in the development stage. Regulatory Environment Pipelines. Our interstate natural gas transmission systems and storage operations are regulated by the FERC under the Natural Gas Act of 1938, the Natural Gas Policy Act of 1978 and the Energy Policy Act of 2005. Each of 19