SlideShare uma empresa Scribd logo
1 de 10
Baixar para ler offline
TRIBUNE COMPANY
                                            FOURTH QUARTER RESULTS OF OPERATIONS (Unaudited)
                                                     (In thousands, except per share data)


                                                                               FOURTH QUARTER (A)
                                                                                                        %
                                                                        2006             2005         Change

OPERATING REVENUES                                                  $   1,466,853    $ 1,391,996           5.4
OPERATING EXPENSES (B)                                                  1,143,500      1,128,286           1.3

OPERATING PROFIT (C)                                                     323,353         263,710          22.6

Net Income on Equity Investments                                           29,465         20,790         41.7
Interest and Dividend Income                                                4,815          2,404        100.3
Interest Expense                                                          (93,527)       (46,116)       102.8
Non-Operating Items (D)                                                    59,865        (20,366)         NM

Income from Continuing Operations Before Income Taxes                    323,971         220,422          47.0

Income Taxes (D)                                                          (91,885)       (89,237)          3.0

Income from Continuing Operations                                        232,086         131,185          76.9

Income from Discontinued Operations, net of tax (E)                        6,971           3,256        114.1

NET INCOME                                                               239,057         134,441          77.8

Preferred Dividends                                                            -          (2,094)       (100.0)

Net Income Attributable to Common Shares                            $    239,057     $   132,347          80.6

EARNINGS PER SHARE
  Basic
     Continuing Operations                                          $         .97    $          .42     131.0
     Discontinued Operations                                                  .03               .01     200.0
     Net Income                                                     $        1.00    $          .43     132.6

   Diluted (F)
      Continuing Operations                                         $          .96   $          .42     128.6
      Discontinued Operations                                                  .03              .01     200.0
      Net Income                                                    $          .99   $          .43     130.2

DIVIDENDS PER COMMON SHARE                                          $          .18   $          .18        -

Diluted Weighted Average Common Shares Outstanding (G)                   241,380         309,307         (22.0)


                                                                    9
(A)   2006 fourth quarter: Sept. 25, 2006 to Dec. 31, 2006. (14 weeks)
      2005 fourth quarter: Sept. 26, 2005 to Dec. 25, 2005. (13 weeks)

(B)   Operating expenses for the fourth quarter of 2006 included $5 million, or $.01 per diluted share, of stock-based compensation expense ($3 million at
      Publishing, $1 million at Broadcasting and Entertainment and $1 million at Corporate), a charge of $7 million, or $.02 per diluted share, for the
      elimination of approximately 400 positions at Publishing, a charge of $4 million, or $.01 per diluted share, for the disposition of a press from the Los
      Angeles Times San Fernando Valley printing facility, and a $7 million gain, or $.02 per diluted share, related to the sale of the corporate airplane.
      Operating expenses for the fourth quarter of 2005 included a charge of $22 million, or $.04 per diluted share, related to the shutdown of the San Fernando
      Valley printing facility, a charge of $45 million, or $.09 per diluted share, ($43 million at Publishing, $1 million at Broadcasting and Entertainment and $1
      million at Corporate) related to the elimination of approximately 900 positions, and a pension curtailment gain of $18 million, or $.03 per diluted share ($13
      million at Publishing, $1 million at Broadcasting and Entertainment and $4 million at Corporate).

(C)   Operating profit excludes interest and dividend income, interest expense, equity income and losses, non-operating items
      and income taxes.

(D)   The fourth quarter of 2006 included the following non-operating items:
                                                                                    Pretax            After-tax
                                                                                  Gain (Loss)        Gain (Loss)      Diluted EPS

      Gain on derivatives and related investments (1)                            $      45,272      $     27,616       $       .11
      Gain on sales of investments, net (2)                                             15,920             9,645               .04
      Other, net                                                                        (1,327)           (1,218)                -
      Income tax adjustments (3)                                                           -              33,338               .14
      Total non-operating items                                                  $      59,865      $     69,381       $       .29

      The fourth quarter of 2005 included the following non-operating items:
                                                                                   Pretax             After-tax
                                                                                 Gain (Loss)         Gain (Loss)      Diluted EPS

      Loss on derivatives and related investments (1)                            $     (24,486)     $     (14,937)     $      (.05)
      Gain on sales of subsidiaries and investments, net                                 3,885              2,370              .01
      Other, net                                                                           235                143                -
      Total non-operating items                                                  $     (20,366)     $     (12,424)     $      (.04)

      (1) Gain (loss) on derivatives and related investments represents the net change in fair values of the derivative component of the Company's PHONES
          and the related Time Warner shares.

      (2) The 2006 gain consists primarily of the gain on the sale of the Company's investment in BrassRing.

      (3) In the fourth quarter of 2006, the Company recorded a favorable $33 million income tax expense adjustment, most of which related to the Company's
          PHONES as a result of reaching an agreement with the Internal Revenue Service appeals office pertaining to the deduction of interest expense on
          the PHONES.

(E)   In June 2006, the Company announced agreements to sell its Atlanta and Albany television stations. The sale of Atlanta closed in August 2006. In
      September 2006, the Company announced an agreement to sell its Boston television station. The sales of Albany and Boston closed in December 2006.
      Operating results for these stations are now reported as discontinued operations. Income from discontinued operations in the fourth quarter included
      the following:

                                                                                        Fourth Quarter
                                                                                      2006           2005

      (Loss) income from operations, net of tax (1)                              $      (2,289)     $       3,256
      Gain on sale, net of tax (2)                                                       9,260                -
      Total                                                                      $       6,971      $       3,256

      (1) The fourth quarter of 2006 included a charge of approximately $3 million, net of tax, for severance and related costs.

      (2) In the fourth quarter of 2006, the Company recorded a pretax gain on the sale of Boston of $41 million ($9.3 million after taxes). The pretax gain
          calculation reflected $45 million of allocated television group goodwill. In accordance with Financial Accounting Standard (quot;FASquot;) No. 142, quot;Goodwill
          and Other Intangible Assetsquot;, the Company aggregates all of its television stations into one reporting unit for goodwill accounting purposes.
          Although less than $.1 million of goodwill was recorded when the Boston station was acquired, FAS 142 requires the Company to allocate a portion
          of its television group goodwill to stations that are sold based on the fair value of the stations, relative to the fair value of the Company's remaining
          stations. The Company incurred an after-tax loss on the sale of Albany, which was recorded when the sale was announced in the second quarter
          of 2006.


                                                                                 10
(F)   For the fourth quarters of 2006 and 2005, weighted average common shares outstanding used in the calculations of diluted earnings per share (quot;EPSquot;)
      were adjusted for the dilutive effect of stock-based compensation grants. All of the Company's Series C, D-1, and D-2 preferred shares were issued to and
      held by TMCT, LLC and TMCT II, LLC. In connection with a restructuring of these partnerships, all of these preferred shares were distributed to the
      Company on Sept. 22, 2006 and are no longer outstanding. The Company's Series C, D-1 and D-2 convertible preferred shares were not included in the
      calculation of diluted EPS for the fourth quarter of 2005 because their effects were antidilutive. Following are the calculations for the fourth quarter:


                                                                                      Fourth Quarter
                                                                                    2006           2005

      Income from continuing operations                                        $     232,086      $    131,185
      Income from discontinued operations, net of tax                                  6,971             3,256
      Net income                                                               $     239,057      $    134,441
      Dividends for Series C, D-1 and D-2 preferred stock                                -              (2,094)
      Net income attributable to common shares                                 $     239,057      $    132,347

      Weighted average common shares outstanding                                     238,988           307,402
      Adjustment for stock-based compensation grants                                   2,392             1,905
      Adjusted weighted average common
       shares outstanding                                                            241,380           309,307

      Diluted earnings per share:
       Continuing operations                                                   $          .96     $         .42
       Discontinued operations                                                            .03               .01
       Net income                                                              $          .99     $         .43

(G)   The number of common shares outstanding, in thousands, at Dec. 31, 2006 was 239,207.


                                                                               11
TRIBUNE COMPANY
                                                 FULL YEAR RESULTS OF OPERATIONS (Unaudited)
                                                        (In thousands, except per share data)


                                                                                         FULL YEAR (A)
                                                                                                                %
                                                                            2006                 2005         Change

OPERATING REVENUES                                                     $    5,517,708       $ 5,511,283            0.1
OPERATING EXPENSES (B)                                                      4,432,698         4,384,092            1.1

OPERATING PROFIT (C)                                                        1,085,010           1,127,191         (3.7)

Net Income on Equity Investments (D)                                          80,773              41,209         96.0
Interest and Dividend Income                                                  14,145               7,539         87.6
Interest Expense                                                            (273,902)           (155,191)        76.5
Non-Operating Items (E)                                                      102,969              69,861         47.4

Income from Continuing Operations Before Income Taxes                       1,008,995           1,090,609         (7.5)

Income Taxes (E)                                                            (348,142)           (567,820)        (38.7)

Income from Continuing Operations                                            660,853             522,789         26.4

(Loss) Income from Discontinued Operations, net of tax (F)                    (66,858)            11,900           NM

NET INCOME                                                                   593,995             534,689         11.1

Preferred Dividends                                                            (6,309)             (8,364)       (24.6)

Net Income Attributable to Common Shares                               $     587,686        $    526,325         11.7

EARNINGS PER SHARE
  Basic
     Continuing Operations                                             $         2.40       $        1.64        46.3
     Discontinued Operations                                                     (.25)                .04         NM
     Net Income                                                        $         2.16       $        1.68        28.6

   Diluted (G)
      Continuing Operations                                            $         2.39       $        1.63        46.6
      Discontinued Operations                                                    (.24)                .04         NM
      Net Income                                                       $         2.14       $        1.67        28.1

DIVIDENDS PER COMMON SHARE                                             $           .72      $           .72       -

Diluted Weighted Average Common Shares Outstanding (H)                       274,411             315,338         (13.0)


                                                                       12
(A)   2006 full year: Dec. 26, 2005 to Dec. 31, 2006. (53 weeks)
      2005 full year: Dec. 27, 2004 to Dec. 25, 2005. (52 weeks)

(B)   Operating expenses for 2006 included stock-based compensation expense of $32 million, or $.07 per diluted share, ($15 million at Publishing, $6 million
      at Broadcasting and Entertainment and $11 million at Corporate), a charge of $20 million, or $.04 per diluted share, for severance and other payments
      associated with the new union contracts at Newsday, a charge of $9 million, or $.02 per diluted share, for the elimination of approximately 400 positions
      at Publishing, a charge of $4 million, or $.01 per diluted share, for the disposition of a press at the Los Angeles Times San Fernando Valley printing
      facility, a gain of $7 million, or $.02 per diluted share, from the sale of the corporate airplane, and a gain of $7 million, or $.02 per diluted share, from
      real property sales in Publishing. Operating expenses for 2005 included a charge of $22 million, or $.04 per diluted share, related to the shutdown of
      the San Fernando Valley printing facility, a charge of $45 million, or $.09 per diluted share, ($43 million at Publishing, $1 million at Broadcasting and
      Entertainment and $1 million at Corporate) related to the elimination of approximately 900 positions, and a pension curtailment gain of $18 million, or $.03
      per diluted share ($13 million at Publishing, $1 million at Broadcasting and Entertainment and $4 million at Corporate).

(C)   Operating profit excludes interest and dividend income, interest expense, equity income and losses, non-operating items and income taxes.

(D)   Net income on equity investments for the full year 2006 included the Company's $5.9 million share of a one-time favorable income tax adjustment at
      CareerBuilder.

(E)   The full year 2006 included the following non-operating items:
                                                                                   Pretax            After-tax
                                                                                 Gain (Loss)        Gain (Loss)      Diluted EPS

      Gain on derivatives and related investments (1)                           $      11,088       $      6,764      $       .02
      Gain on TMCT transactions (2)                                                    59,596             47,988              .17
      Gain on sales of investments, net (3)                                            36,732             22,339              .08
      Other, net                                                                       (4,447)            (1,044)             -
      Income tax adjustments (4)                                                          -               33,563              .12
      Total non-operating items                                                 $     102,969       $    109,610      $       .40

      The full year 2005 included the following non-operating items:
                                                                                     Pretax          After-tax
                                                                                     Gain           Gain (Loss)      Diluted EPS

      Gain on derivatives and related investments (1)                           $      62,184       $   37,932        $       .12
      Gain on sales of investments, net                                                 6,780            4,136                .01
      Other, net                                                                          897              547                .01
      Income tax adjustments (5)                                                          -           (138,664)              (.44)
      Total non-operating items                                                 $      69,861       $ (96,049)        $      (.30)

      (1) Gain (loss) on derivatives and related investments represents the net change in fair values of the derivative component of the Company's PHONES
          and the related Time Warner shares.

      (2) The Company recorded a gain as a result of the restructuring of the TMCT, LLC and TMCT II, LLC partnerships on Sept. 22, 2006.

      (3) The 2006 gain on sales of investments consisted primarily of the gain on sale of 2.8 million shares of Time Warner stock unrelated to the
          PHONES and a gain on the sale of the Company's investment in BrassRing.

      (4) In 2006, the Company recorded a favorable $34 million income tax expense adjustment, most of which related to the Company's PHONES
          as a result of reaching an agreement with the Internal Revenue Service appeals office pertaining to the deduction of interest expense on
          the PHONES.

      (5) On September 27, 2005, the United States Tax Court issued an opinion disallowing the 1998 tax-free reorganization of Matthew Bender, a former
          subsidiary of The Times Mirror Company. Tribune acquired Times Mirror in June 2000, and inherited the preexisting tax dispute at that time. Taxes
          and related interest for both the Matthew Bender transaction and a similar transaction completed by Times Mirror for its Mosby subsidiary in the
          same year totaled approximately $1 billion. Over time, deductions for state taxes and interest will reduce the net cash outlay to approximately $840
          million. The Company had a tax reserve of $228 million, net of tax, related to the litigation. As a result of the Tax Court ruling, the Company
          increased its tax reserve by $609 million by recording additional income tax expense of $150 million and goodwill of $459 million in the third quarter
          of 2005. In the first quarter of 2005, the Company reduced its income tax expense and liabilities by a total of $12 million as a result of favorably
          resolving certain federal income tax issues.


                                                                                13
(F)   In June 2006, the Company announced agreements to sell its Atlanta and Albany television stations. The sale of Atlanta closed in August
      2006. In September 2006, the Company announced an agreement to sell its Boston television station. The sales of Albany and Boston closed
      in December 2006. Operating results for these stations are now reported as discontinued operations. Income from discontinued operations
      for the full year of 2006 and 2005 included the following:

                                                                                             Full Year
                                                                                      2006                2005

      Income from operations, net of tax (1)                                      $       1,415      $     11,900
      Net loss on sales, net of tax (2)                                                 (68,273)              -
      Total                                                                       $     (66,858)     $     11,900

      (1) The full year 2006 included a charge of approximately $4 million, net of tax, for severance and related costs.

      (2) In the second quarter of 2006, the Company recorded a pretax loss of $90 million, including $80 million of allocated television group goodwill, to write
          down the Atlanta and Albany net assets to estimated fair value, less cost to sell. In the fourth quarter of 2006, the Company recorded a pretax gain on
          the sale of Boston of $41 million, reflecting $45 million of allocated goodwill. In accordance with Financial Accounting Standard (quot;FASquot;) No. 142,
          quot;Goodwill and Other Intangible Assetsquot;, the Company aggregates all of its television stations into one reporting unit for goodwill accounting
          purposes. Although less than $.1 million of goodwill was recorded when the Atlanta and Boston stations were acquired, and only $.3 million of
          goodwill was recorded for the Albany acquisition, FAS 142 requires the Company to allocate a portion of its television group goodwill to stations
          that are sold based on the fair value of the stations, relative to the fair value of the Company's remaining stations. The Company recorded a combined
          after-tax loss of $77 million on the sales of Atlanta and Albany and an after-tax gain of $9 million on the sale of Boston.

(G)   For the full year 2006 and 2005, weighted average common shares outstanding used in the calculations of diluted earnings per share (quot;EPSquot;) were
      adjusted for the dilutive effect of stock-based compensation grants. The Company's Series C, D-1 and D-2 convertible preferred shares were not
      included in the calculations of diluted EPS for either year because their effects were antidilutive. All of the Series C, D-1, and D-2 preferred shares were
      issued to and held by TMCT, LLC and TMCT II, LLC. In connection with a restructuring of these partnerships, all of these preferred shares were
      distributed to the Company on Sept. 22, 2006 and are no longer outstanding. Following are the calculations for the full year:

                                                                                             Full Year
                                                                                      2006                2005

      Income from continuing operations                                           $    660,853       $    522,789
      (Loss) income from discontinued operations, net of tax                           (66,858)            11,900
      Net income                                                                  $    593,995       $    534,689
      Dividends for Series C, D-1 and D-2 preferred stock                               (6,309)            (8,364)
      Net income attributable to common shares                                    $    587,686       $    526,325

      Weighted average common shares outstanding                                       272,672            312,880
      Adjustment for stock-based compensation grants                                     1,739              2,458
      Adjusted weighted average common
       shares outstanding                                                              274,411            315,338

      Diluted earnings per share:
       Continuing operations                                                     $         2.39      $        1.63
       Discontinued operations                                                            (0.24)              0.04
       Net income                                                                $         2.14      $        1.67

(H)   The number of common shares outstanding, in thousands, at Dec. 31, 2006 was 239,207.


                                                                                 14
TRIBUNE COMPANY
                                                   BUSINESS SEGMENT DATA (Unaudited)
                                                              (In thousands)


                                                               FOURTH QUARTER                                   FULL YEAR
                                                                                      %                                           %
                                                        2006            2005        Change          2006            2005        Change
PUBLISHING
   Operating Revenues                               $ 1,111,250     $ 1,072,360          3.6    $ 4,092,562     $ 4,096,850         (0.1)
   Cash Operating Expenses (A) (B) (C)                 (840,476)       (839,795)         0.1      (3,169,110)     (3,146,211)        0.7
   Operating Cash Flow (D) (E)                          270,774         232,565         16.4         923,452         950,639        (2.9)
   Depreciation and Amortization Expense (F)            (45,696)        (58,772)       (22.2)       (174,263)       (190,926)       (8.7)
   Total Operating Profit (E)                       $   225,078     $   173,793         29.5    $    749,189    $    759,713        (1.4)

BROADCASTING AND ENTERTAINMENT
   Operating Revenues
    Television                                      $   325,182     $   295,913          9.9    $ 1,178,104     $ 1,165,821          1.1
    Radio/Entertainment                                  30,421          23,723         28.2        247,042         248,612         (0.6)
    Total Operating Revenues                            355,603         319,636         11.3      1,425,146       1,414,433          0.8

    Cash Operating Expenses (A) (B) (C)
     Television                                         (206,104)       (189,929)        8.5        (775,147)       (739,290)        4.9
     Radio/Entertainment                                 (30,156)        (18,115)       66.5        (207,096)       (209,767)       (1.3)
     Total Cash Operating Expenses                      (236,260)       (208,044)       13.6        (982,243)       (949,057)        3.5

    Operating Cash Flow (D) (E)
     Television                                         119,078         105,984         12.4        402,957         426,531         (5.5)
     Radio/Entertainment                                    265           5,608        (95.3)        39,946          38,845          2.8
     Total Operating Cash Flow                          119,343         111,592          6.9        442,903         465,376         (4.8)

    Depreciation and Amortization Expense
     Television                                          (11,664)        (10,562)       10.4         (45,059)        (43,074)        4.6
     Radio/Entertainment                                  (1,793)         (1,728)        3.8          (6,311)         (5,411)       16.6
     Total Depreciation and Amortization Expense         (13,457)        (12,290)        9.5         (51,370)        (48,485)        6.0

    Operating Profit (E)
     Television                                         107,414          95,422         12.6        357,898         383,457         (6.7)
     Radio/Entertainment                                 (1,528)          3,880          NM          33,635          33,434          0.6
     Total Operating Profit                         $   105,886     $    99,302          6.6    $   391,533     $   416,891         (6.1)

CORPORATE EXPENSES
  Operating Cash Flow (D) (E)                       $     (7,272)   $     (8,976)      (19.0)   $    (54,332)   $    (47,783)       13.7
  Depreciation and Amortization Expense                     (339)           (409)      (17.1)         (1,380)         (1,630)      (15.3)
  Total Operating Loss (E)                          $     (7,611)   $     (9,385)      (18.9)   $    (55,712)   $    (49,413)       12.7

CONSOLIDATED
  Operating Revenues                                $ 1,466,853     $ 1,391,996          5.4    $ 5,517,708     $ 5,511,283          0.1
  Cash Operating Expenses (A) (B) (C)                 (1,084,008)     (1,056,815)        2.6      (4,205,685)     (4,143,051)        1.5
  Operating Cash Flow (D) (E)                            382,845         335,181        14.2       1,312,023       1,368,232        (4.1)
  Depreciation and Amortization Expense (F)              (59,492)        (71,471)      (16.8)       (227,013)       (241,041)       (5.8)
  Total Operating Profit (E)                        $    323,353    $    263,710        22.6    $ 1,085,010     $ 1,127,191         (3.7)


                                                                        15
(A) The Company uses cash operating expenses to evaluate internal performance. The Company has presented cash operating expenses because it is a common
    measure used by rating agencies, financial analysts and investors. Cash operating expense is not a measure of financial performance under generally accepted
    accounting principles (quot;GAAPquot;) and should not be considered in isolation or as a substitute for measures of performance prepared in accordance with
    GAAP.

    Following is a reconciliation of operating expenses to cash operating expenses for the fourth quarter of 2006:

                                                                           Broadcasting and
                                                            Publishing      Entertainment        Corporate           Consolidated

    Operating expenses                                     $    886,172       $    249,717      $      7,611         $ 1,143,500
    Less: depreciation and amortization expense                  45,696             13,457               339              59,492
    Cash operating expenses                                $    840,476       $    236,260      $      7,272         $ 1,084,008

    Following is a reconciliation of operating expenses to cash operating expenses for the fourth quarter of 2005:

                                                                           Broadcasting and
                                                            Publishing      Entertainment        Corporate           Consolidated

    Operating expenses                                     $    898,567       $    220,334      $      9,385         $ 1,128,286
    Less: depreciation and amortization expense                  58,772             12,290               409              71,471
    Cash operating expenses                                $    839,795       $    208,044      $      8,976         $ 1,056,815

    Following is a reconciliation of operating expenses to cash operating expenses for the full year 2006:

                                                                           Broadcasting and
                                                            Publishing      Entertainment        Corporate           Consolidated

    Operating expenses                                     $ 3,343,373        $ 1,033,613       $     55,712         $ 4,432,698
    Less: depreciation and amortization expense                174,263             51,370              1,380             227,013
    Cash operating expenses                                $ 3,169,110        $   982,243       $     54,332         $ 4,205,685

    Following is a reconciliation of operating expenses to cash operating expenses for the full year 2005:

                                                                           Broadcasting and
                                                            Publishing      Entertainment        Corporate           Consolidated

    Operating expenses                                     $ 3,337,137        $    997,542      $     49,413         $ 4,384,092
    Less: depreciation and amortization expense                190,926              48,485             1,630             241,041
    Cash operating expenses                                $ 3,146,211        $    949,057      $     47,783         $ 4,143,051


(B) Publishing cash operating expenses for the fourth quarter and full year 2006 included charges of $7 million and $9 million, respectively, for the elimination of
    approximately 400 positions, and a $4 million charge for the disposition of a press from the Los Angeles Times San Fernando Valley printing facility. Publishing
    cash operating expenses for the full year 2006 also included a charge of $20 million for severance and other payments associated with the new union contracts at
    Newsday and a gain of $7 million related to real property sales. Corporate cash operating expenses for both the fourth quarter and full year 2006 included a gain
    of $7 million related to the sale of the corporate airplane. Cash operating expenses for the fourth quarter and full year 2005 included a charge of $6 million
    related to the shutdown of the San Fernando Valley printing facility, a charge of $45 million ($43 million at Publishing, $1 million at Broadcasting and
    Entertainment and $1 million at Corporate) related to the elimination of approximately 900 positions, and a pension curtailment gain of $18 million ($13 million
    at Publishing, $1 million at Broadcasting and Entertainment and $4 million at Corporate).

(C) Cash operating expenses for the fourth quarter of 2006 included stock-based compensation expense of $3 million at Publishing, $1 million at Broadcasting
    and Entertainment and $1 million at Corporate. Cash operating expenses for the full year 2006 included stock-based compensation expense of $15 million
    at Publishing, $6 million at Broadcasting and Entertainment and $11 million at Corporate.

(D) Operating cash flow is defined as operating profit before depreciation and amortization. The Company uses operating cash flow along with operating profit
    and other measures to evaluate the financial performance of the Company's business segments. The Company has presented operating cash flow because it
    is a common alternative measure of financial performance used by rating agencies, financial analysts and investors. These groups use operating cash flow
    along with other measures as a way to estimate the value of a company. The Company's definition of operating cash flow may not be consistent with that
    of other companies. Operating cash flow does not represent cash provided by operating activities as reflected in the Company's consolidated statements of
    cash flows, is not a measure of financial performance under GAAP and should not be considered in isolation or as a substitute for measures of performance
    prepared in accordance with GAAP.


                                                                                  16
(E) Operating profit for each segment excludes interest and dividend income, interest expense, equity income and losses, non-operating items and
    income taxes.

    Following is a reconciliation of operating profit (loss) to operating cash flow for the fourth quarter of 2006:

                                                                             Broadcasting and
                                                              Publishing      Entertainment        Corporate          Consolidated

    Operating profit (loss)                                  $    225,078       $    105,886       $     (7,611)      $   323,353
    Add back: depreciation and amortization expense                45,696             13,457                339            59,492
    Operating cash flow                                      $    270,774       $    119,343       $     (7,272)      $   382,845

    Following is a reconciliation of operating profit (loss) to operating cash flow for the fourth quarter of 2005:

                                                                             Broadcasting and
                                                              Publishing      Entertainment        Corporate          Consolidated

    Operating profit (loss)                                  $    173,793       $     99,302       $     (9,385)      $   263,710
    Add back: depreciation and amortization expense                58,772             12,290                409            71,471
    Operating cash flow                                      $    232,565       $    111,592       $     (8,976)      $   335,181

    Following is a reconciliation of operating profit (loss) to operating cash flow for the full year 2006:

                                                                             Broadcasting and
                                                              Publishing      Entertainment        Corporate          Consolidated

    Operating profit (loss)                                  $    749,189       $    391,533       $   (55,712)       $ 1,085,010
    Add back: depreciation and amortization expense               174,263             51,370             1,380            227,013
    Operating cash flow                                      $    923,452       $    442,903       $   (54,332)       $ 1,312,023

    Following is a reconciliation of operating profit (loss) to operating cash flow for the full year 2005:

                                                                             Broadcasting and
                                                              Publishing      Entertainment        Corporate          Consolidated

    Operating profit (loss)                                  $    759,713       $    416,891       $   (49,413)       $ 1,127,191
    Add back: depreciation and amortization expense               190,926             48,485             1,630            241,041
    Operating cash flow                                      $    950,639       $    465,376       $   (47,783)       $ 1,368,232

(F) Publishing depreciation and amortization expense for the fourth quarter and full year 2005 included $16 million of accelerated depreciation expense related
    to the shutdown of the Los Angeles Times San Fernando Valley printing facility.


                                                                                    17
TRIBUNE COMPANY
                                                         SUMMARY OF REVENUES AND NEWSPAPER ADVERTISING VOLUME (Unaudited)
                                                                         For Period 12 Ended December 31, 2006
                                                                                     (In thousands)

                                                                Period 12 (A)                                         Fourth Quarter (A)                               Full Year (A)
                                                                                       %                                                     %                                              %
                                                  2006              2005             Change                   2006             2005        Change          2006               2005        Change
Publishing
    Advertising
                                              $    186,153      $    166,216                             $      405,675    $     380,497              $    1,344,124     $    1,323,547
         Retail                                                                             12.0                                               6.6                                            1.6
         National                                   99,996            81,575                22.6                218,462          211,433       3.3           736,808            774,093      (4.8)
         Classified                                 91,270            85,434                 6.8                269,117          268,458       0.2         1,179,128          1,146,460       2.8
                                                   377,419           333,225                                    893,254          860,388                   3,260,060          3,244,100
         Sub-Total                                                                          13.3                                               3.8                                            0.5
                                                    63,370            56,418                                    149,525          148,057                     575,043            596,163
    Circulation                                                                             12.3                                               1.0                                           (3.5)
    Other                                           27,311            23,371                16.9                 68,471           63,915       7.1           257,459            256,587       0.3
    Segment Total                                  468,100           413,014                13.3              1,111,250        1,072,360       3.6         4,092,562          4,096,850      (0.1)

Broadcasting & Entertainment
    Television (B)                                 127,215           111,412                14.2                325,182          295,913       9.9         1,178,104          1,165,821       1.1
                                                    10,764             6,056                                     30,421           23,723                     247,042            248,612
    Radio/Entertainment                                                                     77.7                                              28.2                                           (0.6)
                                                   137,979           117,468                                    355,603          319,636                   1,425,146          1,414,433
    Segment Total                                                                           17.5                                              11.3                                            0.8
                                              $    606,079      $    530,482                14.3         $    1,466,853    $   1,391,996       5.4    $    5,517,708     $    5,511,283       0.1
Consolidated Revenues


Total Advertising Inches (C)
    Full Run
         Retail                                        871               773                12.7                 1,874            1,726        8.6            6,119               5,980       2.3
         National                                      440               401                 9.7                   961            1,033       (7.0)           3,457               3,774      (8.4)
         Classified                                    890               834                 6.7                 2,365            2,452       (3.5)          10,154              10,023       1.3
         Sub-Total                                   2,201             2,008                 9.6                 5,200            5,211       (0.2)          19,730              19,777      (0.2)
    Part Run                                         2,060             1,749                17.8                 5,450            4,896       11.3           21,217              20,112       5.5
    Total                                            4,261             3,757                13.4                10,650           10,107        5.4           40,947              39,889       2.7

Preprint Pieces (C)                               2,035,330         1,802,090               12.9              4,482,804        4,138,538       8.3        14,928,728         14,929,047         -


(A) Period 12, fourth quarter and full year 2006 include 6 weeks, 14 weeks and 53 weeks, respectively.
    Period 12, fourth quarter and full year 2005 include 5 weeks, 13 weeks and 52 weeks, respectively.

(B) Both 2006 and 2005 exclude revenues from discontinued operations (WATL-TV in Atlanta, WLVI-TV in Boston and WCWN-TV in Albany).

(C) Volume includes only the daily newspapers and is based on preliminary internal data, which may be updated in subsequent reports.


                                                                                                         18

Mais conteúdo relacionado

Mais procurados

tribune earnings_q2_07_tables
tribune  earnings_q2_07_tablestribune  earnings_q2_07_tables
tribune earnings_q2_07_tablesfinance47
 
tribune earnings_q3_06_tables
tribune  earnings_q3_06_tablestribune  earnings_q3_06_tables
tribune earnings_q3_06_tablesfinance47
 
tribune earnings_q4_02_tables
tribune  earnings_q4_02_tablestribune  earnings_q4_02_tables
tribune earnings_q4_02_tablesfinance47
 
CLOrox fy05_q2_spmt
CLOrox   fy05_q2_spmtCLOrox   fy05_q2_spmt
CLOrox fy05_q2_spmtfinance48
 
tribune earnings_q3_03_tables
tribune  earnings_q3_03_tablestribune  earnings_q3_03_tables
tribune earnings_q3_03_tablesfinance47
 
tribune earnings_q1_04_tables
tribune  earnings_q1_04_tablestribune  earnings_q1_04_tables
tribune earnings_q1_04_tablesfinance47
 
tribune earnings_q1_05_tables
tribune  earnings_q1_05_tablestribune  earnings_q1_05_tables
tribune earnings_q1_05_tablesfinance47
 
tribune earnings_q3_04_tables
tribune  earnings_q3_04_tablestribune  earnings_q3_04_tables
tribune earnings_q3_04_tablesfinance47
 
tribune earnings_q4_01_tables
tribune  earnings_q4_01_tablestribune  earnings_q4_01_tables
tribune earnings_q4_01_tablesfinance47
 
tribune earnings_q1_07_tables
tribune  earnings_q1_07_tablestribune  earnings_q1_07_tables
tribune earnings_q1_07_tablesfinance47
 
tribune earnings_q2_03_tables
tribune  earnings_q2_03_tablestribune  earnings_q2_03_tables
tribune earnings_q2_03_tablesfinance47
 
tribune earnings_q2_05_tables
tribune  earnings_q2_05_tablestribune  earnings_q2_05_tables
tribune earnings_q2_05_tablesfinance47
 
tribune earnings_q1_03_tables
tribune  earnings_q1_03_tablestribune  earnings_q1_03_tables
tribune earnings_q1_03_tablesfinance47
 
Maxim 2Q FISCAL 2009 RESULTS
Maxim 2Q FISCAL 2009 RESULTSMaxim 2Q FISCAL 2009 RESULTS
Maxim 2Q FISCAL 2009 RESULTSearningsreport
 
conoco phillips 2005First Quarter
conoco phillips 2005First Quarterconoco phillips 2005First Quarter
conoco phillips 2005First Quarterfinance1
 
CLOrox q4_fy05_supplemental
CLOrox   q4_fy05_supplementalCLOrox   q4_fy05_supplemental
CLOrox q4_fy05_supplementalfinance48
 
tribune earnings_q3_02_tables
tribune  earnings_q3_02_tablestribune  earnings_q3_02_tables
tribune earnings_q3_02_tablesfinance47
 
tribune earnings_q2_01_tables
tribune  earnings_q2_01_tablestribune  earnings_q2_01_tables
tribune earnings_q2_01_tablesfinance47
 
tribune earnings_q2_02_tables
tribune  earnings_q2_02_tablestribune  earnings_q2_02_tables
tribune earnings_q2_02_tablesfinance47
 
CLX0202Earnings-963963
CLX0202Earnings-963963CLX0202Earnings-963963
CLX0202Earnings-963963finance48
 

Mais procurados (20)

tribune earnings_q2_07_tables
tribune  earnings_q2_07_tablestribune  earnings_q2_07_tables
tribune earnings_q2_07_tables
 
tribune earnings_q3_06_tables
tribune  earnings_q3_06_tablestribune  earnings_q3_06_tables
tribune earnings_q3_06_tables
 
tribune earnings_q4_02_tables
tribune  earnings_q4_02_tablestribune  earnings_q4_02_tables
tribune earnings_q4_02_tables
 
CLOrox fy05_q2_spmt
CLOrox   fy05_q2_spmtCLOrox   fy05_q2_spmt
CLOrox fy05_q2_spmt
 
tribune earnings_q3_03_tables
tribune  earnings_q3_03_tablestribune  earnings_q3_03_tables
tribune earnings_q3_03_tables
 
tribune earnings_q1_04_tables
tribune  earnings_q1_04_tablestribune  earnings_q1_04_tables
tribune earnings_q1_04_tables
 
tribune earnings_q1_05_tables
tribune  earnings_q1_05_tablestribune  earnings_q1_05_tables
tribune earnings_q1_05_tables
 
tribune earnings_q3_04_tables
tribune  earnings_q3_04_tablestribune  earnings_q3_04_tables
tribune earnings_q3_04_tables
 
tribune earnings_q4_01_tables
tribune  earnings_q4_01_tablestribune  earnings_q4_01_tables
tribune earnings_q4_01_tables
 
tribune earnings_q1_07_tables
tribune  earnings_q1_07_tablestribune  earnings_q1_07_tables
tribune earnings_q1_07_tables
 
tribune earnings_q2_03_tables
tribune  earnings_q2_03_tablestribune  earnings_q2_03_tables
tribune earnings_q2_03_tables
 
tribune earnings_q2_05_tables
tribune  earnings_q2_05_tablestribune  earnings_q2_05_tables
tribune earnings_q2_05_tables
 
tribune earnings_q1_03_tables
tribune  earnings_q1_03_tablestribune  earnings_q1_03_tables
tribune earnings_q1_03_tables
 
Maxim 2Q FISCAL 2009 RESULTS
Maxim 2Q FISCAL 2009 RESULTSMaxim 2Q FISCAL 2009 RESULTS
Maxim 2Q FISCAL 2009 RESULTS
 
conoco phillips 2005First Quarter
conoco phillips 2005First Quarterconoco phillips 2005First Quarter
conoco phillips 2005First Quarter
 
CLOrox q4_fy05_supplemental
CLOrox   q4_fy05_supplementalCLOrox   q4_fy05_supplemental
CLOrox q4_fy05_supplemental
 
tribune earnings_q3_02_tables
tribune  earnings_q3_02_tablestribune  earnings_q3_02_tables
tribune earnings_q3_02_tables
 
tribune earnings_q2_01_tables
tribune  earnings_q2_01_tablestribune  earnings_q2_01_tables
tribune earnings_q2_01_tables
 
tribune earnings_q2_02_tables
tribune  earnings_q2_02_tablestribune  earnings_q2_02_tables
tribune earnings_q2_02_tables
 
CLX0202Earnings-963963
CLX0202Earnings-963963CLX0202Earnings-963963
CLX0202Earnings-963963
 

Semelhante a tribune earnings_q4_06_tables

tribune earnings_q3_07_tables
tribune  earnings_q3_07_tablestribune  earnings_q3_07_tables
tribune earnings_q3_07_tablesfinance47
 
tribune earnings_q4_03_tables
tribune  earnings_q4_03_tablestribune  earnings_q4_03_tables
tribune earnings_q4_03_tablesfinance47
 
tribune earnings_q4_07_tables
tribune earnings_q4_07_tablestribune earnings_q4_07_tables
tribune earnings_q4_07_tablesfinance47
 
tribune earnings_q4_07_tables
tribune  earnings_q4_07_tablestribune  earnings_q4_07_tables
tribune earnings_q4_07_tablesfinance47
 
tribune earnings_q2_08_tables
tribune earnings_q2_08_tablestribune earnings_q2_08_tables
tribune earnings_q2_08_tablesfinance47
 
tribune earnings_q2_08_tables
tribune  earnings_q2_08_tablestribune  earnings_q2_08_tables
tribune earnings_q2_08_tablesfinance47
 
tribune earnings_q1_02_tables
tribune  earnings_q1_02_tablestribune  earnings_q1_02_tables
tribune earnings_q1_02_tablesfinance47
 
4Q06OpStats_FNAL_022307
4Q06OpStats_FNAL_0223074Q06OpStats_FNAL_022307
4Q06OpStats_FNAL_022307finance49
 
4Q06OpStats_FNAL_022307
4Q06OpStats_FNAL_0223074Q06OpStats_FNAL_022307
4Q06OpStats_FNAL_022307finance49
 
CLOrox fy05_q3_spmt
CLOrox   fy05_q3_spmtCLOrox   fy05_q3_spmt
CLOrox fy05_q3_spmtfinance48
 
alltel 2Q06_Non-GAAP
alltel  2Q06_Non-GAAPalltel  2Q06_Non-GAAP
alltel 2Q06_Non-GAAPfinance27
 

Semelhante a tribune earnings_q4_06_tables (13)

tribune earnings_q3_07_tables
tribune  earnings_q3_07_tablestribune  earnings_q3_07_tables
tribune earnings_q3_07_tables
 
tribune earnings_q4_03_tables
tribune  earnings_q4_03_tablestribune  earnings_q4_03_tables
tribune earnings_q4_03_tables
 
tribune earnings_q4_07_tables
tribune earnings_q4_07_tablestribune earnings_q4_07_tables
tribune earnings_q4_07_tables
 
tribune earnings_q4_07_tables
tribune  earnings_q4_07_tablestribune  earnings_q4_07_tables
tribune earnings_q4_07_tables
 
4Q05OpStats
4Q05OpStats4Q05OpStats
4Q05OpStats
 
4Q05OpStats
4Q05OpStats4Q05OpStats
4Q05OpStats
 
tribune earnings_q2_08_tables
tribune earnings_q2_08_tablestribune earnings_q2_08_tables
tribune earnings_q2_08_tables
 
tribune earnings_q2_08_tables
tribune  earnings_q2_08_tablestribune  earnings_q2_08_tables
tribune earnings_q2_08_tables
 
tribune earnings_q1_02_tables
tribune  earnings_q1_02_tablestribune  earnings_q1_02_tables
tribune earnings_q1_02_tables
 
4Q06OpStats_FNAL_022307
4Q06OpStats_FNAL_0223074Q06OpStats_FNAL_022307
4Q06OpStats_FNAL_022307
 
4Q06OpStats_FNAL_022307
4Q06OpStats_FNAL_0223074Q06OpStats_FNAL_022307
4Q06OpStats_FNAL_022307
 
CLOrox fy05_q3_spmt
CLOrox   fy05_q3_spmtCLOrox   fy05_q3_spmt
CLOrox fy05_q3_spmt
 
alltel 2Q06_Non-GAAP
alltel  2Q06_Non-GAAPalltel  2Q06_Non-GAAP
alltel 2Q06_Non-GAAP
 

Mais de finance47

western unionCorporate Governance Guidelines
western unionCorporate Governance Guidelineswestern unionCorporate Governance Guidelines
western unionCorporate Governance Guidelinesfinance47
 
western union Certificate of Incorporation
western union Certificate of Incorporation western union Certificate of Incorporation
western union Certificate of Incorporation finance47
 
western unionRelated Person Transactions Policy
western unionRelated Person Transactions Policy western unionRelated Person Transactions Policy
western unionRelated Person Transactions Policy finance47
 
western union annual reports 2006
western union annual reports 2006western union annual reports 2006
western union annual reports 2006finance47
 
western union annual reports 2007
western union annual reports 2007western union annual reports 2007
western union annual reports 2007finance47
 
western union annual reports 2008
western union annual reports 2008western union annual reports 2008
western union annual reports 2008finance47
 
hershey 63664
hershey  63664hershey  63664
hershey 63664finance47
 
hershey 63664
hershey  63664hershey  63664
hershey 63664finance47
 
hershey _020415b
hershey  _020415bhershey  _020415b
hershey _020415bfinance47
 
hershey _020415b
hershey  _020415bhershey  _020415b
hershey _020415bfinance47
 
hershey _2001_AR
hershey  _2001_ARhershey  _2001_AR
hershey _2001_ARfinance47
 
hershey _2001_AR
hershey  _2001_ARhershey  _2001_AR
hershey _2001_ARfinance47
 
hershey _MDA_2002
hershey  _MDA_2002hershey  _MDA_2002
hershey _MDA_2002finance47
 
hershey _MDA_2002
hershey  _MDA_2002hershey  _MDA_2002
hershey _MDA_2002finance47
 
hershey HSY_MDA_2003
hershey  HSY_MDA_2003hershey  HSY_MDA_2003
hershey HSY_MDA_2003finance47
 
hershey HSY_MDA_2003
hershey  HSY_MDA_2003hershey  HSY_MDA_2003
hershey HSY_MDA_2003finance47
 
hershey HSY_Letter_2004
hershey  HSY_Letter_2004hershey  HSY_Letter_2004
hershey HSY_Letter_2004finance47
 
hershey HSY_Letter_2004
hershey  HSY_Letter_2004hershey  HSY_Letter_2004
hershey HSY_Letter_2004finance47
 
hershey 2004AR
hershey  2004ARhershey  2004AR
hershey 2004ARfinance47
 
hershey 2004AR
hershey  2004ARhershey  2004AR
hershey 2004ARfinance47
 

Mais de finance47 (20)

western unionCorporate Governance Guidelines
western unionCorporate Governance Guidelineswestern unionCorporate Governance Guidelines
western unionCorporate Governance Guidelines
 
western union Certificate of Incorporation
western union Certificate of Incorporation western union Certificate of Incorporation
western union Certificate of Incorporation
 
western unionRelated Person Transactions Policy
western unionRelated Person Transactions Policy western unionRelated Person Transactions Policy
western unionRelated Person Transactions Policy
 
western union annual reports 2006
western union annual reports 2006western union annual reports 2006
western union annual reports 2006
 
western union annual reports 2007
western union annual reports 2007western union annual reports 2007
western union annual reports 2007
 
western union annual reports 2008
western union annual reports 2008western union annual reports 2008
western union annual reports 2008
 
hershey 63664
hershey  63664hershey  63664
hershey 63664
 
hershey 63664
hershey  63664hershey  63664
hershey 63664
 
hershey _020415b
hershey  _020415bhershey  _020415b
hershey _020415b
 
hershey _020415b
hershey  _020415bhershey  _020415b
hershey _020415b
 
hershey _2001_AR
hershey  _2001_ARhershey  _2001_AR
hershey _2001_AR
 
hershey _2001_AR
hershey  _2001_ARhershey  _2001_AR
hershey _2001_AR
 
hershey _MDA_2002
hershey  _MDA_2002hershey  _MDA_2002
hershey _MDA_2002
 
hershey _MDA_2002
hershey  _MDA_2002hershey  _MDA_2002
hershey _MDA_2002
 
hershey HSY_MDA_2003
hershey  HSY_MDA_2003hershey  HSY_MDA_2003
hershey HSY_MDA_2003
 
hershey HSY_MDA_2003
hershey  HSY_MDA_2003hershey  HSY_MDA_2003
hershey HSY_MDA_2003
 
hershey HSY_Letter_2004
hershey  HSY_Letter_2004hershey  HSY_Letter_2004
hershey HSY_Letter_2004
 
hershey HSY_Letter_2004
hershey  HSY_Letter_2004hershey  HSY_Letter_2004
hershey HSY_Letter_2004
 
hershey 2004AR
hershey  2004ARhershey  2004AR
hershey 2004AR
 
hershey 2004AR
hershey  2004ARhershey  2004AR
hershey 2004AR
 

Último

SBP-Market-Operations and market managment
SBP-Market-Operations and market managmentSBP-Market-Operations and market managment
SBP-Market-Operations and market managmentfactical
 
BPPG response - Options for Defined Benefit schemes - 19Apr24.pdf
BPPG response - Options for Defined Benefit schemes - 19Apr24.pdfBPPG response - Options for Defined Benefit schemes - 19Apr24.pdf
BPPG response - Options for Defined Benefit schemes - 19Apr24.pdfHenry Tapper
 
House of Commons ; CDC schemes overview document
House of Commons ; CDC schemes overview documentHouse of Commons ; CDC schemes overview document
House of Commons ; CDC schemes overview documentHenry Tapper
 
call girls in Nand Nagri (DELHI) 🔝 >༒9953330565🔝 genuine Escort Service 🔝✔️✔️
call girls in  Nand Nagri (DELHI) 🔝 >༒9953330565🔝 genuine Escort Service 🔝✔️✔️call girls in  Nand Nagri (DELHI) 🔝 >༒9953330565🔝 genuine Escort Service 🔝✔️✔️
call girls in Nand Nagri (DELHI) 🔝 >༒9953330565🔝 genuine Escort Service 🔝✔️✔️9953056974 Low Rate Call Girls In Saket, Delhi NCR
 
Economics, Commerce and Trade Management: An International Journal (ECTIJ)
Economics, Commerce and Trade Management: An International Journal (ECTIJ)Economics, Commerce and Trade Management: An International Journal (ECTIJ)
Economics, Commerce and Trade Management: An International Journal (ECTIJ)ECTIJ
 
Stock Market Brief Deck for "this does not happen often".pdf
Stock Market Brief Deck for "this does not happen often".pdfStock Market Brief Deck for "this does not happen often".pdf
Stock Market Brief Deck for "this does not happen often".pdfMichael Silva
 
NO1 WorldWide Love marriage specialist baba ji Amil Baba Kala ilam powerful v...
NO1 WorldWide Love marriage specialist baba ji Amil Baba Kala ilam powerful v...NO1 WorldWide Love marriage specialist baba ji Amil Baba Kala ilam powerful v...
NO1 WorldWide Love marriage specialist baba ji Amil Baba Kala ilam powerful v...Amil baba
 
chapter_2.ppt The labour market definitions and trends
chapter_2.ppt The labour market definitions and trendschapter_2.ppt The labour market definitions and trends
chapter_2.ppt The labour market definitions and trendslemlemtesfaye192
 
Lundin Gold April 2024 Corporate Presentation v4.pdf
Lundin Gold April 2024 Corporate Presentation v4.pdfLundin Gold April 2024 Corporate Presentation v4.pdf
Lundin Gold April 2024 Corporate Presentation v4.pdfAdnet Communications
 
magnetic-pensions-a-new-blueprint-for-the-dc-landscape.pdf
magnetic-pensions-a-new-blueprint-for-the-dc-landscape.pdfmagnetic-pensions-a-new-blueprint-for-the-dc-landscape.pdf
magnetic-pensions-a-new-blueprint-for-the-dc-landscape.pdfHenry Tapper
 
Authentic No 1 Amil Baba In Pakistan Authentic No 1 Amil Baba In Karachi No 1...
Authentic No 1 Amil Baba In Pakistan Authentic No 1 Amil Baba In Karachi No 1...Authentic No 1 Amil Baba In Pakistan Authentic No 1 Amil Baba In Karachi No 1...
Authentic No 1 Amil Baba In Pakistan Authentic No 1 Amil Baba In Karachi No 1...First NO1 World Amil baba in Faisalabad
 
Call Girls Near Delhi Pride Hotel, New Delhi|9873777170
Call Girls Near Delhi Pride Hotel, New Delhi|9873777170Call Girls Near Delhi Pride Hotel, New Delhi|9873777170
Call Girls Near Delhi Pride Hotel, New Delhi|9873777170Sonam Pathan
 
212MTAMount Durham University Bachelor's Diploma in Technology
212MTAMount Durham University Bachelor's Diploma in Technology212MTAMount Durham University Bachelor's Diploma in Technology
212MTAMount Durham University Bachelor's Diploma in Technologyz xss
 
The Core Functions of the Bangko Sentral ng Pilipinas
The Core Functions of the Bangko Sentral ng PilipinasThe Core Functions of the Bangko Sentral ng Pilipinas
The Core Functions of the Bangko Sentral ng PilipinasCherylouCamus
 
Vp Girls near me Delhi Call Now or WhatsApp
Vp Girls near me Delhi Call Now or WhatsAppVp Girls near me Delhi Call Now or WhatsApp
Vp Girls near me Delhi Call Now or WhatsAppmiss dipika
 
Call Girls Near Me WhatsApp:+91-9833363713
Call Girls Near Me WhatsApp:+91-9833363713Call Girls Near Me WhatsApp:+91-9833363713
Call Girls Near Me WhatsApp:+91-9833363713Sonam Pathan
 
(办理学位证)加拿大萨省大学毕业证成绩单原版一比一
(办理学位证)加拿大萨省大学毕业证成绩单原版一比一(办理学位证)加拿大萨省大学毕业证成绩单原版一比一
(办理学位证)加拿大萨省大学毕业证成绩单原版一比一S SDS
 
Governor Olli Rehn: Dialling back monetary restraint
Governor Olli Rehn: Dialling back monetary restraintGovernor Olli Rehn: Dialling back monetary restraint
Governor Olli Rehn: Dialling back monetary restraintSuomen Pankki
 
Quantitative Analysis of Retail Sector Companies
Quantitative Analysis of Retail Sector CompaniesQuantitative Analysis of Retail Sector Companies
Quantitative Analysis of Retail Sector Companiesprashantbhati354
 
Tenets of Physiocracy History of Economic
Tenets of Physiocracy History of EconomicTenets of Physiocracy History of Economic
Tenets of Physiocracy History of Economiccinemoviesu
 

Último (20)

SBP-Market-Operations and market managment
SBP-Market-Operations and market managmentSBP-Market-Operations and market managment
SBP-Market-Operations and market managment
 
BPPG response - Options for Defined Benefit schemes - 19Apr24.pdf
BPPG response - Options for Defined Benefit schemes - 19Apr24.pdfBPPG response - Options for Defined Benefit schemes - 19Apr24.pdf
BPPG response - Options for Defined Benefit schemes - 19Apr24.pdf
 
House of Commons ; CDC schemes overview document
House of Commons ; CDC schemes overview documentHouse of Commons ; CDC schemes overview document
House of Commons ; CDC schemes overview document
 
call girls in Nand Nagri (DELHI) 🔝 >༒9953330565🔝 genuine Escort Service 🔝✔️✔️
call girls in  Nand Nagri (DELHI) 🔝 >༒9953330565🔝 genuine Escort Service 🔝✔️✔️call girls in  Nand Nagri (DELHI) 🔝 >༒9953330565🔝 genuine Escort Service 🔝✔️✔️
call girls in Nand Nagri (DELHI) 🔝 >༒9953330565🔝 genuine Escort Service 🔝✔️✔️
 
Economics, Commerce and Trade Management: An International Journal (ECTIJ)
Economics, Commerce and Trade Management: An International Journal (ECTIJ)Economics, Commerce and Trade Management: An International Journal (ECTIJ)
Economics, Commerce and Trade Management: An International Journal (ECTIJ)
 
Stock Market Brief Deck for "this does not happen often".pdf
Stock Market Brief Deck for "this does not happen often".pdfStock Market Brief Deck for "this does not happen often".pdf
Stock Market Brief Deck for "this does not happen often".pdf
 
NO1 WorldWide Love marriage specialist baba ji Amil Baba Kala ilam powerful v...
NO1 WorldWide Love marriage specialist baba ji Amil Baba Kala ilam powerful v...NO1 WorldWide Love marriage specialist baba ji Amil Baba Kala ilam powerful v...
NO1 WorldWide Love marriage specialist baba ji Amil Baba Kala ilam powerful v...
 
chapter_2.ppt The labour market definitions and trends
chapter_2.ppt The labour market definitions and trendschapter_2.ppt The labour market definitions and trends
chapter_2.ppt The labour market definitions and trends
 
Lundin Gold April 2024 Corporate Presentation v4.pdf
Lundin Gold April 2024 Corporate Presentation v4.pdfLundin Gold April 2024 Corporate Presentation v4.pdf
Lundin Gold April 2024 Corporate Presentation v4.pdf
 
magnetic-pensions-a-new-blueprint-for-the-dc-landscape.pdf
magnetic-pensions-a-new-blueprint-for-the-dc-landscape.pdfmagnetic-pensions-a-new-blueprint-for-the-dc-landscape.pdf
magnetic-pensions-a-new-blueprint-for-the-dc-landscape.pdf
 
Authentic No 1 Amil Baba In Pakistan Authentic No 1 Amil Baba In Karachi No 1...
Authentic No 1 Amil Baba In Pakistan Authentic No 1 Amil Baba In Karachi No 1...Authentic No 1 Amil Baba In Pakistan Authentic No 1 Amil Baba In Karachi No 1...
Authentic No 1 Amil Baba In Pakistan Authentic No 1 Amil Baba In Karachi No 1...
 
Call Girls Near Delhi Pride Hotel, New Delhi|9873777170
Call Girls Near Delhi Pride Hotel, New Delhi|9873777170Call Girls Near Delhi Pride Hotel, New Delhi|9873777170
Call Girls Near Delhi Pride Hotel, New Delhi|9873777170
 
212MTAMount Durham University Bachelor's Diploma in Technology
212MTAMount Durham University Bachelor's Diploma in Technology212MTAMount Durham University Bachelor's Diploma in Technology
212MTAMount Durham University Bachelor's Diploma in Technology
 
The Core Functions of the Bangko Sentral ng Pilipinas
The Core Functions of the Bangko Sentral ng PilipinasThe Core Functions of the Bangko Sentral ng Pilipinas
The Core Functions of the Bangko Sentral ng Pilipinas
 
Vp Girls near me Delhi Call Now or WhatsApp
Vp Girls near me Delhi Call Now or WhatsAppVp Girls near me Delhi Call Now or WhatsApp
Vp Girls near me Delhi Call Now or WhatsApp
 
Call Girls Near Me WhatsApp:+91-9833363713
Call Girls Near Me WhatsApp:+91-9833363713Call Girls Near Me WhatsApp:+91-9833363713
Call Girls Near Me WhatsApp:+91-9833363713
 
(办理学位证)加拿大萨省大学毕业证成绩单原版一比一
(办理学位证)加拿大萨省大学毕业证成绩单原版一比一(办理学位证)加拿大萨省大学毕业证成绩单原版一比一
(办理学位证)加拿大萨省大学毕业证成绩单原版一比一
 
Governor Olli Rehn: Dialling back monetary restraint
Governor Olli Rehn: Dialling back monetary restraintGovernor Olli Rehn: Dialling back monetary restraint
Governor Olli Rehn: Dialling back monetary restraint
 
Quantitative Analysis of Retail Sector Companies
Quantitative Analysis of Retail Sector CompaniesQuantitative Analysis of Retail Sector Companies
Quantitative Analysis of Retail Sector Companies
 
Tenets of Physiocracy History of Economic
Tenets of Physiocracy History of EconomicTenets of Physiocracy History of Economic
Tenets of Physiocracy History of Economic
 

tribune earnings_q4_06_tables

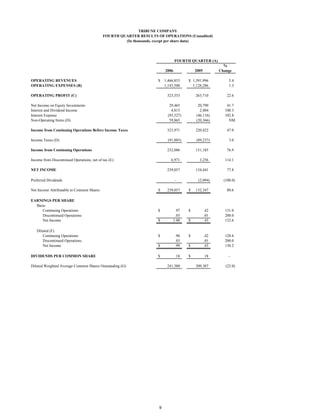
  • 1. TRIBUNE COMPANY FOURTH QUARTER RESULTS OF OPERATIONS (Unaudited) (In thousands, except per share data) FOURTH QUARTER (A) % 2006 2005 Change OPERATING REVENUES $ 1,466,853 $ 1,391,996 5.4 OPERATING EXPENSES (B) 1,143,500 1,128,286 1.3 OPERATING PROFIT (C) 323,353 263,710 22.6 Net Income on Equity Investments 29,465 20,790 41.7 Interest and Dividend Income 4,815 2,404 100.3 Interest Expense (93,527) (46,116) 102.8 Non-Operating Items (D) 59,865 (20,366) NM Income from Continuing Operations Before Income Taxes 323,971 220,422 47.0 Income Taxes (D) (91,885) (89,237) 3.0 Income from Continuing Operations 232,086 131,185 76.9 Income from Discontinued Operations, net of tax (E) 6,971 3,256 114.1 NET INCOME 239,057 134,441 77.8 Preferred Dividends - (2,094) (100.0) Net Income Attributable to Common Shares $ 239,057 $ 132,347 80.6 EARNINGS PER SHARE Basic Continuing Operations $ .97 $ .42 131.0 Discontinued Operations .03 .01 200.0 Net Income $ 1.00 $ .43 132.6 Diluted (F) Continuing Operations $ .96 $ .42 128.6 Discontinued Operations .03 .01 200.0 Net Income $ .99 $ .43 130.2 DIVIDENDS PER COMMON SHARE $ .18 $ .18 - Diluted Weighted Average Common Shares Outstanding (G) 241,380 309,307 (22.0) 9
  • 2. (A) 2006 fourth quarter: Sept. 25, 2006 to Dec. 31, 2006. (14 weeks) 2005 fourth quarter: Sept. 26, 2005 to Dec. 25, 2005. (13 weeks) (B) Operating expenses for the fourth quarter of 2006 included $5 million, or $.01 per diluted share, of stock-based compensation expense ($3 million at Publishing, $1 million at Broadcasting and Entertainment and $1 million at Corporate), a charge of $7 million, or $.02 per diluted share, for the elimination of approximately 400 positions at Publishing, a charge of $4 million, or $.01 per diluted share, for the disposition of a press from the Los Angeles Times San Fernando Valley printing facility, and a $7 million gain, or $.02 per diluted share, related to the sale of the corporate airplane. Operating expenses for the fourth quarter of 2005 included a charge of $22 million, or $.04 per diluted share, related to the shutdown of the San Fernando Valley printing facility, a charge of $45 million, or $.09 per diluted share, ($43 million at Publishing, $1 million at Broadcasting and Entertainment and $1 million at Corporate) related to the elimination of approximately 900 positions, and a pension curtailment gain of $18 million, or $.03 per diluted share ($13 million at Publishing, $1 million at Broadcasting and Entertainment and $4 million at Corporate). (C) Operating profit excludes interest and dividend income, interest expense, equity income and losses, non-operating items and income taxes. (D) The fourth quarter of 2006 included the following non-operating items: Pretax After-tax Gain (Loss) Gain (Loss) Diluted EPS Gain on derivatives and related investments (1) $ 45,272 $ 27,616 $ .11 Gain on sales of investments, net (2) 15,920 9,645 .04 Other, net (1,327) (1,218) - Income tax adjustments (3) - 33,338 .14 Total non-operating items $ 59,865 $ 69,381 $ .29 The fourth quarter of 2005 included the following non-operating items: Pretax After-tax Gain (Loss) Gain (Loss) Diluted EPS Loss on derivatives and related investments (1) $ (24,486) $ (14,937) $ (.05) Gain on sales of subsidiaries and investments, net 3,885 2,370 .01 Other, net 235 143 - Total non-operating items $ (20,366) $ (12,424) $ (.04) (1) Gain (loss) on derivatives and related investments represents the net change in fair values of the derivative component of the Company's PHONES and the related Time Warner shares. (2) The 2006 gain consists primarily of the gain on the sale of the Company's investment in BrassRing. (3) In the fourth quarter of 2006, the Company recorded a favorable $33 million income tax expense adjustment, most of which related to the Company's PHONES as a result of reaching an agreement with the Internal Revenue Service appeals office pertaining to the deduction of interest expense on the PHONES. (E) In June 2006, the Company announced agreements to sell its Atlanta and Albany television stations. The sale of Atlanta closed in August 2006. In September 2006, the Company announced an agreement to sell its Boston television station. The sales of Albany and Boston closed in December 2006. Operating results for these stations are now reported as discontinued operations. Income from discontinued operations in the fourth quarter included the following: Fourth Quarter 2006 2005 (Loss) income from operations, net of tax (1) $ (2,289) $ 3,256 Gain on sale, net of tax (2) 9,260 - Total $ 6,971 $ 3,256 (1) The fourth quarter of 2006 included a charge of approximately $3 million, net of tax, for severance and related costs. (2) In the fourth quarter of 2006, the Company recorded a pretax gain on the sale of Boston of $41 million ($9.3 million after taxes). The pretax gain calculation reflected $45 million of allocated television group goodwill. In accordance with Financial Accounting Standard (quot;FASquot;) No. 142, quot;Goodwill and Other Intangible Assetsquot;, the Company aggregates all of its television stations into one reporting unit for goodwill accounting purposes. Although less than $.1 million of goodwill was recorded when the Boston station was acquired, FAS 142 requires the Company to allocate a portion of its television group goodwill to stations that are sold based on the fair value of the stations, relative to the fair value of the Company's remaining stations. The Company incurred an after-tax loss on the sale of Albany, which was recorded when the sale was announced in the second quarter of 2006. 10
  • 3. (F) For the fourth quarters of 2006 and 2005, weighted average common shares outstanding used in the calculations of diluted earnings per share (quot;EPSquot;) were adjusted for the dilutive effect of stock-based compensation grants. All of the Company's Series C, D-1, and D-2 preferred shares were issued to and held by TMCT, LLC and TMCT II, LLC. In connection with a restructuring of these partnerships, all of these preferred shares were distributed to the Company on Sept. 22, 2006 and are no longer outstanding. The Company's Series C, D-1 and D-2 convertible preferred shares were not included in the calculation of diluted EPS for the fourth quarter of 2005 because their effects were antidilutive. Following are the calculations for the fourth quarter: Fourth Quarter 2006 2005 Income from continuing operations $ 232,086 $ 131,185 Income from discontinued operations, net of tax 6,971 3,256 Net income $ 239,057 $ 134,441 Dividends for Series C, D-1 and D-2 preferred stock - (2,094) Net income attributable to common shares $ 239,057 $ 132,347 Weighted average common shares outstanding 238,988 307,402 Adjustment for stock-based compensation grants 2,392 1,905 Adjusted weighted average common shares outstanding 241,380 309,307 Diluted earnings per share: Continuing operations $ .96 $ .42 Discontinued operations .03 .01 Net income $ .99 $ .43 (G) The number of common shares outstanding, in thousands, at Dec. 31, 2006 was 239,207. 11
  • 4. TRIBUNE COMPANY FULL YEAR RESULTS OF OPERATIONS (Unaudited) (In thousands, except per share data) FULL YEAR (A) % 2006 2005 Change OPERATING REVENUES $ 5,517,708 $ 5,511,283 0.1 OPERATING EXPENSES (B) 4,432,698 4,384,092 1.1 OPERATING PROFIT (C) 1,085,010 1,127,191 (3.7) Net Income on Equity Investments (D) 80,773 41,209 96.0 Interest and Dividend Income 14,145 7,539 87.6 Interest Expense (273,902) (155,191) 76.5 Non-Operating Items (E) 102,969 69,861 47.4 Income from Continuing Operations Before Income Taxes 1,008,995 1,090,609 (7.5) Income Taxes (E) (348,142) (567,820) (38.7) Income from Continuing Operations 660,853 522,789 26.4 (Loss) Income from Discontinued Operations, net of tax (F) (66,858) 11,900 NM NET INCOME 593,995 534,689 11.1 Preferred Dividends (6,309) (8,364) (24.6) Net Income Attributable to Common Shares $ 587,686 $ 526,325 11.7 EARNINGS PER SHARE Basic Continuing Operations $ 2.40 $ 1.64 46.3 Discontinued Operations (.25) .04 NM Net Income $ 2.16 $ 1.68 28.6 Diluted (G) Continuing Operations $ 2.39 $ 1.63 46.6 Discontinued Operations (.24) .04 NM Net Income $ 2.14 $ 1.67 28.1 DIVIDENDS PER COMMON SHARE $ .72 $ .72 - Diluted Weighted Average Common Shares Outstanding (H) 274,411 315,338 (13.0) 12
  • 5. (A) 2006 full year: Dec. 26, 2005 to Dec. 31, 2006. (53 weeks) 2005 full year: Dec. 27, 2004 to Dec. 25, 2005. (52 weeks) (B) Operating expenses for 2006 included stock-based compensation expense of $32 million, or $.07 per diluted share, ($15 million at Publishing, $6 million at Broadcasting and Entertainment and $11 million at Corporate), a charge of $20 million, or $.04 per diluted share, for severance and other payments associated with the new union contracts at Newsday, a charge of $9 million, or $.02 per diluted share, for the elimination of approximately 400 positions at Publishing, a charge of $4 million, or $.01 per diluted share, for the disposition of a press at the Los Angeles Times San Fernando Valley printing facility, a gain of $7 million, or $.02 per diluted share, from the sale of the corporate airplane, and a gain of $7 million, or $.02 per diluted share, from real property sales in Publishing. Operating expenses for 2005 included a charge of $22 million, or $.04 per diluted share, related to the shutdown of the San Fernando Valley printing facility, a charge of $45 million, or $.09 per diluted share, ($43 million at Publishing, $1 million at Broadcasting and Entertainment and $1 million at Corporate) related to the elimination of approximately 900 positions, and a pension curtailment gain of $18 million, or $.03 per diluted share ($13 million at Publishing, $1 million at Broadcasting and Entertainment and $4 million at Corporate). (C) Operating profit excludes interest and dividend income, interest expense, equity income and losses, non-operating items and income taxes. (D) Net income on equity investments for the full year 2006 included the Company's $5.9 million share of a one-time favorable income tax adjustment at CareerBuilder. (E) The full year 2006 included the following non-operating items: Pretax After-tax Gain (Loss) Gain (Loss) Diluted EPS Gain on derivatives and related investments (1) $ 11,088 $ 6,764 $ .02 Gain on TMCT transactions (2) 59,596 47,988 .17 Gain on sales of investments, net (3) 36,732 22,339 .08 Other, net (4,447) (1,044) - Income tax adjustments (4) - 33,563 .12 Total non-operating items $ 102,969 $ 109,610 $ .40 The full year 2005 included the following non-operating items: Pretax After-tax Gain Gain (Loss) Diluted EPS Gain on derivatives and related investments (1) $ 62,184 $ 37,932 $ .12 Gain on sales of investments, net 6,780 4,136 .01 Other, net 897 547 .01 Income tax adjustments (5) - (138,664) (.44) Total non-operating items $ 69,861 $ (96,049) $ (.30) (1) Gain (loss) on derivatives and related investments represents the net change in fair values of the derivative component of the Company's PHONES and the related Time Warner shares. (2) The Company recorded a gain as a result of the restructuring of the TMCT, LLC and TMCT II, LLC partnerships on Sept. 22, 2006. (3) The 2006 gain on sales of investments consisted primarily of the gain on sale of 2.8 million shares of Time Warner stock unrelated to the PHONES and a gain on the sale of the Company's investment in BrassRing. (4) In 2006, the Company recorded a favorable $34 million income tax expense adjustment, most of which related to the Company's PHONES as a result of reaching an agreement with the Internal Revenue Service appeals office pertaining to the deduction of interest expense on the PHONES. (5) On September 27, 2005, the United States Tax Court issued an opinion disallowing the 1998 tax-free reorganization of Matthew Bender, a former subsidiary of The Times Mirror Company. Tribune acquired Times Mirror in June 2000, and inherited the preexisting tax dispute at that time. Taxes and related interest for both the Matthew Bender transaction and a similar transaction completed by Times Mirror for its Mosby subsidiary in the same year totaled approximately $1 billion. Over time, deductions for state taxes and interest will reduce the net cash outlay to approximately $840 million. The Company had a tax reserve of $228 million, net of tax, related to the litigation. As a result of the Tax Court ruling, the Company increased its tax reserve by $609 million by recording additional income tax expense of $150 million and goodwill of $459 million in the third quarter of 2005. In the first quarter of 2005, the Company reduced its income tax expense and liabilities by a total of $12 million as a result of favorably resolving certain federal income tax issues. 13
  • 6. (F) In June 2006, the Company announced agreements to sell its Atlanta and Albany television stations. The sale of Atlanta closed in August 2006. In September 2006, the Company announced an agreement to sell its Boston television station. The sales of Albany and Boston closed in December 2006. Operating results for these stations are now reported as discontinued operations. Income from discontinued operations for the full year of 2006 and 2005 included the following: Full Year 2006 2005 Income from operations, net of tax (1) $ 1,415 $ 11,900 Net loss on sales, net of tax (2) (68,273) - Total $ (66,858) $ 11,900 (1) The full year 2006 included a charge of approximately $4 million, net of tax, for severance and related costs. (2) In the second quarter of 2006, the Company recorded a pretax loss of $90 million, including $80 million of allocated television group goodwill, to write down the Atlanta and Albany net assets to estimated fair value, less cost to sell. In the fourth quarter of 2006, the Company recorded a pretax gain on the sale of Boston of $41 million, reflecting $45 million of allocated goodwill. In accordance with Financial Accounting Standard (quot;FASquot;) No. 142, quot;Goodwill and Other Intangible Assetsquot;, the Company aggregates all of its television stations into one reporting unit for goodwill accounting purposes. Although less than $.1 million of goodwill was recorded when the Atlanta and Boston stations were acquired, and only $.3 million of goodwill was recorded for the Albany acquisition, FAS 142 requires the Company to allocate a portion of its television group goodwill to stations that are sold based on the fair value of the stations, relative to the fair value of the Company's remaining stations. The Company recorded a combined after-tax loss of $77 million on the sales of Atlanta and Albany and an after-tax gain of $9 million on the sale of Boston. (G) For the full year 2006 and 2005, weighted average common shares outstanding used in the calculations of diluted earnings per share (quot;EPSquot;) were adjusted for the dilutive effect of stock-based compensation grants. The Company's Series C, D-1 and D-2 convertible preferred shares were not included in the calculations of diluted EPS for either year because their effects were antidilutive. All of the Series C, D-1, and D-2 preferred shares were issued to and held by TMCT, LLC and TMCT II, LLC. In connection with a restructuring of these partnerships, all of these preferred shares were distributed to the Company on Sept. 22, 2006 and are no longer outstanding. Following are the calculations for the full year: Full Year 2006 2005 Income from continuing operations $ 660,853 $ 522,789 (Loss) income from discontinued operations, net of tax (66,858) 11,900 Net income $ 593,995 $ 534,689 Dividends for Series C, D-1 and D-2 preferred stock (6,309) (8,364) Net income attributable to common shares $ 587,686 $ 526,325 Weighted average common shares outstanding 272,672 312,880 Adjustment for stock-based compensation grants 1,739 2,458 Adjusted weighted average common shares outstanding 274,411 315,338 Diluted earnings per share: Continuing operations $ 2.39 $ 1.63 Discontinued operations (0.24) 0.04 Net income $ 2.14 $ 1.67 (H) The number of common shares outstanding, in thousands, at Dec. 31, 2006 was 239,207. 14
  • 7. TRIBUNE COMPANY BUSINESS SEGMENT DATA (Unaudited) (In thousands) FOURTH QUARTER FULL YEAR % % 2006 2005 Change 2006 2005 Change PUBLISHING Operating Revenues $ 1,111,250 $ 1,072,360 3.6 $ 4,092,562 $ 4,096,850 (0.1) Cash Operating Expenses (A) (B) (C) (840,476) (839,795) 0.1 (3,169,110) (3,146,211) 0.7 Operating Cash Flow (D) (E) 270,774 232,565 16.4 923,452 950,639 (2.9) Depreciation and Amortization Expense (F) (45,696) (58,772) (22.2) (174,263) (190,926) (8.7) Total Operating Profit (E) $ 225,078 $ 173,793 29.5 $ 749,189 $ 759,713 (1.4) BROADCASTING AND ENTERTAINMENT Operating Revenues Television $ 325,182 $ 295,913 9.9 $ 1,178,104 $ 1,165,821 1.1 Radio/Entertainment 30,421 23,723 28.2 247,042 248,612 (0.6) Total Operating Revenues 355,603 319,636 11.3 1,425,146 1,414,433 0.8 Cash Operating Expenses (A) (B) (C) Television (206,104) (189,929) 8.5 (775,147) (739,290) 4.9 Radio/Entertainment (30,156) (18,115) 66.5 (207,096) (209,767) (1.3) Total Cash Operating Expenses (236,260) (208,044) 13.6 (982,243) (949,057) 3.5 Operating Cash Flow (D) (E) Television 119,078 105,984 12.4 402,957 426,531 (5.5) Radio/Entertainment 265 5,608 (95.3) 39,946 38,845 2.8 Total Operating Cash Flow 119,343 111,592 6.9 442,903 465,376 (4.8) Depreciation and Amortization Expense Television (11,664) (10,562) 10.4 (45,059) (43,074) 4.6 Radio/Entertainment (1,793) (1,728) 3.8 (6,311) (5,411) 16.6 Total Depreciation and Amortization Expense (13,457) (12,290) 9.5 (51,370) (48,485) 6.0 Operating Profit (E) Television 107,414 95,422 12.6 357,898 383,457 (6.7) Radio/Entertainment (1,528) 3,880 NM 33,635 33,434 0.6 Total Operating Profit $ 105,886 $ 99,302 6.6 $ 391,533 $ 416,891 (6.1) CORPORATE EXPENSES Operating Cash Flow (D) (E) $ (7,272) $ (8,976) (19.0) $ (54,332) $ (47,783) 13.7 Depreciation and Amortization Expense (339) (409) (17.1) (1,380) (1,630) (15.3) Total Operating Loss (E) $ (7,611) $ (9,385) (18.9) $ (55,712) $ (49,413) 12.7 CONSOLIDATED Operating Revenues $ 1,466,853 $ 1,391,996 5.4 $ 5,517,708 $ 5,511,283 0.1 Cash Operating Expenses (A) (B) (C) (1,084,008) (1,056,815) 2.6 (4,205,685) (4,143,051) 1.5 Operating Cash Flow (D) (E) 382,845 335,181 14.2 1,312,023 1,368,232 (4.1) Depreciation and Amortization Expense (F) (59,492) (71,471) (16.8) (227,013) (241,041) (5.8) Total Operating Profit (E) $ 323,353 $ 263,710 22.6 $ 1,085,010 $ 1,127,191 (3.7) 15
  • 8. (A) The Company uses cash operating expenses to evaluate internal performance. The Company has presented cash operating expenses because it is a common measure used by rating agencies, financial analysts and investors. Cash operating expense is not a measure of financial performance under generally accepted accounting principles (quot;GAAPquot;) and should not be considered in isolation or as a substitute for measures of performance prepared in accordance with GAAP. Following is a reconciliation of operating expenses to cash operating expenses for the fourth quarter of 2006: Broadcasting and Publishing Entertainment Corporate Consolidated Operating expenses $ 886,172 $ 249,717 $ 7,611 $ 1,143,500 Less: depreciation and amortization expense 45,696 13,457 339 59,492 Cash operating expenses $ 840,476 $ 236,260 $ 7,272 $ 1,084,008 Following is a reconciliation of operating expenses to cash operating expenses for the fourth quarter of 2005: Broadcasting and Publishing Entertainment Corporate Consolidated Operating expenses $ 898,567 $ 220,334 $ 9,385 $ 1,128,286 Less: depreciation and amortization expense 58,772 12,290 409 71,471 Cash operating expenses $ 839,795 $ 208,044 $ 8,976 $ 1,056,815 Following is a reconciliation of operating expenses to cash operating expenses for the full year 2006: Broadcasting and Publishing Entertainment Corporate Consolidated Operating expenses $ 3,343,373 $ 1,033,613 $ 55,712 $ 4,432,698 Less: depreciation and amortization expense 174,263 51,370 1,380 227,013 Cash operating expenses $ 3,169,110 $ 982,243 $ 54,332 $ 4,205,685 Following is a reconciliation of operating expenses to cash operating expenses for the full year 2005: Broadcasting and Publishing Entertainment Corporate Consolidated Operating expenses $ 3,337,137 $ 997,542 $ 49,413 $ 4,384,092 Less: depreciation and amortization expense 190,926 48,485 1,630 241,041 Cash operating expenses $ 3,146,211 $ 949,057 $ 47,783 $ 4,143,051 (B) Publishing cash operating expenses for the fourth quarter and full year 2006 included charges of $7 million and $9 million, respectively, for the elimination of approximately 400 positions, and a $4 million charge for the disposition of a press from the Los Angeles Times San Fernando Valley printing facility. Publishing cash operating expenses for the full year 2006 also included a charge of $20 million for severance and other payments associated with the new union contracts at Newsday and a gain of $7 million related to real property sales. Corporate cash operating expenses for both the fourth quarter and full year 2006 included a gain of $7 million related to the sale of the corporate airplane. Cash operating expenses for the fourth quarter and full year 2005 included a charge of $6 million related to the shutdown of the San Fernando Valley printing facility, a charge of $45 million ($43 million at Publishing, $1 million at Broadcasting and Entertainment and $1 million at Corporate) related to the elimination of approximately 900 positions, and a pension curtailment gain of $18 million ($13 million at Publishing, $1 million at Broadcasting and Entertainment and $4 million at Corporate). (C) Cash operating expenses for the fourth quarter of 2006 included stock-based compensation expense of $3 million at Publishing, $1 million at Broadcasting and Entertainment and $1 million at Corporate. Cash operating expenses for the full year 2006 included stock-based compensation expense of $15 million at Publishing, $6 million at Broadcasting and Entertainment and $11 million at Corporate. (D) Operating cash flow is defined as operating profit before depreciation and amortization. The Company uses operating cash flow along with operating profit and other measures to evaluate the financial performance of the Company's business segments. The Company has presented operating cash flow because it is a common alternative measure of financial performance used by rating agencies, financial analysts and investors. These groups use operating cash flow along with other measures as a way to estimate the value of a company. The Company's definition of operating cash flow may not be consistent with that of other companies. Operating cash flow does not represent cash provided by operating activities as reflected in the Company's consolidated statements of cash flows, is not a measure of financial performance under GAAP and should not be considered in isolation or as a substitute for measures of performance prepared in accordance with GAAP. 16
  • 9. (E) Operating profit for each segment excludes interest and dividend income, interest expense, equity income and losses, non-operating items and income taxes. Following is a reconciliation of operating profit (loss) to operating cash flow for the fourth quarter of 2006: Broadcasting and Publishing Entertainment Corporate Consolidated Operating profit (loss) $ 225,078 $ 105,886 $ (7,611) $ 323,353 Add back: depreciation and amortization expense 45,696 13,457 339 59,492 Operating cash flow $ 270,774 $ 119,343 $ (7,272) $ 382,845 Following is a reconciliation of operating profit (loss) to operating cash flow for the fourth quarter of 2005: Broadcasting and Publishing Entertainment Corporate Consolidated Operating profit (loss) $ 173,793 $ 99,302 $ (9,385) $ 263,710 Add back: depreciation and amortization expense 58,772 12,290 409 71,471 Operating cash flow $ 232,565 $ 111,592 $ (8,976) $ 335,181 Following is a reconciliation of operating profit (loss) to operating cash flow for the full year 2006: Broadcasting and Publishing Entertainment Corporate Consolidated Operating profit (loss) $ 749,189 $ 391,533 $ (55,712) $ 1,085,010 Add back: depreciation and amortization expense 174,263 51,370 1,380 227,013 Operating cash flow $ 923,452 $ 442,903 $ (54,332) $ 1,312,023 Following is a reconciliation of operating profit (loss) to operating cash flow for the full year 2005: Broadcasting and Publishing Entertainment Corporate Consolidated Operating profit (loss) $ 759,713 $ 416,891 $ (49,413) $ 1,127,191 Add back: depreciation and amortization expense 190,926 48,485 1,630 241,041 Operating cash flow $ 950,639 $ 465,376 $ (47,783) $ 1,368,232 (F) Publishing depreciation and amortization expense for the fourth quarter and full year 2005 included $16 million of accelerated depreciation expense related to the shutdown of the Los Angeles Times San Fernando Valley printing facility. 17
  • 10. TRIBUNE COMPANY SUMMARY OF REVENUES AND NEWSPAPER ADVERTISING VOLUME (Unaudited) For Period 12 Ended December 31, 2006 (In thousands) Period 12 (A) Fourth Quarter (A) Full Year (A) % % % 2006 2005 Change 2006 2005 Change 2006 2005 Change Publishing Advertising $ 186,153 $ 166,216 $ 405,675 $ 380,497 $ 1,344,124 $ 1,323,547 Retail 12.0 6.6 1.6 National 99,996 81,575 22.6 218,462 211,433 3.3 736,808 774,093 (4.8) Classified 91,270 85,434 6.8 269,117 268,458 0.2 1,179,128 1,146,460 2.8 377,419 333,225 893,254 860,388 3,260,060 3,244,100 Sub-Total 13.3 3.8 0.5 63,370 56,418 149,525 148,057 575,043 596,163 Circulation 12.3 1.0 (3.5) Other 27,311 23,371 16.9 68,471 63,915 7.1 257,459 256,587 0.3 Segment Total 468,100 413,014 13.3 1,111,250 1,072,360 3.6 4,092,562 4,096,850 (0.1) Broadcasting & Entertainment Television (B) 127,215 111,412 14.2 325,182 295,913 9.9 1,178,104 1,165,821 1.1 10,764 6,056 30,421 23,723 247,042 248,612 Radio/Entertainment 77.7 28.2 (0.6) 137,979 117,468 355,603 319,636 1,425,146 1,414,433 Segment Total 17.5 11.3 0.8 $ 606,079 $ 530,482 14.3 $ 1,466,853 $ 1,391,996 5.4 $ 5,517,708 $ 5,511,283 0.1 Consolidated Revenues Total Advertising Inches (C) Full Run Retail 871 773 12.7 1,874 1,726 8.6 6,119 5,980 2.3 National 440 401 9.7 961 1,033 (7.0) 3,457 3,774 (8.4) Classified 890 834 6.7 2,365 2,452 (3.5) 10,154 10,023 1.3 Sub-Total 2,201 2,008 9.6 5,200 5,211 (0.2) 19,730 19,777 (0.2) Part Run 2,060 1,749 17.8 5,450 4,896 11.3 21,217 20,112 5.5 Total 4,261 3,757 13.4 10,650 10,107 5.4 40,947 39,889 2.7 Preprint Pieces (C) 2,035,330 1,802,090 12.9 4,482,804 4,138,538 8.3 14,928,728 14,929,047 - (A) Period 12, fourth quarter and full year 2006 include 6 weeks, 14 weeks and 53 weeks, respectively. Period 12, fourth quarter and full year 2005 include 5 weeks, 13 weeks and 52 weeks, respectively. (B) Both 2006 and 2005 exclude revenues from discontinued operations (WATL-TV in Atlanta, WLVI-TV in Boston and WCWN-TV in Albany). (C) Volume includes only the daily newspapers and is based on preliminary internal data, which may be updated in subsequent reports. 18