SlideShare uma empresa Scribd logo
1 de 11
Baixar para ler offline
DTE ENERGY COMPANY AND SUBSIDIARY COMPANIES
                                      CONSOLIDATED STATEMENT OF OPERATIONS (PRELIMINARY/UNAUDITED)
                                                              (in Millions, Except per Share Amounts)


                                                                               3 Months - December                              12 Months - December
                                                                                     2002                                             2002
                                                                        2003                     % Change                2003                     % Change


Operating Revenues                                                  $    1,692    $     1,704              -1%       $    7,041      $   6,729                5%

Operating Expenses
 Fuel, purchased power and gas                                             483            460               5%            2,241          2,099                7%
 Operation and maintenance                                                 763            743               3%            3,032          2,547               19%
 Depreciation, depletion and amortization                                  140            164             -15%              687            737               -7%
 Taxes other than income                                                    79             91             -13%              334            352               -5%
                                                                         1,465          1,458                 -           6,294          5,735               10%

Operating Income                                                           227            246              -8%              747           994               -25%

Other (Income) and Deductions
 Interest expense                                                          134            143              -6%              546           569                -4%
 Interest income                                                           (15)            (9)            -67%              (37)          (29)               28%
 Minority interest                                                         (19)           (14)            -36%              (91)          (37)                n/m
 Other income                                                              (63)           (40)            -58%             (138)          (62)                n/m
 Other expenses                                                             28             20              40%              110            51                 n/m
                                                                            65            100             -35%              390           492               -21%


Income Before Income Taxes                                                 162            146              11%              357           502               -29%

Income Tax Benefit                                                         (67)            (48)           -40%             (123)           (84)             -46%

Income from Continuing Operations                                          229            194              18%             480            586               -18%

Discontinued Operations - ITC
 Income from operations                                                    -                   9                 -               5             46             n/m
 Gain on sale                                                              -               -                    -               63         -                     -
                                                                           -                   9               -                68             46             n/m

Cumulative Effect of Accounting Changes
 Asset retirement obligations                                              -               -                   -            (11)           -                  -
 Energy trading activities                                                 -               -                   -            (16)           -                  -
                                                                           -               -                   -            (27)           -                  -

Reported Net Income                                                 $      229    $       203              13%       $      521      $    632               -18%

Reported Earnings per Diluted Share                                 $     1.36    $       1.21             13%       $     3.09      $    3.83              -19%

Significant Items Impacting Comparability
 Unusual Items
   August 2003 Blackout Costs                                              -               -               -               0.10            -                  -
  Loss on Sale of Steam Heating Business                                   -               -               -               0.08            -                  -
  Contribution to DTE Energy Foundation                                    -               -               -               0.06            -                  -
  Disallowance of Gas Costs                                                -               -               -               0.10            -                  -
  Energy Trading Activities (EITF 98-10 flowback)                          -               -               -              (0.10)           -                  -
  Effective Tax Rate Adjustment                                          (0.42)           0.03             n/m              -              -                  -

 Discontinued Operations
  Income from operations of ITC                                            -             (0.05)            -              (0.03)         (0.28)              n/m
  Gain on sale of ITC                                                      -               -               -              (0.37)           -                 -

 Cumulative Effect of Accounting Changes
  Asset Retirement Obligations (FAS 143)                                   -               -               -               0.07            -                  -
  Energy Trading Activities (EITF 98-10 implementation)                    -               -               -               0.09            -                  -

Operating Earnings per Diluted Share                                $     0.94    $       1.19            -21%       $     3.09      $    3.55              -13%

Average Common Shares
 Basic                                                                     168            167               1%             168            164                 2%
 Diluted                                                                   169            168               1%             168            165                 2%
Dividends Declared per Common Share                                 $    0.515    $     0.515                   -    $     2.06      $    2.06                    -

The Consolidated Statement of Operations (Preliminary/Unaudited) should be read in conjunction with the Notes to
Consolidated Financial Statements appearing in the Annual Report to Shareholders, 10K and 10Q.

n/m - not meaningful


                                                                                                                                                DTE Income Statement p.1
Net Income Summary
                                                            (Preliminary/Unaudited)


Net Income ($millions)                                       Reported                             Operating      Operating
                                                                                Adjustments                                   Variance
                                                               2003                                 2003           2002


Energy Resources
                                                                 $235                    $16 A        $251           $241         $10
      Regulated - Power Generation

      Non-Regulated
       Energy Services
        Coal Based Fuels
                                                                   197                   -             197            136           61
           Synfuels
                                                                    (7)                  -              (7)            52          (59)
           Coke Batteries
                                                                     9                   -               9              9          -
        On Site Energy Projects
                                                                     4                   -               4             (5)           9
        Merchant Generation
                                                                    (4)                  -              (4)           (11)           7
        Other

                                                                      8                  -                 8           13              (5)
       Coal Services

                                                                      6                  -                 6              7            (1)
       Biomass Energy

                                                                    45                   (16) B         29             25              4
       Energy Trading & CoEnergy Portfolio
                                                                   (16)                  -             (16)           (12)             (4)
       Energy Resources Overheads

                                                                   242                   (16)          226            214           12
      Total Energy Resources Non-Regulated

                                                                   477                   -             477            455           22
       Total Energy Resources

Energy Distribution
                                                                    17                    14 C          31            111          (80)
      Regulated - Power Distribution
                                                                   (15)                  -             (15)           (16)             1
      Non Regulated (Energy Technologies)
                                                                      2                   14            16             95          (79)
       Total Energy Distribution


Energy Gas
                                                                    29                    17 D          46             66          (20)
      Regulated
                                                                    29                   -              29             26              3
      Non-Regulated
                                                                    58                    17            75             92          (17)
       Total Energy Gas

Holding Company & Other
                                                                     (9)                 -                 (9)        (10)             1
      Energy Technology Investments
                                                                   (48)                   10 E         (38)           (46)             8
      Other
                                                                   (57)                   10           (47)           (56)             9
       Total Holding Company & Other

       Discontinued Operations - ITC
                                                                     5                    (5) F        -              -            -
        Income from Operations
                                                                    63                   (63) G        -              -            -
        Gain on Sale

       Cumulative Effect of Accounting Changes
                                                                   (11)                   11           -              -                  -
         Asset Retirement Obligations (FAS 143)
         Energy Trading Activities (EITF 98-10
                                                                   (16)                   16           -              -                  -
         implementation cumulative effect)


Total Net Income                                                 $521                    -            $521           $586         ($65)


Total EPS                                                        $3.09                   -           $3.09          $3.55       ($0.46)

    Diluted Shares Outstanding (millions)                           168                                 168            165


*     Includes Energy Technology Investments

Key:
A     - Blackout Costs
B     - Adjustment for rescission of EITF 98-10 Accounting Change (flow back)
C     - Loss on sale of steam heating business
D     - Disallowance of gas costs
E     - Contribution to DTE Energy Foundation
F     - Adjustment for Discontinued Operations (ITC)
G     - Gain on Sale of ITC

                                                                                                                                        2003 Net Income Summary p.2
DTE ENERGY COMPANY AND SUBSIDIARY COMPANIES
                                Earnings Variance Analysis (Preliminary/Unaudited)


2002 Reported Earnings per Share                                                                       $3.83
   Adjust for discontinued operations (ITC)                                                            (0.28)
2002 Operating Earnings per Share                                                                      $3.55
Regulated Electric                                                                                     (0.45)
   Gross Margin                                                                               (0.80)
        Weather impact                                                               (0.44)
        Incremental losses to Choice                                                 (0.27)
        Other                                                                        (0.09)

   O&M Expense                                                                                (0.21)
       Benefits Cost                                                                 (0.32)
       Uncollectable Expense                                                         (0.07)
       Storm Cost                                                                    (0.13)
       Cost reductions - generation & corp support costs, lower incentive costs       0.31


   Depreciation, Interest, Taxes & Other                                                      0.56
        Regulatory Deferral - Choice                                                 0.19
        Regulatory Deferral - Clean Air                                              0.12
        Interest - lower borrowing costs (excluding clean air related)               0.05
        Other - lower property and single business taxes, other                      0.20


Regulated Gas                                                                                          (0.13)
   Gross Margin                                                                               0.08
        Weather impact                                                               0.06
        Other                                                                        0.02

   O&M Expense                                                                                (0.28)
       Benefits Cost                                                                 (0.12)
       Uncollectable Expense                                                         (0.07)
       Other - injuries and damages, customer service initiatives                    (0.09)

Non Regulated                                                                                           0.05
   Energy Resources - higher year-over-year synfuel earnings, power contract gains            0.04
   Midstream Gas - gain on sale of Portland pipeline interest                                 0.01

Corporate and Other - primarily loss reserves in 2002                                                   0.07

2003 Operating Earnings per Share                                                                      $3.09

   Net Adjustment Operating to Reported                                                                  -
2003 Reported Earnings per Share                                                                       $3.09


                                                                                                                2003 Variance p.3
Net Income Summary
                                                         (Preliminary/Unaudited)


(in millions, except per share amounts)               Reported                                   Operating             Operating
                                                                           Adjustments                                                   Variance
                                                      Q4 2003                                     Q4 2003               Q4 2002


Energy Resources
                                                  $         103        $            -        $          103        $          71        $       32
      Regulated - Power Generation

      Non-Regulated
       Energy Services
        Coal Based Fuels
                                                              48                    -                     48                  77               (29)
           Synfuels
                                                                2                   -                       2                  2               -
           Coke Batteries
                                                                3                   -                       3                  2                  1
        On Site Energy Projects
                                                               (4)                  -                      (4)                (3)                (1)
        Merchant Generation
                                                             -                      -                    -                    (4)                 4
        Other

                                                                  1                 -                        1                     6             (5)
       Coal Services

                                                                  1                 -                        1                     2             (1)
       Biomass Energy

                                                                 (7)                -                        (7)              13               (20)
       Energy Trading & CoEnergy Portfolio
                                                                 (4)                                         (4)              -                  (4)
       Energy Resources Overheads

                                                  $              40    $            -        $           40        $          95        $      (55)
      Total Energy Resources Non-Regulated

                                                  $         143        $            -        $          143        $         166        $      (23)
       Total Energy Resources

Energy Distribution
                                                  $               2    $            -        $               2     $          14        $      (12)
      Regulated - Power Distribution
                                                                 (3)                -                        (3)                  (5)            2
      Non Regulated (Energy Technologies)
                                                  $              (1)   $            -        $               (1)   $               9    $      (10)
       Total Energy Distribution


Energy Gas
                                                  $              22    $            -        $           22        $          36        $      (14)
      Regulated
                                                                  4                 -                        4                     5             (1)
      Non-Regulated
                                                  $              26    $            -        $           26        $          41        $      (15)
       Total Energy Gas

Holding Company & Other
                                                  $          -         $            -        $           -         $              (1)   $        1
      Energy Technology Investments
                                                                 61                 (70) A                   (9)              (16)               7
      Other
                                                  $              61    $            (70)     $               (9)   $          (17)      $        8
       Total Holding Company & Other


Total Net Income                                  $         229        $            (70)     $          159        $         199        $      (40)


Total Diluted EPS                                 $         1.36       $          (0.42)     $         0.94        $         1.19       $    (0.25)

    Average Diluted Shares Outstanding                       169                                         169                  168


Key:
A     - Quarterly Effective Tax Rate Adjustment


                                                                                                                              Q4 Net Income Summary p.4
DTE ENERGY COMPANY AND SUBSIDIARY COMPANIES
                                Earnings Variance Analysis (Preliminary/Unaudited)


Q4 2002 Reported Earnings per Share                                                                      $1.21
                                                                                                          0.03
   Adjust for Q4 2002 Quarterly Effective Tax Rate Adjustment
   Adjust for discontinued operations (ITC)                                                              (0.05)
Q4 2002 Operating Earnings per Share                                                                      $1.19
Regulated Electric                                                                                        0.12
   Gross Margin                                                                                 (0.13)
        Weather impact                                                               (0.05)
        Incremental losses to Choice                                                 (0.11)
        Territory growth                                                              0.03

   O&M Expense                                                                                  0.03
       Benefits                                                                      (0.09)
       Uncollectable Expense                                                         (0.03)
       Corporate Support Allocation Adj. (offset in Regulated Gas)                    0.13
       Other - lower outage costs                                                     0.02

   Depreciation and Amort                                                                       0.16
        Regulatory Deferral - Choice                                                     0.11
        Other                                                                            0.05
   Interest & Other - lower borrowing costs and taxes                                           0.06
Regulated Gas                                                                                            (0.09)
   Gross Margin                                                                                 (0.04)
        Weather impact                                                               (0.06)
        Territory growth                                                              0.02

   O&M Expense                                                                                  (0.12)
       Benefits                                                                      (0.01)
       Uncollectable Expense                                                         (0.01)
       Corporate Support Allocation Adj. (offset in Regulated Electric)              (0.13)
       Other                                                                          0.03

   Taxes & Other                                                                                0.07
Non Regulated                                                                                            (0.32)
   Energy Services - Coke battery earnings in 2002, lower year-over-year synfuel prod.          (0.15)
   Energy Trading - Large unrealized gains at Co-Energy in 2002                                 (0.12)
   Other Non Regulated                                                                          (0.05)
Corporate & Other - primarily loss reserves in Q4 2002                                                    0.04
                                                                                                         $0.94
Q4 2003 Operating Earnings per Share

   Quarterly effective tax rate adjustment                                                                0.42
Q4 2003 Reported Earnings per Share                                                                      $1.36


                                                                                                                  Q4 Variance p.5
DTE ENERGY COMPANY
                                                                  CONSOLIDATED STATEMENT OF FINANCIAL POSITION (PRELIMINARY/UNAUDITED)
                                                                                                         (in Millions)

                                                                         Dec. 31         Dec. 31     Percent       LIABILITIES AND                                             Dec. 31           Dec. 31         Percent
ASSETS                                                                    2003            2002       Change        SHAREHOLDERS' EQUITY                                         2003              2002           Change
Current Assets                                                                                                     Current Liabilities
 Cash and cash equivalents                                           $         54    $        133      -59%         Accounts payable                                       $        625      $        647           -3%
 Restricted cash                                                              131             237      -45%         Accrued interest                                                110               115           -4%
 Accounts receivable                                                                                                Dividends payable                                                87                90           -3%
    Customer (less allow. for doubtful accounts of $99 and $82)               877             902       -3%         Accrued payroll                                                  51                49            4%
    Accrued unbilled revenues                                                 316             296        7%         Income taxes                                                    185                44            n/m
    Other                                                                     338             237       43%         Short-term borrowings                                           370               414          -11%
 Inventories                                                                                                        Current portion long-term debt, including
   Fuel and gas                                                               467             413       13%           capital leases                                                477             1,018          -53%
  Materials and supplies                                                      162             163       -1%         Liab. from risk mgmt. and trading activities                    346               284           22%
 Assets from risk management and trading activities                           186             224      -17%         Other                                                           648               552           17%
 Other                                                                        181             159       14%                                                                       2,899             3,213          -10%
                                                                            2,712           2,764       -2%        Other Liabilities
                                                                                                                    Deferred income taxes                                           988               916             8%
Investments                                                                                                         Regulatory liabilities                                          162               179           -9%
  Nuclear decommissioning trust funds                                         518             417       24%         Asset retirement obligations                                    866               -             -
  Other                                                                       601             487       23%         Unamortized investment tax credit                               156               168           -7%
                                                                            1,119             904       24%          Liab. from risk mgmt. and trading activities                   173               208          -17%
                                                                                                                                                                                    475               523           -9%
                                                                                                                         Liab. from transportation and storage contracts
Property                                                                                                             Accrued pension liability                                      345               582          -41%
 Property, plant and equipment                                             17,679          17,862       -1%          Deferred gains from asset sales                                311               161           93%
 Less accumulated depreciation and depletion                               (8,010)         (8,049)         -         Minority interest                                              156               128           22%
                                                                            9,669           9,813       -1%          Nuclear decommissioning                                         67               416          -84%
                                                                                                                     Other                                                          544               394           38%
                                                                                                                                                                                  4,243             3,675           15%
Other Assets                                                                                                       Long-Term Debt (net of current portion)
 Goodwill                                                                   2,068           2,114       -2%         Mortgage bonds, notes and other                               5,913             5,936           -
 Regulatory assets                                                          2,063           1,197       72%         Securitization bonds                                          1,496             1,585           -6%
 Securitized regulatory assets                                              1,527           1,613       -5%         Equity-linked securities                                        185               191           -3%
 Notes receivable                                                             469             336       40%         Capital lease obligations                                        75                82           -9%
  Assets from risk management and trading activities                           88             152      -42%                                                                       7,669             7,794           -2%
 Prepaid pension assets                                                       181             172        5%
 Other                                                                        202             182       11%        Commitments and Contingencies
                                                                            6,598           5,766       14%
                                                                                                                   Shareholders' Equity
                                                                                                                                                                                  3,109             3,052            2%
                                                                                                                    Common stock
                                                                                                                    Retained earnings                                             2,308             2,132            8%
                                                                                                                    Accumulated other comprehensive loss                           (130)             (619)          79%
                                                                                                                                                                                  5,287             4,565           16%

                                                                                                                   Total Liabilities and Shareholders' Equity
Total Assets                                                         $     20,098    $     19,247        4%                                                                $     20,098      $     19,247            4%

The Consolidated Statement of Financial Position (Preliminary/Unaudited) should be read in conjunction with the
Notes to Consolidated Financial Statements appearing in the Annual Report to Shareholders, Form 10K and 10Q.

n/m - not meaningful


                                                                                                                                                                                         DTE Balance Sheet p.6
DTE ENERGY COMPANY
           CONSOLIDATED STATEMENT OF CASH FLOWS (PRELIMINARY/UNAUDITED)

                                                                 12 Months - December
                                                                                 2002
                                                                 2003

(in Millions)
Operating Activities
Net Income                                                   $       521      $         632
Adjustments to reconcile net income to net cash from
 operating activities:
   Depreciation, depletion, and amortization                          691            759
   Deferred income taxes                                             (220)          (208)
   Gain on sale of assets, net                                       (129)           -
   Partners' share of synfuel project losses                          (78)           (40)
   Contributions from synfuel partners                                 65             22
   Cumulative effect of accounting changes                             27            -
   Changes in assets and liabilities, exclusive of changes
   shown separately                                                    73           (169)
   Net cash from operating activities                        $       950      $         996

Investing Activities
  Plant and equipment expenditures - regulated                       (679)          (794)
  Plant and equipment expenditures - non-regulated                    (72)          (190)
  Proceeds from sale of interests in synfuel projects                  89             32
  Proceeds from sale of ITC and other assets                          669              9
  Restricted cash for debt redemptions                                106            (79)
  Other investments                                                  (103)           (93)
   Net cash from (used for ) investing activities            $         10     $    (1,115)

Financing Activities
  Issuance of long-term debt                                          527            958
  Redemption of long-term debt                                     (1,208)          (613)
  Issuance of preferred securities                                    -              180
  Redemption of preferred securities                                  -             (180)
  Short-term borrowings, net                                          (44)          (267)
  Capital lease obligations                                             (9)          (12)
  Issuance of common stock                                             44            265
  Repurchase of common stock                                            (3)           (9)
  Dividends on common stock                                          (346)          (338)
   Net cash used for financing activities                    $     (1,039)    $         (16)


Net Decrease in Cash and Cash Equivalents                             (79)          (135)
Cash and Cash Equivalents at Beginning of the Period                 133                268
Cash and Cash Equivalents at End of the Period               $         54     $         133


                                                                                   DTE Cash Flow p.7
The Detroit Edison Company
                                          Consolidated Statement of Operations (Preliminary/Unaudited)
                                                                              (in Millions)


                                                                      3 Months - December                              12 Months - December
                                                                             2002                                             2002
                                                           2003                         % Change               2003                      % Change

                                                       $       871        $               962       -9%    $     3,695       $   4,054                    -9%
Operating Revenues

Operating Expenses
                                                               177                        233      -24%            939           1,074                  -13%
 Fuel and purchased power
                                                               327                        334       -2%          1,352           1,271                    6%
 Operation and maintenance
                                                                87                        128      -32%            473             577                  -18%
 Depreciation and amortization
                                                                53                         67      -21%            257             273                   -6%
 Taxes other than income
                                                               644                        762      -15%          3,021           3,195                   -5%

                                                               227                        200      14%            674             859                   -22%
Operating Income

Other (Income) and Deductions
                                                                   67                      79      -15%           284             311                    -9%
 Interest expense
                                                                   (7)                    -                        (7)             (1)                    n/m
 Interest income                                                                                       -
                                                                  (31)                    (20)       n/m          (93)            (36)                    n/m
 Other income
                                                                   26                      17        n/m           93              51                     n/m
 Other expense
                                                                   55                      76      -28%           277             325                   -15%

                                                               172                        124      39%            397             534                   -26%
Income Before Income Taxes

                                                                  67                          40   68%            145             178                   -19%
Income Tax Provision


                                                               105                            84   25%            252             356                   -29%
Income Before Accounting Change

                                                                      -                        -                       (6)              -
Cumulative Effect of Accounting Change                                                                 -                                                      -
Reported Earnings                                      $       105        $                   84   25%     $      246        $    356                   -31%

Cumulative Effect of Accounting Changes
                                                                  -                       -            -               6           -                          -
 Asset Retirement Obligations (FAS 143)
Unusual Items
                                                                  -                       -            -               16          -                          -
 August 2003 Blackout Costs
                                                                  -                       -            -               14          -                          -
 Loss on Sale of Steam Heating Business
                                                                  -                       -            -              -                (4)                    -
 Elimination of Intercompany Gain

Operating Earnings                                     $       105        $                   84   25%     $      282        $    352                   -20%


The Consolidated Statement of Operations (Preliminary/Unaudited) should be read in
conjunction with the Notes to Consolidated Financial Statements appearing in the
Annual Report to Shareholders, Form 10K and Form 10Q.

n/m - not meaningful


                                                                                                                                            Deco Inc. Statement p.8
Michigan Consolidated Gas Company
                                 Consolidated Statement of Operations (Preliminary/Unaudited)
                                                                          (in Millions)


                                                                      3 Months - December                              12 Months - December
                                                           2003             2002       % Change             2003             2002       % Change
Operating Revenues                                     $      414         $          370       12%      $     1,492        $       1,312               14%

Operating Expenses
 Cost of gas                                                  251                    223        13%             888                  754               18%
 Operation and maintenance                                     98                     64        53%             349                  277               26%
 Depreciation, depletion and amortization                      26                     28        -7%             105                  107               -2%
 Taxes other than income                                       10                     13       -23%              52                   51                2%
 Property write-down and contract losses                      -                      -          -                 5                   48                n/m
 Loss on sale of assets                                         3                    -          -                 3                  -                 -
                                                              385                    328        17%           1,402                1,237               13%

Operating Income                                                  29                      42   -31%                90                 75               20%

Other (Income) and Deductions
 Interest expense                                                 15                   15           -               57                59                -3%
 Interest income                                                  (2)                   (2)         -              (10)              (10)                  -
 Gain on sale of joint venture                                    (6)                 -             -               (6)              -                     -
 Other                                                            (1)                   (2)      n/m                (5)                (6)              17%
                                                                   6                   11      -45%                 36                43               -16%

Income Before Income Taxes                                        23                      31   -26%                54                 32               69%

Income Tax Provision                                                  2                   12   -83%                    9              12               -25%

                                                                  21                      19                       45                 20
Reported Earnings                                                                              11%                                                     125%


Purchase Accounting and Other Adjustments                         -                       17        -              -                  46                   -
Operating Earnings (A)                                 $          21      $               36   -42%     $          45      $          66               -32%


The Consolidated Statement of Operations (Preliminary/Unaudited) should be read
in conjunction with the Notes to Consolidated Financial Statements appearing in
the Annual Report to Shareholders, Form 10K and Form 10Q.


(A) Represents MichCon's results included in the DTE
    Energy Consolidated Statement of Operations.

n/m - not meaningful


                                                                                                                           MichCon Inc Statement p.9
Sales Analysis
                 Electric Sales - Detroit Edison Service Area (000's of GWh)                                    Electric Revenue - Detroit Edison Service Area ($000s)

                                             Q4 2003            Q4 2002           % Change                                                 Q4 2003          Q4 2002          % Change

Residential                                            3,519              3,580       -1.7%   Residential                                      314,120          318,996           -1.5%
Commercial                                             3,690              4,260      -13.4%   Commercial                                       307,033          349,664          -12.2%
Industrial                                             2,990              3,245       -7.9%   Industrial                                       149,906          168,957          -11.3%
Other                                                   666                686        -2.9%   Other                                                27,947           28,369        -1.5%
TOTAL SYSTEM                                         10,865             11,771        -7.7%   TOTAL SYSTEM                                     799,006          865,986           -7.7%
Choice Sales*                                          2,047              1,377       48.7%   Choice Sales*                                        10,439            6,722        55.3%

TOTAL SALES                                          12,912             13,148        -1.8%   TOTAL SALES                                      809,445          872,708           -7.2%


* Includes Dearborn Industrial Group sales                                                    * Includes Dearborn Industrial Group sales


                 Electric Sales - Detroit Edison Service Area (000's of GWh)                                    Electric Revenue - Detroit Edison Service Area ($000s)
                                              2003               2002             % Change                                                  2003             2002            % Change

Residential                                          15,075             15,959        -5.5%   Residential                                     1,350,882        1,433,123          -5.7%

Commercial                                           15,940             18,393       -13.3%   Commercial                                      1,309,563        1,500,143         -12.7%

Industrial                                           12,254             13,588        -9.8%   Industrial                                       632,489          699,712           -9.6%

Other                                                  2,621              2,653       -1.2%   Other                                            115,975          114,437            1.3%

TOTAL SYSTEM                                         45,890             50,593        -9.3%   TOTAL SYSTEM                                    3,408,909        3,747,415          -9.0%

                                                                                              Choice Sales*                                        35,443           19,339
Choice Sales *                                         7,237              3,954       83.0%                                                                                       83.3%

TOTAL SALES                                          53,127 #           54,547        -2.6%   TOTAL SALES                                     3,444,352        3,766,754          -8.6%

* Includes Dearborn Industrial Group sales                                                    * Includes Dearborn Industrial Group sales


         Gas Sales and End User Transportation- MichCon Service Area (Mcf)                    Gas - MichCon Service

                                              2003               2002             % Change                                                 Q4 2003          Q4 2002          % Change

Residential                                   129,551,203        129,740,574          -0.1%   Residential                                   40,307,846       41,713,952           -3.4%
Commercial                                     41,135,858         38,916,292           5.7%   Commercial                                    12,102,969       11,328,746            6.8%
Industrial                                      1,526,112          1,570,220          -2.8%   Industrial                                       466,728          331,964           40.6%
                                              172,213,173        170,227,086           1.2%                                                  52,877,543       53,374,662          -0.9%
                                                                                              End Use Transportation
                                                                                              (includes choice customers)
End User Transportation*                      151,089,646        169,524,109         -10.9%                                                 38,042,355       47,787,008          -20.4%

TOTAL SALES                                                                           -4.8%
                                              323,302,819        339,751,195                  TOTAL SALES                                   90,919,898      101,161,670          -10.1%
* includes choice customers                                                                   * includes choice customers


                                                                                                                                                                                          Sales p.10
DTE Energy Debt/Equity Calculation
                             As of December 31, 2003
                                     ($ millions)


                         Short-term borrowings             $370
               Current portion LTD + cap leases             477
Mortgage bonds, notes, and other long-term debt            5,913
                           Securitization bonds            1,496
                                 Capital leases              75
                                   Less QUIDS               385
                          Less Trust Preferreds             280
                 Less MichCon short-term debt               238
                        Less securitization debt           1,585


                                     Total debt           $5,843


                                Trust preferred            $280
                                         QUIDS              385
                         Mandatory convertible              185
                         Total preferred/ other            $850


                                         Equity           $5,287


                                     Total cap           $11,980


                                            Debt           48.8%
                          Preferred stock/ other            7.1%
                  Common shareholders' equity              44.1%


                                           Total          100.0%


                                                                   Leverage Calc p.11

Mais conteúdo relacionado

Mais procurados

gannett 2000ar
gannett 2000argannett 2000ar
gannett 2000arfinance30
 
Duke_Energy_2005_Annual_Report
Duke_Energy_2005_Annual_ReportDuke_Energy_2005_Annual_Report
Duke_Energy_2005_Annual_Reportfinance21
 
Telenor Financial Statement Ratios
Telenor Financial Statement RatiosTelenor Financial Statement Ratios
Telenor Financial Statement RatiosAHMAD MUJTABA MALIK
 
ameriprise 3Q05_StatSupp_1305
ameriprise 3Q05_StatSupp_1305ameriprise 3Q05_StatSupp_1305
ameriprise 3Q05_StatSupp_1305finance43
 
omnicare annual reports 1998
omnicare annual reports 1998omnicare annual reports 1998
omnicare annual reports 1998finance46
 
CLOrox 1.%20Consolidated%20Earnings%20Segment%20Information%20and%20Consoli...
CLOrox   1.%20Consolidated%20Earnings%20Segment%20Information%20and%20Consoli...CLOrox   1.%20Consolidated%20Earnings%20Segment%20Information%20and%20Consoli...
CLOrox 1.%20Consolidated%20Earnings%20Segment%20Information%20and%20Consoli...finance48
 
ColorLine årsrapport engelsk 2008
ColorLine årsrapport engelsk 2008ColorLine årsrapport engelsk 2008
ColorLine årsrapport engelsk 2008Color Line
 
Press Release 1 Q00 Tele Celular Sul En
Press Release 1 Q00   Tele Celular Sul EnPress Release 1 Q00   Tele Celular Sul En
Press Release 1 Q00 Tele Celular Sul EnTIM RI
 
Aggreko 2011 Preliminary Results Presentation
Aggreko 2011 Preliminary Results PresentationAggreko 2011 Preliminary Results Presentation
Aggreko 2011 Preliminary Results PresentationAggreko plc
 
CLX0802BalSheet-159951
CLX0802BalSheet-159951CLX0802BalSheet-159951
CLX0802BalSheet-159951finance48
 
Conforming Wireless P&L for 12 Months Ending 9/30/07
 	Conforming Wireless P&L for 12 Months Ending 9/30/07 	Conforming Wireless P&L for 12 Months Ending 9/30/07
Conforming Wireless P&L for 12 Months Ending 9/30/07finance6
 
ameriprise 4Q05_Supplement
ameriprise 4Q05_Supplementameriprise 4Q05_Supplement
ameriprise 4Q05_Supplementfinance43
 
dte_2Q05supplemental
dte_2Q05supplementaldte_2Q05supplemental
dte_2Q05supplementalfinance41
 

Mais procurados (16)

gannett 2000ar
gannett 2000argannett 2000ar
gannett 2000ar
 
Duke_Energy_2005_Annual_Report
Duke_Energy_2005_Annual_ReportDuke_Energy_2005_Annual_Report
Duke_Energy_2005_Annual_Report
 
Telenor Financial Statement Ratios
Telenor Financial Statement RatiosTelenor Financial Statement Ratios
Telenor Financial Statement Ratios
 
ameriprise 3Q05_StatSupp_1305
ameriprise 3Q05_StatSupp_1305ameriprise 3Q05_StatSupp_1305
ameriprise 3Q05_StatSupp_1305
 
omnicare annual reports 1998
omnicare annual reports 1998omnicare annual reports 1998
omnicare annual reports 1998
 
CLOrox 1.%20Consolidated%20Earnings%20Segment%20Information%20and%20Consoli...
CLOrox   1.%20Consolidated%20Earnings%20Segment%20Information%20and%20Consoli...CLOrox   1.%20Consolidated%20Earnings%20Segment%20Information%20and%20Consoli...
CLOrox 1.%20Consolidated%20Earnings%20Segment%20Information%20and%20Consoli...
 
ColorLine årsrapport engelsk 2008
ColorLine årsrapport engelsk 2008ColorLine årsrapport engelsk 2008
ColorLine årsrapport engelsk 2008
 
Telenor Financial statment
Telenor Financial statmentTelenor Financial statment
Telenor Financial statment
 
Press Release 1 Q00 Tele Celular Sul En
Press Release 1 Q00   Tele Celular Sul EnPress Release 1 Q00   Tele Celular Sul En
Press Release 1 Q00 Tele Celular Sul En
 
Aggreko 2011 Preliminary Results Presentation
Aggreko 2011 Preliminary Results PresentationAggreko 2011 Preliminary Results Presentation
Aggreko 2011 Preliminary Results Presentation
 
CLX0802BalSheet-159951
CLX0802BalSheet-159951CLX0802BalSheet-159951
CLX0802BalSheet-159951
 
Conforming Wireless P&L for 12 Months Ending 9/30/07
 	Conforming Wireless P&L for 12 Months Ending 9/30/07 	Conforming Wireless P&L for 12 Months Ending 9/30/07
Conforming Wireless P&L for 12 Months Ending 9/30/07
 
Second Quarter 2007 Earnings Presentation
Second Quarter 2007 Earnings PresentationSecond Quarter 2007 Earnings Presentation
Second Quarter 2007 Earnings Presentation
 
CMC q4 fy08
CMC q4 fy08CMC q4 fy08
CMC q4 fy08
 
ameriprise 4Q05_Supplement
ameriprise 4Q05_Supplementameriprise 4Q05_Supplement
ameriprise 4Q05_Supplement
 
dte_2Q05supplemental
dte_2Q05supplementaldte_2Q05supplemental
dte_2Q05supplemental
 

Semelhante a dte_q403supp

Q32003_supplemental
Q32003_supplementalQ32003_supplemental
Q32003_supplementalfinance41
 
citigroup October 16, 2008 - Third Quarter Press Release
citigroup October 16, 2008 - Third Quarter Press Releasecitigroup October 16, 2008 - Third Quarter Press Release
citigroup October 16, 2008 - Third Quarter Press ReleaseQuarterlyEarningsReports
 
2Q11 Presentation
2Q11 Presentation2Q11 Presentation
2Q11 PresentationGafisa RI !
 
citigroup Financial Supplement July 18, 2008 - Second Quarter
citigroup Financial Supplement July 18, 2008 - Second Quartercitigroup Financial Supplement July 18, 2008 - Second Quarter
citigroup Financial Supplement July 18, 2008 - Second QuarterQuarterlyEarningsReports
 
citigroup Financial Supplement July 18, 2008 - Second Quarter
citigroup Financial Supplement July 18, 2008 - Second Quartercitigroup Financial Supplement July 18, 2008 - Second Quarter
citigroup Financial Supplement July 18, 2008 - Second QuarterQuarterlyEarningsReports
 
advanced micro devices Q408Financials
advanced micro devices Q408Financialsadvanced micro devices Q408Financials
advanced micro devices Q408Financialsfinance34
 
AMD Q408Financials
AMD Q408FinancialsAMD Q408Financials
AMD Q408Financialsfinance34
 
AMD-Q408Financials
AMD-Q408FinancialsAMD-Q408Financials
AMD-Q408Financialsfinance34
 
AMD Q408Financials
AMD Q408FinancialsAMD Q408Financials
AMD Q408Financialsfinance34
 
advanced micro devices Q408Financials
advanced micro devices Q408Financialsadvanced micro devices Q408Financials
advanced micro devices Q408Financialsfinance34
 
rmk_111303operating
rmk_111303operatingrmk_111303operating
rmk_111303operatingfinance22
 
rmk_111303operating
rmk_111303operatingrmk_111303operating
rmk_111303operatingfinance22
 
alltel 1q 08_highlights
alltel  1q 08_highlightsalltel  1q 08_highlights
alltel 1q 08_highlightsfinance27
 
chubb 8921 Supplementary Investor Information
chubb 8921 Supplementary Investor Informationchubb 8921 Supplementary Investor Information
chubb 8921 Supplementary Investor Informationfinance18
 

Semelhante a dte_q403supp (20)

Q32003_supplemental
Q32003_supplementalQ32003_supplemental
Q32003_supplemental
 
citigroup Qer084s
citigroup Qer084scitigroup Qer084s
citigroup Qer084s
 
citigroup Qer084s
citigroup Qer084scitigroup Qer084s
citigroup Qer084s
 
2Q09 Results
2Q09 Results2Q09 Results
2Q09 Results
 
3Q09 Results
3Q09 Results3Q09 Results
3Q09 Results
 
citigroup October 16, 2008 - Third Quarter Press Release
citigroup October 16, 2008 - Third Quarter Press Releasecitigroup October 16, 2008 - Third Quarter Press Release
citigroup October 16, 2008 - Third Quarter Press Release
 
dtefin1
dtefin1dtefin1
dtefin1
 
.credit-suisse - Presentation
 .credit-suisse - Presentation .credit-suisse - Presentation
.credit-suisse - Presentation
 
2Q11 Presentation
2Q11 Presentation2Q11 Presentation
2Q11 Presentation
 
citigroup Financial Supplement July 18, 2008 - Second Quarter
citigroup Financial Supplement July 18, 2008 - Second Quartercitigroup Financial Supplement July 18, 2008 - Second Quarter
citigroup Financial Supplement July 18, 2008 - Second Quarter
 
citigroup Financial Supplement July 18, 2008 - Second Quarter
citigroup Financial Supplement July 18, 2008 - Second Quartercitigroup Financial Supplement July 18, 2008 - Second Quarter
citigroup Financial Supplement July 18, 2008 - Second Quarter
 
advanced micro devices Q408Financials
advanced micro devices Q408Financialsadvanced micro devices Q408Financials
advanced micro devices Q408Financials
 
AMD Q408Financials
AMD Q408FinancialsAMD Q408Financials
AMD Q408Financials
 
AMD-Q408Financials
AMD-Q408FinancialsAMD-Q408Financials
AMD-Q408Financials
 
AMD Q408Financials
AMD Q408FinancialsAMD Q408Financials
AMD Q408Financials
 
advanced micro devices Q408Financials
advanced micro devices Q408Financialsadvanced micro devices Q408Financials
advanced micro devices Q408Financials
 
rmk_111303operating
rmk_111303operatingrmk_111303operating
rmk_111303operating
 
rmk_111303operating
rmk_111303operatingrmk_111303operating
rmk_111303operating
 
alltel 1q 08_highlights
alltel  1q 08_highlightsalltel  1q 08_highlights
alltel 1q 08_highlights
 
chubb 8921 Supplementary Investor Information
chubb 8921 Supplementary Investor Informationchubb 8921 Supplementary Investor Information
chubb 8921 Supplementary Investor Information
 

Mais de finance41

pepco POMSlides
pepco POMSlidespepco POMSlides
pepco POMSlidesfinance41
 
pepco Berenson0306
pepco Berenson0306pepco Berenson0306
pepco Berenson0306finance41
 
pepco EdwardJones0306
pepco EdwardJones0306pepco EdwardJones0306
pepco EdwardJones0306finance41
 
pepco 2006JulyInvestorMeetings
pepco 2006JulyInvestorMeetingspepco 2006JulyInvestorMeetings
pepco 2006JulyInvestorMeetingsfinance41
 
pepco Presentation081706
pepco Presentation081706pepco Presentation081706
pepco Presentation081706finance41
 
pepco FallEEIl
pepco FallEEIlpepco FallEEIl
pepco FallEEIlfinance41
 
pepco WSUG107
pepco WSUG107pepco WSUG107
pepco WSUG107finance41
 
pepco AugustInvestorMeetings2007Final
pepco AugustInvestorMeetings2007Finalpepco AugustInvestorMeetings2007Final
pepco AugustInvestorMeetings2007Finalfinance41
 
pepco MerillLynchPower&GasConferenceSept2007(final)
pepco MerillLynchPower&GasConferenceSept2007(final)pepco MerillLynchPower&GasConferenceSept2007(final)
pepco MerillLynchPower&GasConferenceSept2007(final)finance41
 
pepco POMFallEEI2007
pepco POMFallEEI2007pepco POMFallEEI2007
pepco POMFallEEI2007finance41
 
pepco WallStBerensonFINAL
pepco WallStBerensonFINALpepco WallStBerensonFINAL
pepco WallStBerensonFINALfinance41
 
pepco POMAGAPresentation(final)
pepco POMAGAPresentation(final)pepco POMAGAPresentation(final)
pepco POMAGAPresentation(final)finance41
 
PHI_ProxyAnnual_Report2002
PHI_ProxyAnnual_Report2002PHI_ProxyAnnual_Report2002
PHI_ProxyAnnual_Report2002finance41
 
PHI_ProxyAnnual_Report2002
PHI_ProxyAnnual_Report2002PHI_ProxyAnnual_Report2002
PHI_ProxyAnnual_Report2002finance41
 
PHI_ProxyAnnual_Report2004
PHI_ProxyAnnual_Report2004PHI_ProxyAnnual_Report2004
PHI_ProxyAnnual_Report2004finance41
 
PHI_ProxyAnnual_Report2003
PHI_ProxyAnnual_Report2003PHI_ProxyAnnual_Report2003
PHI_ProxyAnnual_Report2003finance41
 
PHI_ProxyAnnual_Report2003
PHI_ProxyAnnual_Report2003PHI_ProxyAnnual_Report2003
PHI_ProxyAnnual_Report2003finance41
 
PHI_ProxyAnnual_Report2004
PHI_ProxyAnnual_Report2004PHI_ProxyAnnual_Report2004
PHI_ProxyAnnual_Report2004finance41
 
phi proxystatement2005report
phi proxystatement2005reportphi proxystatement2005report
phi proxystatement2005reportfinance41
 

Mais de finance41 (20)

pepco POMSlides
pepco POMSlidespepco POMSlides
pepco POMSlides
 
pepco Berenson0306
pepco Berenson0306pepco Berenson0306
pepco Berenson0306
 
pepco EdwardJones0306
pepco EdwardJones0306pepco EdwardJones0306
pepco EdwardJones0306
 
pepco 2006JulyInvestorMeetings
pepco 2006JulyInvestorMeetingspepco 2006JulyInvestorMeetings
pepco 2006JulyInvestorMeetings
 
pepco Presentation081706
pepco Presentation081706pepco Presentation081706
pepco Presentation081706
 
pepco FallEEIl
pepco FallEEIlpepco FallEEIl
pepco FallEEIl
 
pepco WSUG107
pepco WSUG107pepco WSUG107
pepco WSUG107
 
pepco AugustInvestorMeetings2007Final
pepco AugustInvestorMeetings2007Finalpepco AugustInvestorMeetings2007Final
pepco AugustInvestorMeetings2007Final
 
pepco MerillLynchPower&GasConferenceSept2007(final)
pepco MerillLynchPower&GasConferenceSept2007(final)pepco MerillLynchPower&GasConferenceSept2007(final)
pepco MerillLynchPower&GasConferenceSept2007(final)
 
pepco POMFallEEI2007
pepco POMFallEEI2007pepco POMFallEEI2007
pepco POMFallEEI2007
 
pepco WallStBerensonFINAL
pepco WallStBerensonFINALpepco WallStBerensonFINAL
pepco WallStBerensonFINAL
 
pepco POM2
pepco POM2pepco POM2
pepco POM2
 
pepco POMAGAPresentation(final)
pepco POMAGAPresentation(final)pepco POMAGAPresentation(final)
pepco POMAGAPresentation(final)
 
PHI_ProxyAnnual_Report2002
PHI_ProxyAnnual_Report2002PHI_ProxyAnnual_Report2002
PHI_ProxyAnnual_Report2002
 
PHI_ProxyAnnual_Report2002
PHI_ProxyAnnual_Report2002PHI_ProxyAnnual_Report2002
PHI_ProxyAnnual_Report2002
 
PHI_ProxyAnnual_Report2004
PHI_ProxyAnnual_Report2004PHI_ProxyAnnual_Report2004
PHI_ProxyAnnual_Report2004
 
PHI_ProxyAnnual_Report2003
PHI_ProxyAnnual_Report2003PHI_ProxyAnnual_Report2003
PHI_ProxyAnnual_Report2003
 
PHI_ProxyAnnual_Report2003
PHI_ProxyAnnual_Report2003PHI_ProxyAnnual_Report2003
PHI_ProxyAnnual_Report2003
 
PHI_ProxyAnnual_Report2004
PHI_ProxyAnnual_Report2004PHI_ProxyAnnual_Report2004
PHI_ProxyAnnual_Report2004
 
phi proxystatement2005report
phi proxystatement2005reportphi proxystatement2005report
phi proxystatement2005report
 

Último

call girls in Nand Nagri (DELHI) 🔝 >༒9953330565🔝 genuine Escort Service 🔝✔️✔️
call girls in  Nand Nagri (DELHI) 🔝 >༒9953330565🔝 genuine Escort Service 🔝✔️✔️call girls in  Nand Nagri (DELHI) 🔝 >༒9953330565🔝 genuine Escort Service 🔝✔️✔️
call girls in Nand Nagri (DELHI) 🔝 >༒9953330565🔝 genuine Escort Service 🔝✔️✔️9953056974 Low Rate Call Girls In Saket, Delhi NCR
 
fca-bsps-decision-letter-redacted (1).pdf
fca-bsps-decision-letter-redacted (1).pdffca-bsps-decision-letter-redacted (1).pdf
fca-bsps-decision-letter-redacted (1).pdfHenry Tapper
 
Financial Leverage Definition, Advantages, and Disadvantages
Financial Leverage Definition, Advantages, and DisadvantagesFinancial Leverage Definition, Advantages, and Disadvantages
Financial Leverage Definition, Advantages, and Disadvantagesjayjaymabutot13
 
Tenets of Physiocracy History of Economic
Tenets of Physiocracy History of EconomicTenets of Physiocracy History of Economic
Tenets of Physiocracy History of Economiccinemoviesu
 
原版1:1复刻温哥华岛大学毕业证Vancouver毕业证留信学历认证
原版1:1复刻温哥华岛大学毕业证Vancouver毕业证留信学历认证原版1:1复刻温哥华岛大学毕业证Vancouver毕业证留信学历认证
原版1:1复刻温哥华岛大学毕业证Vancouver毕业证留信学历认证rjrjkk
 
(办理学位证)加拿大萨省大学毕业证成绩单原版一比一
(办理学位证)加拿大萨省大学毕业证成绩单原版一比一(办理学位证)加拿大萨省大学毕业证成绩单原版一比一
(办理学位证)加拿大萨省大学毕业证成绩单原版一比一S SDS
 
BPPG response - Options for Defined Benefit schemes - 19Apr24.pdf
BPPG response - Options for Defined Benefit schemes - 19Apr24.pdfBPPG response - Options for Defined Benefit schemes - 19Apr24.pdf
BPPG response - Options for Defined Benefit schemes - 19Apr24.pdfHenry Tapper
 
letter-from-the-chair-to-the-fca-relating-to-british-steel-pensions-scheme-15...
letter-from-the-chair-to-the-fca-relating-to-british-steel-pensions-scheme-15...letter-from-the-chair-to-the-fca-relating-to-british-steel-pensions-scheme-15...
letter-from-the-chair-to-the-fca-relating-to-british-steel-pensions-scheme-15...Henry Tapper
 
The Core Functions of the Bangko Sentral ng Pilipinas
The Core Functions of the Bangko Sentral ng PilipinasThe Core Functions of the Bangko Sentral ng Pilipinas
The Core Functions of the Bangko Sentral ng PilipinasCherylouCamus
 
Quantitative Analysis of Retail Sector Companies
Quantitative Analysis of Retail Sector CompaniesQuantitative Analysis of Retail Sector Companies
Quantitative Analysis of Retail Sector Companiesprashantbhati354
 
The Triple Threat | Article on Global Resession | Harsh Kumar
The Triple Threat | Article on Global Resession | Harsh KumarThe Triple Threat | Article on Global Resession | Harsh Kumar
The Triple Threat | Article on Global Resession | Harsh KumarHarsh Kumar
 
Current Economic situation of Pakistan .pptx
Current Economic situation of Pakistan .pptxCurrent Economic situation of Pakistan .pptx
Current Economic situation of Pakistan .pptxuzma244191
 
Economics, Commerce and Trade Management: An International Journal (ECTIJ)
Economics, Commerce and Trade Management: An International Journal (ECTIJ)Economics, Commerce and Trade Management: An International Journal (ECTIJ)
Economics, Commerce and Trade Management: An International Journal (ECTIJ)ECTIJ
 
magnetic-pensions-a-new-blueprint-for-the-dc-landscape.pdf
magnetic-pensions-a-new-blueprint-for-the-dc-landscape.pdfmagnetic-pensions-a-new-blueprint-for-the-dc-landscape.pdf
magnetic-pensions-a-new-blueprint-for-the-dc-landscape.pdfHenry Tapper
 
原版1:1复刻堪萨斯大学毕业证KU毕业证留信学历认证
原版1:1复刻堪萨斯大学毕业证KU毕业证留信学历认证原版1:1复刻堪萨斯大学毕业证KU毕业证留信学历认证
原版1:1复刻堪萨斯大学毕业证KU毕业证留信学历认证jdkhjh
 
(办理原版一样)QUT毕业证昆士兰科技大学毕业证学位证留信学历认证成绩单补办
(办理原版一样)QUT毕业证昆士兰科技大学毕业证学位证留信学历认证成绩单补办(办理原版一样)QUT毕业证昆士兰科技大学毕业证学位证留信学历认证成绩单补办
(办理原版一样)QUT毕业证昆士兰科技大学毕业证学位证留信学历认证成绩单补办fqiuho152
 
Stock Market Brief Deck for "this does not happen often".pdf
Stock Market Brief Deck for "this does not happen often".pdfStock Market Brief Deck for "this does not happen often".pdf
Stock Market Brief Deck for "this does not happen often".pdfMichael Silva
 
(中央兰开夏大学毕业证学位证成绩单-案例)
(中央兰开夏大学毕业证学位证成绩单-案例)(中央兰开夏大学毕业证学位证成绩单-案例)
(中央兰开夏大学毕业证学位证成绩单-案例)twfkn8xj
 

Último (20)

call girls in Nand Nagri (DELHI) 🔝 >༒9953330565🔝 genuine Escort Service 🔝✔️✔️
call girls in  Nand Nagri (DELHI) 🔝 >༒9953330565🔝 genuine Escort Service 🔝✔️✔️call girls in  Nand Nagri (DELHI) 🔝 >༒9953330565🔝 genuine Escort Service 🔝✔️✔️
call girls in Nand Nagri (DELHI) 🔝 >༒9953330565🔝 genuine Escort Service 🔝✔️✔️
 
fca-bsps-decision-letter-redacted (1).pdf
fca-bsps-decision-letter-redacted (1).pdffca-bsps-decision-letter-redacted (1).pdf
fca-bsps-decision-letter-redacted (1).pdf
 
Financial Leverage Definition, Advantages, and Disadvantages
Financial Leverage Definition, Advantages, and DisadvantagesFinancial Leverage Definition, Advantages, and Disadvantages
Financial Leverage Definition, Advantages, and Disadvantages
 
🔝+919953056974 🔝young Delhi Escort service Pusa Road
🔝+919953056974 🔝young Delhi Escort service Pusa Road🔝+919953056974 🔝young Delhi Escort service Pusa Road
🔝+919953056974 🔝young Delhi Escort service Pusa Road
 
Tenets of Physiocracy History of Economic
Tenets of Physiocracy History of EconomicTenets of Physiocracy History of Economic
Tenets of Physiocracy History of Economic
 
原版1:1复刻温哥华岛大学毕业证Vancouver毕业证留信学历认证
原版1:1复刻温哥华岛大学毕业证Vancouver毕业证留信学历认证原版1:1复刻温哥华岛大学毕业证Vancouver毕业证留信学历认证
原版1:1复刻温哥华岛大学毕业证Vancouver毕业证留信学历认证
 
(办理学位证)加拿大萨省大学毕业证成绩单原版一比一
(办理学位证)加拿大萨省大学毕业证成绩单原版一比一(办理学位证)加拿大萨省大学毕业证成绩单原版一比一
(办理学位证)加拿大萨省大学毕业证成绩单原版一比一
 
BPPG response - Options for Defined Benefit schemes - 19Apr24.pdf
BPPG response - Options for Defined Benefit schemes - 19Apr24.pdfBPPG response - Options for Defined Benefit schemes - 19Apr24.pdf
BPPG response - Options for Defined Benefit schemes - 19Apr24.pdf
 
letter-from-the-chair-to-the-fca-relating-to-british-steel-pensions-scheme-15...
letter-from-the-chair-to-the-fca-relating-to-british-steel-pensions-scheme-15...letter-from-the-chair-to-the-fca-relating-to-british-steel-pensions-scheme-15...
letter-from-the-chair-to-the-fca-relating-to-british-steel-pensions-scheme-15...
 
The Core Functions of the Bangko Sentral ng Pilipinas
The Core Functions of the Bangko Sentral ng PilipinasThe Core Functions of the Bangko Sentral ng Pilipinas
The Core Functions of the Bangko Sentral ng Pilipinas
 
Quantitative Analysis of Retail Sector Companies
Quantitative Analysis of Retail Sector CompaniesQuantitative Analysis of Retail Sector Companies
Quantitative Analysis of Retail Sector Companies
 
The Triple Threat | Article on Global Resession | Harsh Kumar
The Triple Threat | Article on Global Resession | Harsh KumarThe Triple Threat | Article on Global Resession | Harsh Kumar
The Triple Threat | Article on Global Resession | Harsh Kumar
 
Current Economic situation of Pakistan .pptx
Current Economic situation of Pakistan .pptxCurrent Economic situation of Pakistan .pptx
Current Economic situation of Pakistan .pptx
 
Economics, Commerce and Trade Management: An International Journal (ECTIJ)
Economics, Commerce and Trade Management: An International Journal (ECTIJ)Economics, Commerce and Trade Management: An International Journal (ECTIJ)
Economics, Commerce and Trade Management: An International Journal (ECTIJ)
 
magnetic-pensions-a-new-blueprint-for-the-dc-landscape.pdf
magnetic-pensions-a-new-blueprint-for-the-dc-landscape.pdfmagnetic-pensions-a-new-blueprint-for-the-dc-landscape.pdf
magnetic-pensions-a-new-blueprint-for-the-dc-landscape.pdf
 
原版1:1复刻堪萨斯大学毕业证KU毕业证留信学历认证
原版1:1复刻堪萨斯大学毕业证KU毕业证留信学历认证原版1:1复刻堪萨斯大学毕业证KU毕业证留信学历认证
原版1:1复刻堪萨斯大学毕业证KU毕业证留信学历认证
 
(办理原版一样)QUT毕业证昆士兰科技大学毕业证学位证留信学历认证成绩单补办
(办理原版一样)QUT毕业证昆士兰科技大学毕业证学位证留信学历认证成绩单补办(办理原版一样)QUT毕业证昆士兰科技大学毕业证学位证留信学历认证成绩单补办
(办理原版一样)QUT毕业证昆士兰科技大学毕业证学位证留信学历认证成绩单补办
 
Stock Market Brief Deck for "this does not happen often".pdf
Stock Market Brief Deck for "this does not happen often".pdfStock Market Brief Deck for "this does not happen often".pdf
Stock Market Brief Deck for "this does not happen often".pdf
 
Monthly Economic Monitoring of Ukraine No 231, April 2024
Monthly Economic Monitoring of Ukraine No 231, April 2024Monthly Economic Monitoring of Ukraine No 231, April 2024
Monthly Economic Monitoring of Ukraine No 231, April 2024
 
(中央兰开夏大学毕业证学位证成绩单-案例)
(中央兰开夏大学毕业证学位证成绩单-案例)(中央兰开夏大学毕业证学位证成绩单-案例)
(中央兰开夏大学毕业证学位证成绩单-案例)
 

dte_q403supp

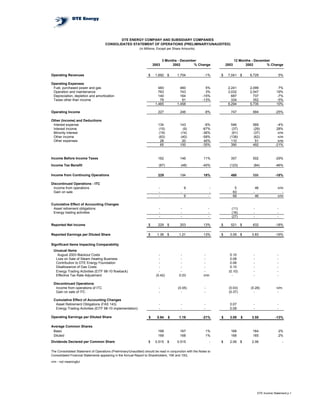
  • 1. DTE ENERGY COMPANY AND SUBSIDIARY COMPANIES CONSOLIDATED STATEMENT OF OPERATIONS (PRELIMINARY/UNAUDITED) (in Millions, Except per Share Amounts) 3 Months - December 12 Months - December 2002 2002 2003 % Change 2003 % Change Operating Revenues $ 1,692 $ 1,704 -1% $ 7,041 $ 6,729 5% Operating Expenses Fuel, purchased power and gas 483 460 5% 2,241 2,099 7% Operation and maintenance 763 743 3% 3,032 2,547 19% Depreciation, depletion and amortization 140 164 -15% 687 737 -7% Taxes other than income 79 91 -13% 334 352 -5% 1,465 1,458 - 6,294 5,735 10% Operating Income 227 246 -8% 747 994 -25% Other (Income) and Deductions Interest expense 134 143 -6% 546 569 -4% Interest income (15) (9) -67% (37) (29) 28% Minority interest (19) (14) -36% (91) (37) n/m Other income (63) (40) -58% (138) (62) n/m Other expenses 28 20 40% 110 51 n/m 65 100 -35% 390 492 -21% Income Before Income Taxes 162 146 11% 357 502 -29% Income Tax Benefit (67) (48) -40% (123) (84) -46% Income from Continuing Operations 229 194 18% 480 586 -18% Discontinued Operations - ITC Income from operations - 9 - 5 46 n/m Gain on sale - - - 63 - - - 9 - 68 46 n/m Cumulative Effect of Accounting Changes Asset retirement obligations - - - (11) - - Energy trading activities - - - (16) - - - - - (27) - - Reported Net Income $ 229 $ 203 13% $ 521 $ 632 -18% Reported Earnings per Diluted Share $ 1.36 $ 1.21 13% $ 3.09 $ 3.83 -19% Significant Items Impacting Comparability Unusual Items August 2003 Blackout Costs - - - 0.10 - - Loss on Sale of Steam Heating Business - - - 0.08 - - Contribution to DTE Energy Foundation - - - 0.06 - - Disallowance of Gas Costs - - - 0.10 - - Energy Trading Activities (EITF 98-10 flowback) - - - (0.10) - - Effective Tax Rate Adjustment (0.42) 0.03 n/m - - - Discontinued Operations Income from operations of ITC - (0.05) - (0.03) (0.28) n/m Gain on sale of ITC - - - (0.37) - - Cumulative Effect of Accounting Changes Asset Retirement Obligations (FAS 143) - - - 0.07 - - Energy Trading Activities (EITF 98-10 implementation) - - - 0.09 - - Operating Earnings per Diluted Share $ 0.94 $ 1.19 -21% $ 3.09 $ 3.55 -13% Average Common Shares Basic 168 167 1% 168 164 2% Diluted 169 168 1% 168 165 2% Dividends Declared per Common Share $ 0.515 $ 0.515 - $ 2.06 $ 2.06 - The Consolidated Statement of Operations (Preliminary/Unaudited) should be read in conjunction with the Notes to Consolidated Financial Statements appearing in the Annual Report to Shareholders, 10K and 10Q. n/m - not meaningful DTE Income Statement p.1
  • 2. Net Income Summary (Preliminary/Unaudited) Net Income ($millions) Reported Operating Operating Adjustments Variance 2003 2003 2002 Energy Resources $235 $16 A $251 $241 $10 Regulated - Power Generation Non-Regulated Energy Services Coal Based Fuels 197 - 197 136 61 Synfuels (7) - (7) 52 (59) Coke Batteries 9 - 9 9 - On Site Energy Projects 4 - 4 (5) 9 Merchant Generation (4) - (4) (11) 7 Other 8 - 8 13 (5) Coal Services 6 - 6 7 (1) Biomass Energy 45 (16) B 29 25 4 Energy Trading & CoEnergy Portfolio (16) - (16) (12) (4) Energy Resources Overheads 242 (16) 226 214 12 Total Energy Resources Non-Regulated 477 - 477 455 22 Total Energy Resources Energy Distribution 17 14 C 31 111 (80) Regulated - Power Distribution (15) - (15) (16) 1 Non Regulated (Energy Technologies) 2 14 16 95 (79) Total Energy Distribution Energy Gas 29 17 D 46 66 (20) Regulated 29 - 29 26 3 Non-Regulated 58 17 75 92 (17) Total Energy Gas Holding Company & Other (9) - (9) (10) 1 Energy Technology Investments (48) 10 E (38) (46) 8 Other (57) 10 (47) (56) 9 Total Holding Company & Other Discontinued Operations - ITC 5 (5) F - - - Income from Operations 63 (63) G - - - Gain on Sale Cumulative Effect of Accounting Changes (11) 11 - - - Asset Retirement Obligations (FAS 143) Energy Trading Activities (EITF 98-10 (16) 16 - - - implementation cumulative effect) Total Net Income $521 - $521 $586 ($65) Total EPS $3.09 - $3.09 $3.55 ($0.46) Diluted Shares Outstanding (millions) 168 168 165 * Includes Energy Technology Investments Key: A - Blackout Costs B - Adjustment for rescission of EITF 98-10 Accounting Change (flow back) C - Loss on sale of steam heating business D - Disallowance of gas costs E - Contribution to DTE Energy Foundation F - Adjustment for Discontinued Operations (ITC) G - Gain on Sale of ITC 2003 Net Income Summary p.2
  • 3. DTE ENERGY COMPANY AND SUBSIDIARY COMPANIES Earnings Variance Analysis (Preliminary/Unaudited) 2002 Reported Earnings per Share $3.83 Adjust for discontinued operations (ITC) (0.28) 2002 Operating Earnings per Share $3.55 Regulated Electric (0.45) Gross Margin (0.80) Weather impact (0.44) Incremental losses to Choice (0.27) Other (0.09) O&M Expense (0.21) Benefits Cost (0.32) Uncollectable Expense (0.07) Storm Cost (0.13) Cost reductions - generation & corp support costs, lower incentive costs 0.31 Depreciation, Interest, Taxes & Other 0.56 Regulatory Deferral - Choice 0.19 Regulatory Deferral - Clean Air 0.12 Interest - lower borrowing costs (excluding clean air related) 0.05 Other - lower property and single business taxes, other 0.20 Regulated Gas (0.13) Gross Margin 0.08 Weather impact 0.06 Other 0.02 O&M Expense (0.28) Benefits Cost (0.12) Uncollectable Expense (0.07) Other - injuries and damages, customer service initiatives (0.09) Non Regulated 0.05 Energy Resources - higher year-over-year synfuel earnings, power contract gains 0.04 Midstream Gas - gain on sale of Portland pipeline interest 0.01 Corporate and Other - primarily loss reserves in 2002 0.07 2003 Operating Earnings per Share $3.09 Net Adjustment Operating to Reported - 2003 Reported Earnings per Share $3.09 2003 Variance p.3
  • 4. Net Income Summary (Preliminary/Unaudited) (in millions, except per share amounts) Reported Operating Operating Adjustments Variance Q4 2003 Q4 2003 Q4 2002 Energy Resources $ 103 $ - $ 103 $ 71 $ 32 Regulated - Power Generation Non-Regulated Energy Services Coal Based Fuels 48 - 48 77 (29) Synfuels 2 - 2 2 - Coke Batteries 3 - 3 2 1 On Site Energy Projects (4) - (4) (3) (1) Merchant Generation - - - (4) 4 Other 1 - 1 6 (5) Coal Services 1 - 1 2 (1) Biomass Energy (7) - (7) 13 (20) Energy Trading & CoEnergy Portfolio (4) (4) - (4) Energy Resources Overheads $ 40 $ - $ 40 $ 95 $ (55) Total Energy Resources Non-Regulated $ 143 $ - $ 143 $ 166 $ (23) Total Energy Resources Energy Distribution $ 2 $ - $ 2 $ 14 $ (12) Regulated - Power Distribution (3) - (3) (5) 2 Non Regulated (Energy Technologies) $ (1) $ - $ (1) $ 9 $ (10) Total Energy Distribution Energy Gas $ 22 $ - $ 22 $ 36 $ (14) Regulated 4 - 4 5 (1) Non-Regulated $ 26 $ - $ 26 $ 41 $ (15) Total Energy Gas Holding Company & Other $ - $ - $ - $ (1) $ 1 Energy Technology Investments 61 (70) A (9) (16) 7 Other $ 61 $ (70) $ (9) $ (17) $ 8 Total Holding Company & Other Total Net Income $ 229 $ (70) $ 159 $ 199 $ (40) Total Diluted EPS $ 1.36 $ (0.42) $ 0.94 $ 1.19 $ (0.25) Average Diluted Shares Outstanding 169 169 168 Key: A - Quarterly Effective Tax Rate Adjustment Q4 Net Income Summary p.4
  • 5. DTE ENERGY COMPANY AND SUBSIDIARY COMPANIES Earnings Variance Analysis (Preliminary/Unaudited) Q4 2002 Reported Earnings per Share $1.21 0.03 Adjust for Q4 2002 Quarterly Effective Tax Rate Adjustment Adjust for discontinued operations (ITC) (0.05) Q4 2002 Operating Earnings per Share $1.19 Regulated Electric 0.12 Gross Margin (0.13) Weather impact (0.05) Incremental losses to Choice (0.11) Territory growth 0.03 O&M Expense 0.03 Benefits (0.09) Uncollectable Expense (0.03) Corporate Support Allocation Adj. (offset in Regulated Gas) 0.13 Other - lower outage costs 0.02 Depreciation and Amort 0.16 Regulatory Deferral - Choice 0.11 Other 0.05 Interest & Other - lower borrowing costs and taxes 0.06 Regulated Gas (0.09) Gross Margin (0.04) Weather impact (0.06) Territory growth 0.02 O&M Expense (0.12) Benefits (0.01) Uncollectable Expense (0.01) Corporate Support Allocation Adj. (offset in Regulated Electric) (0.13) Other 0.03 Taxes & Other 0.07 Non Regulated (0.32) Energy Services - Coke battery earnings in 2002, lower year-over-year synfuel prod. (0.15) Energy Trading - Large unrealized gains at Co-Energy in 2002 (0.12) Other Non Regulated (0.05) Corporate & Other - primarily loss reserves in Q4 2002 0.04 $0.94 Q4 2003 Operating Earnings per Share Quarterly effective tax rate adjustment 0.42 Q4 2003 Reported Earnings per Share $1.36 Q4 Variance p.5
  • 6. DTE ENERGY COMPANY CONSOLIDATED STATEMENT OF FINANCIAL POSITION (PRELIMINARY/UNAUDITED) (in Millions) Dec. 31 Dec. 31 Percent LIABILITIES AND Dec. 31 Dec. 31 Percent ASSETS 2003 2002 Change SHAREHOLDERS' EQUITY 2003 2002 Change Current Assets Current Liabilities Cash and cash equivalents $ 54 $ 133 -59% Accounts payable $ 625 $ 647 -3% Restricted cash 131 237 -45% Accrued interest 110 115 -4% Accounts receivable Dividends payable 87 90 -3% Customer (less allow. for doubtful accounts of $99 and $82) 877 902 -3% Accrued payroll 51 49 4% Accrued unbilled revenues 316 296 7% Income taxes 185 44 n/m Other 338 237 43% Short-term borrowings 370 414 -11% Inventories Current portion long-term debt, including Fuel and gas 467 413 13% capital leases 477 1,018 -53% Materials and supplies 162 163 -1% Liab. from risk mgmt. and trading activities 346 284 22% Assets from risk management and trading activities 186 224 -17% Other 648 552 17% Other 181 159 14% 2,899 3,213 -10% 2,712 2,764 -2% Other Liabilities Deferred income taxes 988 916 8% Investments Regulatory liabilities 162 179 -9% Nuclear decommissioning trust funds 518 417 24% Asset retirement obligations 866 - - Other 601 487 23% Unamortized investment tax credit 156 168 -7% 1,119 904 24% Liab. from risk mgmt. and trading activities 173 208 -17% 475 523 -9% Liab. from transportation and storage contracts Property Accrued pension liability 345 582 -41% Property, plant and equipment 17,679 17,862 -1% Deferred gains from asset sales 311 161 93% Less accumulated depreciation and depletion (8,010) (8,049) - Minority interest 156 128 22% 9,669 9,813 -1% Nuclear decommissioning 67 416 -84% Other 544 394 38% 4,243 3,675 15% Other Assets Long-Term Debt (net of current portion) Goodwill 2,068 2,114 -2% Mortgage bonds, notes and other 5,913 5,936 - Regulatory assets 2,063 1,197 72% Securitization bonds 1,496 1,585 -6% Securitized regulatory assets 1,527 1,613 -5% Equity-linked securities 185 191 -3% Notes receivable 469 336 40% Capital lease obligations 75 82 -9% Assets from risk management and trading activities 88 152 -42% 7,669 7,794 -2% Prepaid pension assets 181 172 5% Other 202 182 11% Commitments and Contingencies 6,598 5,766 14% Shareholders' Equity 3,109 3,052 2% Common stock Retained earnings 2,308 2,132 8% Accumulated other comprehensive loss (130) (619) 79% 5,287 4,565 16% Total Liabilities and Shareholders' Equity Total Assets $ 20,098 $ 19,247 4% $ 20,098 $ 19,247 4% The Consolidated Statement of Financial Position (Preliminary/Unaudited) should be read in conjunction with the Notes to Consolidated Financial Statements appearing in the Annual Report to Shareholders, Form 10K and 10Q. n/m - not meaningful DTE Balance Sheet p.6
  • 7. DTE ENERGY COMPANY CONSOLIDATED STATEMENT OF CASH FLOWS (PRELIMINARY/UNAUDITED) 12 Months - December 2002 2003 (in Millions) Operating Activities Net Income $ 521 $ 632 Adjustments to reconcile net income to net cash from operating activities: Depreciation, depletion, and amortization 691 759 Deferred income taxes (220) (208) Gain on sale of assets, net (129) - Partners' share of synfuel project losses (78) (40) Contributions from synfuel partners 65 22 Cumulative effect of accounting changes 27 - Changes in assets and liabilities, exclusive of changes shown separately 73 (169) Net cash from operating activities $ 950 $ 996 Investing Activities Plant and equipment expenditures - regulated (679) (794) Plant and equipment expenditures - non-regulated (72) (190) Proceeds from sale of interests in synfuel projects 89 32 Proceeds from sale of ITC and other assets 669 9 Restricted cash for debt redemptions 106 (79) Other investments (103) (93) Net cash from (used for ) investing activities $ 10 $ (1,115) Financing Activities Issuance of long-term debt 527 958 Redemption of long-term debt (1,208) (613) Issuance of preferred securities - 180 Redemption of preferred securities - (180) Short-term borrowings, net (44) (267) Capital lease obligations (9) (12) Issuance of common stock 44 265 Repurchase of common stock (3) (9) Dividends on common stock (346) (338) Net cash used for financing activities $ (1,039) $ (16) Net Decrease in Cash and Cash Equivalents (79) (135) Cash and Cash Equivalents at Beginning of the Period 133 268 Cash and Cash Equivalents at End of the Period $ 54 $ 133 DTE Cash Flow p.7
  • 8. The Detroit Edison Company Consolidated Statement of Operations (Preliminary/Unaudited) (in Millions) 3 Months - December 12 Months - December 2002 2002 2003 % Change 2003 % Change $ 871 $ 962 -9% $ 3,695 $ 4,054 -9% Operating Revenues Operating Expenses 177 233 -24% 939 1,074 -13% Fuel and purchased power 327 334 -2% 1,352 1,271 6% Operation and maintenance 87 128 -32% 473 577 -18% Depreciation and amortization 53 67 -21% 257 273 -6% Taxes other than income 644 762 -15% 3,021 3,195 -5% 227 200 14% 674 859 -22% Operating Income Other (Income) and Deductions 67 79 -15% 284 311 -9% Interest expense (7) - (7) (1) n/m Interest income - (31) (20) n/m (93) (36) n/m Other income 26 17 n/m 93 51 n/m Other expense 55 76 -28% 277 325 -15% 172 124 39% 397 534 -26% Income Before Income Taxes 67 40 68% 145 178 -19% Income Tax Provision 105 84 25% 252 356 -29% Income Before Accounting Change - - (6) - Cumulative Effect of Accounting Change - - Reported Earnings $ 105 $ 84 25% $ 246 $ 356 -31% Cumulative Effect of Accounting Changes - - - 6 - - Asset Retirement Obligations (FAS 143) Unusual Items - - - 16 - - August 2003 Blackout Costs - - - 14 - - Loss on Sale of Steam Heating Business - - - - (4) - Elimination of Intercompany Gain Operating Earnings $ 105 $ 84 25% $ 282 $ 352 -20% The Consolidated Statement of Operations (Preliminary/Unaudited) should be read in conjunction with the Notes to Consolidated Financial Statements appearing in the Annual Report to Shareholders, Form 10K and Form 10Q. n/m - not meaningful Deco Inc. Statement p.8
  • 9. Michigan Consolidated Gas Company Consolidated Statement of Operations (Preliminary/Unaudited) (in Millions) 3 Months - December 12 Months - December 2003 2002 % Change 2003 2002 % Change Operating Revenues $ 414 $ 370 12% $ 1,492 $ 1,312 14% Operating Expenses Cost of gas 251 223 13% 888 754 18% Operation and maintenance 98 64 53% 349 277 26% Depreciation, depletion and amortization 26 28 -7% 105 107 -2% Taxes other than income 10 13 -23% 52 51 2% Property write-down and contract losses - - - 5 48 n/m Loss on sale of assets 3 - - 3 - - 385 328 17% 1,402 1,237 13% Operating Income 29 42 -31% 90 75 20% Other (Income) and Deductions Interest expense 15 15 - 57 59 -3% Interest income (2) (2) - (10) (10) - Gain on sale of joint venture (6) - - (6) - - Other (1) (2) n/m (5) (6) 17% 6 11 -45% 36 43 -16% Income Before Income Taxes 23 31 -26% 54 32 69% Income Tax Provision 2 12 -83% 9 12 -25% 21 19 45 20 Reported Earnings 11% 125% Purchase Accounting and Other Adjustments - 17 - - 46 - Operating Earnings (A) $ 21 $ 36 -42% $ 45 $ 66 -32% The Consolidated Statement of Operations (Preliminary/Unaudited) should be read in conjunction with the Notes to Consolidated Financial Statements appearing in the Annual Report to Shareholders, Form 10K and Form 10Q. (A) Represents MichCon's results included in the DTE Energy Consolidated Statement of Operations. n/m - not meaningful MichCon Inc Statement p.9
  • 10. Sales Analysis Electric Sales - Detroit Edison Service Area (000's of GWh) Electric Revenue - Detroit Edison Service Area ($000s) Q4 2003 Q4 2002 % Change Q4 2003 Q4 2002 % Change Residential 3,519 3,580 -1.7% Residential 314,120 318,996 -1.5% Commercial 3,690 4,260 -13.4% Commercial 307,033 349,664 -12.2% Industrial 2,990 3,245 -7.9% Industrial 149,906 168,957 -11.3% Other 666 686 -2.9% Other 27,947 28,369 -1.5% TOTAL SYSTEM 10,865 11,771 -7.7% TOTAL SYSTEM 799,006 865,986 -7.7% Choice Sales* 2,047 1,377 48.7% Choice Sales* 10,439 6,722 55.3% TOTAL SALES 12,912 13,148 -1.8% TOTAL SALES 809,445 872,708 -7.2% * Includes Dearborn Industrial Group sales * Includes Dearborn Industrial Group sales Electric Sales - Detroit Edison Service Area (000's of GWh) Electric Revenue - Detroit Edison Service Area ($000s) 2003 2002 % Change 2003 2002 % Change Residential 15,075 15,959 -5.5% Residential 1,350,882 1,433,123 -5.7% Commercial 15,940 18,393 -13.3% Commercial 1,309,563 1,500,143 -12.7% Industrial 12,254 13,588 -9.8% Industrial 632,489 699,712 -9.6% Other 2,621 2,653 -1.2% Other 115,975 114,437 1.3% TOTAL SYSTEM 45,890 50,593 -9.3% TOTAL SYSTEM 3,408,909 3,747,415 -9.0% Choice Sales* 35,443 19,339 Choice Sales * 7,237 3,954 83.0% 83.3% TOTAL SALES 53,127 # 54,547 -2.6% TOTAL SALES 3,444,352 3,766,754 -8.6% * Includes Dearborn Industrial Group sales * Includes Dearborn Industrial Group sales Gas Sales and End User Transportation- MichCon Service Area (Mcf) Gas - MichCon Service 2003 2002 % Change Q4 2003 Q4 2002 % Change Residential 129,551,203 129,740,574 -0.1% Residential 40,307,846 41,713,952 -3.4% Commercial 41,135,858 38,916,292 5.7% Commercial 12,102,969 11,328,746 6.8% Industrial 1,526,112 1,570,220 -2.8% Industrial 466,728 331,964 40.6% 172,213,173 170,227,086 1.2% 52,877,543 53,374,662 -0.9% End Use Transportation (includes choice customers) End User Transportation* 151,089,646 169,524,109 -10.9% 38,042,355 47,787,008 -20.4% TOTAL SALES -4.8% 323,302,819 339,751,195 TOTAL SALES 90,919,898 101,161,670 -10.1% * includes choice customers * includes choice customers Sales p.10
  • 11. DTE Energy Debt/Equity Calculation As of December 31, 2003 ($ millions) Short-term borrowings $370 Current portion LTD + cap leases 477 Mortgage bonds, notes, and other long-term debt 5,913 Securitization bonds 1,496 Capital leases 75 Less QUIDS 385 Less Trust Preferreds 280 Less MichCon short-term debt 238 Less securitization debt 1,585 Total debt $5,843 Trust preferred $280 QUIDS 385 Mandatory convertible 185 Total preferred/ other $850 Equity $5,287 Total cap $11,980 Debt 48.8% Preferred stock/ other 7.1% Common shareholders' equity 44.1% Total 100.0% Leverage Calc p.11