SlideShare uma empresa Scribd logo
1 de 32
Baixar para ler offline
2001 marks Southwest Airlines’ 30th Anniversary. For 30 years now, we have had one mission: low fares. In that
respect, this year was no different. But as we all know, 2001 was a year like no other, in both our Company’s and our
country’s history. In first quarter, we unveiled our new look for the new millennium — beautiful Canyon Blue jets with
all-leather interiors. In second quarter, our Chairman, Herb Kelleher, announced that he would be sharing his
responsibilities with our new Vice Chairman and CEO, Jim Parker, and our new President and COO, Colleen Barrett.
The National Tragedy struck our collective hearts, minds, and lives in third quarter. In fourth quarter, our nation
and our Company began the difficult process of healing together. Nothing will keep us from moving ahead.
Freedom, and the Freedom to Fly, will most certainly endure.


                                                                                                                                                19.9% *
                                                                                                                                19.7%
                                                                                       $0.79 *                                                                   20%
                                     11.1% *                                                            $0.80
                                                      12%
                     10.4%                                                                                                              18.1%
                             10.0%
                                                                                                                                                                 18%
                                                                                                                        17.4%
                                                                                                 $0.63 $0.70
                                               9.2% 10%
              8.3%                                                             $0.59
                                                                       $0.55                            $0.60                                                    16%
                                                      8%
                                                                                                                                                          13.7% 14%
                                                                                                        $0.50
                                                               $0.41
                                                      6%
                                                                                                        $0.40                                                    12%
                                                      4%
                                                                                                        $0.30                                                    10%
                                                      2%
                                                                                                        $0.20                                                    8%
                                                               1997    1998    1999 2000         2001                    1997   1998    1999 2000         2001
              1997    1998   1999 2000         2001


                                                                                                                     Return On Stockholders’ Equity
                          Net Margin                          Net Income Per Share, Diluted


           CONSOLIDATED HIGHLIGHTS                                                       2001                        2000                         CHANGE
           (DOLLARS IN THOUSANDS, EXCEPT PER SHARE AMOUNTS)


            Operating revenues                                                     $5,555, 1 74                 $5,649,560                           (1.7)%

            Operating expenses                                                         $4,924,052               $4,628,4 1 5                         6.4%

                                                                                                                                                  (38.2)%
            Operating income                                                            $ 6 3 1 ,1 2 2          $ 1,021,1 4 5
                                                                                                                                                    (6.7)pts.
            Operating margin                                                                       1 1 .4%                  18.1%

            Net income                                                                                             $625,224 *
                                                                                        $51 1 ,1 47                                                (18.2)%

                                                                                                                                                     (1.9)pts.
                                                                                                                            1 1 .1 %*
                                                                                                    9.2%
            Net margin

            Net income per share – basic                                                                                $0.84 *
                                                                                                 $0.67                                            (20.2)%

                                                                                                                         $0.79 *
            Net income per share – diluted                                                       $0.63                                            (20.3)%

            Stockholders’ equity                                                       $4,014,053               $3,451,320                          16.3%

            Return on average stockholders’ equity                                                                                                  (6.2)pts.
                                                                                                                            19.9% *
                                                                                                  1 3 .7 %

            Stockholders’ equity per common share outstanding                                    $5.24                   $4.53                      15.7%

            Revenue passengers carried                                             64,446,773                   6 3, 678 , 261                        1.2%

            Revenue passenger miles {RPMs} (000s)                                  4 4 , 493,9 1 6              4 2 , 2 1 5 ,1 6 2                   5.4%

            Available seat miles {ASMs} (000s)                                     65,295,290                   59,909,965                           9.0%

            Passenger load factor                                                                 68.1%                    70.5%                    (2.4)pts.

            Passenger revenue yield per RPM                                                      12.09¢                   12.95¢                    (6.6)%

            Operating revenue yield per ASM                                                       8.5 1 ¢                  9.43¢                    (9.8)%

            Operating expenses per ASM                                                            7.54¢                     7.73¢                   (2.5)%

                                                                                            31,580                     29,274
            Employees at yearend                                                                                                                      7.9%

            *Excludes cumulative effect of change in accounting principle of $22.1 million ($.03 per share)


Southwest Airlines Co. is the nation’s low-fare, high Customer Satisfaction airline. We primarily serve shorthaul city
pairs, providing single-class air transportation which targets the business commuter as well as leisure travelers.
The Company, incorporated in Texas, commenced Customer Service on June 18, 1971, with three Boeing 737 aircraft
serving three Texas cities — Dallas, Houston, and San Antonio. At yearend 2001, Southwest operated 355 Boeing 737
aircraft and provided service to 59 airports in 30 states throughout the United States. Southwest has one of the
lowest operating cost structures in the domestic airline industry and consistently offers the lowest and simplest fares.
Southwest also has one of the best overall Customer Service records. LUV is our stock exchange symbol, selected to
represent our home at Dallas Love Field, as well as the theme of our Employee and Customer relationships.
2   S O U T H W E S T A I R L I N E S C O. 2 0 0 1 A N N UA L R E P O RT


            TO OUR SHAREHOLDERS:
                                                                                                                                February 1, 2002
           “Are you guys ready? Okay. Let’s roll.” – Todd Beamer
              These heroic words, flung into the macabre face of impending tragedy, were a luminous reflection of the iron character,
           unquenchable spirit, and inspiring altruism of a noble team leader and player. Todd Beamer’s words and actions, in the scarifying
           context of the horrific events of September 11, helped to galvanize America into a state of “terrible, swift resolve.”
              The airline industry was shut down on September 11 — and many of our planes, crews, and Customers were required to land, and
           thereafter stay, in unintended places. Communicating with, and taking care of, those Customers, crews, and aircraft, as well as
           passengers reserved on flights cancelled, was a herculean task. As the passenger carriers resumed service, reuniting planes and
           crews “legal to fly” into a coherent passenger schedule was another hugely complex and enormously difficult undertaking. And
           the FAA and the DOT, reacting swiftly and well to the crisis, were engaged in the process of issuing a veritable cascade of new
           Security Directives profoundly changing the manner in which Customers, luggage, and airplanes were protected and cleared for
           flight, thus compelling probably 1,000,000 airline employees to learn, and apply, new security procedures on a daily and,
           sometimes, hourly basis. Meanwhile, much of our industry was simultaneously and furiously absorbed in: (i) borrowing as much
           cash as quickly as it could; (ii) deferring or canceling scheduled new aircraft deliveries; (iii) determining how many flights it should
           cut and how many employees it should lay off, furlough, or put on unpaid leave; (iv) speculating how low its fares might have to
           be in order to induce passengers to fly, in the aftermath of a devastating terrorist attack occurring in the midst of a recession;
           and (v) pondering the imponderables of: (a) what new business models it might adopt in radically changed circumstances;
           (b) the vagaries of Chapter 11 proceedings; and (c) how long its tenuous future might be. For the airline industry, this was not
           merely Dante’s purgatory. It was, indeed, Dante’s pure “hell,” created in one amazing and tragic day.
              Southwest was well poised, financially, to withstand the potentially devastating hammer blow of September 11. Why? Because
           for several decades our leadership philosophy has been: we manage in good times so that our Company, and our People, can be
           job secure and prosper through bad times. This philosophy served our People and our Company well during the holocaustic economic
           catastrophe that afflicted the airline industry from 1990 – 94, when the industry, as a totality, lost a cumulative $13 billion and
           furloughed approximately 120,000 of its employees, while, during that same 1990 – 94 period, Southwest remained 100 percent
           job secure and produced profits and Profitsharing for our Employees and Shareholders. Once again, after September 11,
           our philosophy of managing in good times so as to do well in bad times proved a marvelous prophylactic for our Employees
           and our Shareholders:
           1. On September 11, Southwest had $1.0 billion in cash and cash equivalents on hand, enabling us to withstand the severe cash flow
           drain suffered by all passenger airlines upon recommencement of air service post September 11. Liquidity is good, not bad!
           2. On September 11, Southwest had the strongest balance sheet and the highest credit ratings in the American airline industry.
           As a consequence, we were able to quickly borrow, at reasonable rates, $1.1 billion in order to ensure that we had enough cash on
           hand to pay our bills; pay our Employees; fund our Employee Profitsharing commitments; make contractually obligated capital
           expenditures; and guarantee the longevity of our Company and, thus, of our People’s livelihoods. A conservative balance sheet
           and high credit ratings are good, not bad!
           3. On September 11, Southwest had the lowest cost per Available Seat Mile (ASM) flown of any major passenger air carrier. In the
           sparse ridership, very low-fare airline industry environment subsequent to September 11, our low costs enabled us to compete
           effectively by offering extremely low fares, while simultaneously reestablishing a positive cash flow (more cash coming in than
           going out) and, ultimately, even fourth quarter 2001 profitability. Low costs for producing an ASM are good, not bad!
              On September 11, our Company had the financial wherewithal to withstand and overcome the dire economic emergency with
           which it, and our nation, were threatened. But what about our Southwest People, as a whole? How would they respond in an
           atmosphere of incredulity, fear, sadness, uncertainty, and grave economic jeopardy for themselves and their Company?
           Here is how they responded:
              “Are you guys ready? Okay. LET’S ROLL.”
              While still grieving over the events and losses of September 11, our People returned to work with tears in their eyes but resolve
           in their hearts. They speedily reassembled our airline, after it had been shut down, and got it flowing smoothly again. In a
           national and Company emergency, they put aside petty complaints and miniscule concerns and both learned, and endured, the
           multitude of complicated new security measures and procedures mandated by our federal government. And despite the stress
           and strain of the post September 11 airline industry environment, they smiled, and cared, for their internal and external Customers,
           while providing superb Customer Service in their usual spirited, joyful, open, warm-hearted, and humanitarian way.
3
                                                                                              S O U T H W E S T A I R L I N E S C O. 2 0 0 1 A N N UA L R E P O RT


   The combination of farsighted, rather than nearsighted, Company philosophies and policies and of the Southwest People, who
are strong, resolved, dedicated, empathetic, resilient, and also farsighted, rather than nearsighted, in their thoughts and actions,
brought about the following proud results for Southwest in the post September 11 period:
1. Southwest operated 100 percent of its aircraft capacity and provided 100 percent job security, with no loss of pay for its People
from layoffs, furloughs, or unpaid leaves and with no fear by its People of having to reduce their pay or benefits;
2. Southwest was able to fund its year 2000 Employee Profitsharing and fourth quarter 2001 Employee savings plan obligations
in the amount of $197.5 million;
3. Southwest inaugurated service to Southern Virginia through Norfolk;
4. Southwest announced additional nonstop service between the following cities, utilizing two previously deferred new aircraft
deliveries: Baltimore/Washington to Manchester, Orlando, and Ft. Lauderdale; and Long Island/Islip to Orlando and Ft. Lauderdale;
5. Southwest prepared to implement its first nonstop flights between Chicago’s Midway Airport and both Seattle and Oakland,
utilizing four previously deferred new aircraft deliveries;
6. Year over year, Southwest’s fourth quarter 2001 ASM capacity increased by 6.4 percent;
7. Southwest’s Revenue Passenger Mile (RPM) share of the U.S. domestic air passenger market increased by about 2.0 percent
in fourth quarter 2001;
8. Excluding fuel costs (which dropped) and despite greatly increased expenses for added security measures and insurance
coverage, Southwest reduced its fourth quarter operating expenses per ASM by 2.5 percent;
9. Southwest reported a profit of $511.1 million for the year 2001 (including federal grants and special charges) or $412.9 million
(excluding federal grants, special charges, and their related effects), and amended its Profitsharing Plan in order to pay all of its
qualified Employees Profitsharing calculated on the higher ($511.1 million), rather than the lower ($412.9 million), profit figure;
10. Southwest actually reported a profit of $63.5 million for fourth quarter 2001 (including federal grants and special charges)
or $32.4 million (excluding federal grants, special charges, and their related effects); and
11. Based upon all of the above occurrences and the market’s concomitant faith in a prosperous future for Southwest Airlines,
the price of our stock rose, rather than fell, subsequent to September 11.
   Including federal grants and special charges, our annual net income declined 18.2 percent to $511.1 million in 2001 (before the
cumulative effect of a change in accounting principle in 2000), and excluding such grants, charges, and their related effects,
our net income declined 34.0 percent to $412.9 million. Seldom does such a significant decline in earnings provide cause for
rejoicing on the part of Employees and Shareholders, but, in the case of 2001, it both does and should. Including federal grants
and special charges, the other major carriers lost a cumulative total of $7.8 billion in all of 2001 and a cumulative total of
$3.3 billion in fourth quarter 2001 alone, reputedly also “furloughing” up to 100,000 employees without pay.
   The year 2002 will, in the words of Winston Churchill, demand the expenditure of “blood, toil, tears, and sweat” as our airline
and our nation endeavor to recover from the heartrending catastrophe of September 11, which also deepened an already existing
domestic economic recession and resulted in the imposition of additional security costs upon our industry as well as enhanced
airport processing time upon our industry’s Customers.
   We are prepared, and our valorous, good-hearted, and united People are determined that, together, as one, we shall overcome
any obstacle and conquer every adversity, and that our magnificent Canyon Blue Boeings will fly at the forefront of our industry
as it recovers from the ravages of 2001.
    For 2002, our wonderful People’s brave hearts will be both informed and inspired by Todd Beamer’s brave words — and his
devotion to the concept of duty with honor:
“LET’S ROLL.”
Most sincerely,


Herbert D. Kelleher                                                                                       Colleen C. Barrett
                                                   James F. Parker
Chairman of the Board                                                                                     President and
                                                   Vice Chairman of the Board
                                                                                                          Chief Operating Officer
                                                   and Chief Executive Officer
4   S O U T H W E S T A I R L I N E S C O. 2 0 0 1 A N N UA L R E P O RT


           BE PREPARED!
           This motto is a governing principle of Southwest Airlines.
               The way we put it is this: We manage in good times so that our Employees (many of whom are our Shareholders) and our
           Shareholders (many of whom are our Employees) will do well in bad times.
              Throughout the Arab oil embargo of 1973 and its aftereffects, the sharp spike in jet fuel prices in 1979 – 1980, the recession of
           the early 1980s, the airline industry “depression” of 1990 – 1994, and the recession and terrorist-plagued year of 2001:
           1. Southwest has provided total job security, with no unpaid furloughs or reductions in pay and benefits, for its Employees;
           2. Southwest has expanded its fleet and the amount of service it provides, furnishing new jobs for new hires and enhanced
           seniority and the opportunity to move both around and up to its existing Employees;
           3. Southwest has provided Profitsharing and funded 401(k) plans for its Employees; and
           4. Southwest’s earnings have consistently followed a rising trend, propelling our stock price and total market value upward for
           the benefit of our Shareholders (many of whom are our Employees).
              The airline business is capital intensive (e.g., year 2001 Southwest expenditures for equipment and property — $1.0 billion);
           fuel intensive (e.g., year 2001 Southwest expenses for fuel and oil — $770 million); People intensive (e.g., year 2001 Southwest
           expenses for salaries, wages, and benefits — $1.9 billion); and intensely cyclical (e.g., airline industry losses 1990 – 1994 —
           $13.0 billion; airline industry loss 2001 — $7.3 billion, after receipt of government grants). It is widely stated that in the 98 years
           since the Wright brothers flew their first flight, the commercial passenger airline industry has, in the aggregate, produced a net
           loss, rather than a net profit. During that same 98-year period, innumerable airlines have ceased operations and perished,
           causing millions of people to lose their jobs.
              In a business long noted among analysts and economists for its financial misfortunes and frequent vicissitudes, Southwest,
           which flew its first full year in 1972, has achieved:
           1. Twenty-nine consecutive years of profitability and Profitsharing, while expanding our ASMs flown by 24,651 percent (a record
           unmatched in the history of the airline industry);
           2. Thirty consecutive years of 100 percent job security while the number of our Employees has grown from 183 to 31,580 (a record
           unmatched in the history of the airline industry);
           3. An increase in the market value of our stock (of which our Employees, as a group, are the largest owners) of 138,656 percent
           (a record unmatched in the history of the airline industry); and
           4. Year in and year out, the best Customer Satisfaction statistics (a record unmatched in the history of the airline industry).
               How was Southwest able to achieve these admirable and unprecedented airline industry records for the benefit of our People
           (many of whom are our Shareholders), our Shareholders (many of whom are our People), and the American public? By adhering
           to the motto:

           BE PREPARED!
              On September 11, Southwest had the lowest cost per available seat mile of any of the major air carriers; the strongest balance
           sheet in the American airline industry; plenty of cash on hand; ample credit available; and the strongest, most resilient,
           adaptable, united, Customer-focused, and willing Employees in the airline industry.
                Southwest was prepared and, once again, that preparedness protected our Employees’ jobs, livelihoods, benefits, and
           Profitsharing; that preparedness protected the investments of our Shareholders (including Employee Shareholders) in
           Southwest’s stock; and that preparedness protected the American traveler as Southwest continued to operate 100 percent of its
           flights post September 11.
               Economic crises in the American airline industry occur at least once per decade. They always have and they always will.
           The analysts and the economists are correct — the airline business, as a whole, is fraught with economic peril. It always has been,
           and it always will be.
              Southwest has surmounted each such crisis during the past 30 years by being prepared for it. We pledge to our Employees and
           to our Shareholders that, for their benefit, their continued wellbeing, and their secure, prosperous futures, we will always:

           BE PREPARED!
5
                                                                                                                                                          S O U T H W E S T A I R L I N E S C O. 2 0 0 1 A N N UA L R E P O RT


LOW-FARE COMMITMENT.
   America’s freedom was threatened on September 11, 2001. However, Southwest’s resolve to Keep America Flying has not
changed. We have been successful over the past 30 years because we have not strayed from our commitment to offer affordable
fares and high-quality Customer Service. Southwest provides 90 percent of the low-fare competition in the U.S. and our fares are
consistently the lowest and simplest in the domestic airline industry. We keep our fares low which, in turn, gives our Customers
the Freedom to Fly.
   We have been profitable for 29 consecutive years and were the only U.S. major carrier to post a profit, with or without the
federal grant, during the fourth quarter 2001 and for the full year 2001. We have a proven and flexible business model, which
allows us to generate ample profits even though we offer low fares. Of course, the secret is low costs, and the key ingredients to
our low-cost formula are our unique operating strategy and our amazing Culture.
   Southwest has been able to continually achieve the highest productivity of any major U.S. airline, and, therefore, the lowest cost
of any major U.S. airline. One of the primary reasons for our productivity advantage is our dedication to the low-fare, point-to-
point market niche. This market focus allows us to operate a single aircraft type, the Boeing 737, which significantly simplifies
scheduling, operations, and maintenance and, thus, minimizes costs. Southwest also has a very effective and efficient distribution
system with over 45 percent of our revenue currently being generated through our award-winning web site at southwest.com.
Our web site is easy to use and provides one-stop travel convenience for our Customers. Over 85 percent of our seats sold in
2001 were Ticketless, which eliminates significant processing costs. We offer the most generous frequent flyer program, which
was designed to reward our Customers based on trips rather than miles. After purchasing and flying only eight roundtrips on
Southwest, Customers receive a roundtrip ticket, good for travel anywhere on our system for up to a year.
   We schedule our aircraft on a point-to-point, not hub-and spoke, basis and focus on local, not through or connecting, traffic.
As a result, over 70 percent of our Customers fly nonstop. Our point-to-point route system, as compared to hub-and-spoke,
provides for more direct nonstop routings for our Customers and, therefore, minimizes stops, connections, delays and total
trip time. We serve many conveniently located satellite or downtown airports such as Baltimore/Washington, Chicago Midway,
Dallas Love Field, Houston Hobby, Long Island/Islip, Oakland, and Providence. Although we have successful operations at major
hub airports such as Los Angeles (LAX), we prefer, if possible, to avoid congested hub airports, which enhances our ability to
sustain high productivity and reliable ontime performance.
  We schedule our aircraft to minimize the amount of time at the gate, which is why we continually achieve the highest aircraft
utilization and Employee productivity of any major U.S. airline. Because our aircraft are generally at the gate less than
25 minutes, we require fewer aircraft and gate facilities than otherwise would be needed.
   Although we have experienced higher costs in certain areas due to the events of September 11, we managed to achieve our
low-cost objective in fourth quarter 2001 through lower fuel costs and our companywide cost reduction efforts. Among other
things, Southwest recently changed its travel agency policy to pay commissions of five percent (with no cap). Although lower fuel
costs contributed to our decline in unit costs for both fourth quarter and full year 2001, our Employees also reduced our
unit costs, excluding fuel, by 2.5 percent in fourth quarter 2001, despite significant increases in security and insurance costs.
This is a remarkable feat for our Employees and a testament to our desire to keep fares low and America Flying.


                            $625*
                                                                                                                                                                                                             75%
                                           $600                                          70                                              44,494 50,000                                        70.5%
                                                                                  64.4
                                    $511                                   63.7                                                 42,215                                                69.0%
                     $474                                                                                                                                                                             68.1% 70%
                                           $500
                                                                                         60
              $433                                                  57.5                                                                         40,000
                                                                                                                       36,479                                                 66.1%
                                                             52.6                                             31,419                                                  63.7%                                  65%
                                           $400       50.4
       $318                                                                                          28,355
                                                                                         50                                                      30,000
                                                                                                                                                                                                             60%
                                           $300
                                                                                         40                                                      20,000                                                      55%
                                           $200
                                                                                         30                                                                                                                  50%
                                                                                                                                                 10,000
                                           $100
                                                                                                                                                                                                             45%
                                                                                         20
                                                      1997   1998   1999 2000     2001                                                                                 1997   1998    1999 2000       2001
       1997   1998   1999 2000      2001                                                              1997    1998     1999 2000          2001


                                                      Revenue Passengers Carried                                                                                          Passenger Load Factor
                 Net Income                                                                             Revenue Passenger Miles
                                                             ( in millions)
                 ( in millions)                                                                              ( in millions)


   *Excludes cumulative effect of change in accounting principle of $22.1 million ($.03 per share)
6   S O U T H W E S T A I R L I N E S C O. 2 0 0 1 A N N UA L R E P O RT


             Although enhanced security measures have not diminished our aircraft productivity or ontime performance, they have
           resulted in longer checkin lines, at times, for our Customers. We understand how important convenience is to all of our Customers
           and we have been working tirelessly to reduce wait times. We have made significant facility changes (where possible); have added
           new screening devices; and are hiring Employees to help our Customers with the new security procedures. As a result, we have
           been able to streamline Customer processing and have already seen a reduction in Customer lines. Although this remains a
           challenge, we are committed to meeting the challenge as we continue to explore new methods and technology that will,
           hopefully, continue this positive trend. We will also work diligently with the federal government as it begins assuming
           responsibility for airport security on February 17, 2002.
             Although this change will undoubtedly present new challenges, Southwest has demonstrated that our Employees are adaptable
           to change and our business strategy is flexible under difficult operating conditions. Following September 11, our Employees
           quickly restored operations, operating our normal full schedule of approximately 2,800 daily flights with exceptional ontime
           performance and reliability. For the year 2001, Southwest had the best Ontime Performance and Highest Customer Satisfaction
           record of all major airlines, based on statistics published in Department of Transportation consumer reports.
             Our business strategy has served us well during what has been the most difficult period in airline history. And while we are
           proud of our progress since September 11, we will continue to work hard to improve Customer convenience and maintain our low
           costs so that we can continue to bring the Freedom to Fly to America for many generations to come.


           MOVING AHEAD.
              As we, along with our nation, continue to recover from September 11, we are prepared to move ahead. We took a number of
           significant steps immediately following the terrorist attacks to stabilize cash and protect our strong financial position. As a result
           of the extraordinary efforts of our Employees, we quickly restored operations with exceptional ontime performance and
           reliability. Although demand for air travel dramatically declined following the terrorist attacks, we chose not to reduce our total
           flights or postpone our new Norfolk, Virginia, service. This decision protected our 30-year history of complete job security for our
           Employees and now places Southwest in a competitively strong position as we move ahead. To preserve cash following the
           terrorist attacks, we temporarily deferred placing new aircraft deliveries into service, and with The Boeing Company’s greatly
           appreciated cooperation, we arranged for a preferred new aircraft delivery schedule (as set forth in the accompanying table).
               Although we are still in a recovery mode, we believe our overall performance has been strong enough to begin cautiously
           resuming our growth plans. In February, we will add flights between the following cities, utilizing two previously deferred aircraft
           deliveries: Baltimore/Washington to Manchester, Orlando, and Ft. Lauderdale; and Long Island/Islip to Orlando and Ft. Lauderdale.
           In addition, we accelerated delivery of four more previously deferred aircraft into March and April to initiate our first nonstop
           flights between Chicago’s Midway Airport and both Seattle and Oakland. We will also add an additional flight between Chicago
           Midway and Phoenix in March.


                                             11:18                                                          400
                                                             11:20
                                                                                                     355            Type            2002   2003   2004   2005   2006   2007   2008 2009-2012   Total
                                                                                               344
                                                                                         312
                                                                                  280
                                                             11:15                                          300                            21     23     24     22     25      6       –
                                                                                                                  Firm Orders       11                                                          132
                                                                           261
                     11:12
                                                     11:10
                                     11:10
                                                             11:10
                             11:09                                                                                                  –       –     13     20     20      9      25      –
                                                                                                                  Options                                                                       87
                                                                                                            200

                                                             11:05                                                Purchase Rights                                      20      20     177       217
                                                                                                                                    –       –      –      –      –
                                                                                                            100

                                                                                                                                           21     36     44     42     54      51     177      436
                                                                                                                    Total           11
                                                             11:00
                     1997    1998    1999 2000       2001                  1997   1998   1999 2000   2001


                                                                                                                                     Boeing 737-700 Firm Orders and Options
                         Aircraft Utilization                                         Fleet Size
                    ( hours and minutes per day)                                     (at yearend )
7
                                                                                                                                                         S O U T H W E S T A I R L I N E S C O. 2 0 0 1 A N N UA L R E P O RT


   Including these six aircraft, we will have accepted delivery of nine of the 11 737-700 aircraft scheduled for delivery in 2002.
We will retire three older 737-200s in 2002, which results in a minimum capacity increase of 3.5 percent for the year. In total,
the number of firm orders, purchase rights, and options, through 2012, of 436 (including 2002) remains unchanged from
pre-September 11. Also we have the flexibility to accelerate delivery of up to eight of the 2003 deliveries into 2002. As we phase
out our older 737-200 aircraft from our all-Boeing 737 fleet, we plan to retire the remaining 27 -200s by the end of 2005. All of
our new Boeing 737s will be delivered in our new “Canyon Blue” exterior color scheme and “Saddle Tan” all-leather seating
configuration to symbolize our renewed 30-year commitment to provide the Freedom to Fly to America.
    As the economy recovers and America continues to return to the skies, we are well-positioned both competitively and
financially to take advantage of growth opportunities as they arise. At yearend, we served 58 cities (59 airports) in 30 states and
provided less than ten percent of total domestic capacity. Due to the devastating events of September 11, we do not currently plan
to add any new cities to our route system for 2002. However, as the economy recovers and overall air travel demand returns,
we believe there will be ample opportunities to add new markets over the longer term. In addition, we continue to have
numerous expansion opportunities within our current route system, which now spans from coast to coast. In fact, for the past
several years, roughly 75 percent of our aircraft additions were deployed in our existing system by adding frequencies between
markets already served and by providing new nonstop service in existing markets.
   Our capacity is spread throughout the U.S., with 45 percent in the West; 27 percent in the East; 15 percent in the Midwest;
and 13 percent in the Heartland region (Texas and surrounding states). As a result, we have a diverse revenue base, with an
average of 47 departures per airport. Our low fares generate substantial demand, which allows us to offer lots of convenient
flights. For example, our top ten cities’ daily departures are currently Phoenix, 183; Las Vegas, 170; Houston Hobby, 143;
Baltimore/Washington, 134; Dallas Love Field, 131; Oakland, 120; Chicago Midway, 119; Los Angeles (LAX), 114; Nashville, 87;
and San Diego, 77.
   While our new city focus over the past few years has been in the eastern region of the U.S., we have numerous expansion
opportunities in our more mature regions, as evidenced by our upcoming additions from Chicago’s Midway Airport. As a result of
the combination of our low fares, high frequencies, convenience, and high-quality Customer Service, Southwest tends to
dominate the majority of the markets it serves. Southwest consistently ranks first in market share in approximately 80 to
90 percent of our top 100 city pairs and, in the aggregate, holds 60 to 65 percent of total market share in those markets. Based
on the most recent second quarter 2001 Department of Transportation data available, Southwest held 73 percent of the total
intra-Texas market; intra-California, 59 percent; intra-Florida, 52 percent; Baltimore, 36 percent; Las Vegas, 34 percent; and
Phoenix, 33 percent. Southwest also carries the most passengers in the top 100 U.S. markets despite serving only 42 of them.
   While the economic impact of September 11 was devastating for the airline industry as a whole, Southwest was financially well-
prepared and is able to move ahead from a relative position of strength. Our commitment to bring low fares to people across
America is stronger than ever and numerous opportunities to accelerate our growth currently exist. We will add incremental aircraft
capacity in a manner that does not jeopardize our financial stability and safety, nor impair our excellent Customer Service record.


                                                                                                                                                                                                       2,800
                                                                                   9.43¢                                                                                                                       2,800
                                $5,650            $6,000                                           9.5¢                                           7.9¢
                                         $5,555                                                                                                                                                2,700
                                                                                                                                  7.73¢
                       $4,736                                              8.96¢
                                                  $5,000                                           9.0¢                                           7.7¢                                 2,550                   2,600
              $4,164                                               8.76¢                                                                  7.54¢
                                                                                           8.51¢
                                                           8.58¢
     $3,817                                       $4,000                                                                  7.48¢
                                                                                                   8.5¢                                           7.5¢
                                                                                                          7.40¢
                                                                                                                  7.32¢                                                        2,334                           2,400
                                                  $3,000
                                                                                                   8.0¢                                           7.3¢                 2,268
                                                  $2,000
                                                                                                                                                                                                               2,200
                                                                                                   7.5¢                                           7.1¢
                                                  $1,000
                                                                                                                                                                                                               2,000
                                                                                                   7.0¢                                           7.0¢
                                                           1997    1998    1999 2000       2001           1997    1998    1999 2000       2001
      1997     1998     1999 2000         2001                                                                                                                         1997    1998    1999 2000       2001


                                                               Operating Revenues                             Operating Expenses
              Operating Revenue                                                                                                                                          Average Daily Departures
                                                              Per Available Seat Mile                        Per Available Seat Mile
                 ( in millions)
Seattle/Tacoma

                                                         Spokane

                             Portland


                                                                                                                                                                                                                                                                                                               Manchester
                                                                                                                                                                                                                                                                                                                (Boston Area)
                                                                                                                                                                                                                                                                 Buffalo/
                                                                     Boise                                                                                                                                                                                    Niagara Falls                                           Providence
                                                                                                                                                                                                                                                                                    Albany                            (Boston Area)
                                                                                                                                                                                                                                                                                                              Hartford/Springfield
                                                                                                                                                                                                                                          Detroit
                                                                                                                                                                                                                                                                                                       Long Island/Islip
                                                                                                                                                                                                                   Chicago
                                     Reno/Tahoe                                                                                                                                                                                                    Cleveland
                                                                                                                                                                                                                   (Midway)
             Sacramento                                                                                                                                 Omaha
                                                                              Salt Lake City
                                                                                                                                                                                                                                                                              Baltimore/ Washington (BWI)
         Oakland                                                                                                                                                                                                                                  Columbus
(San Francisco Area)                                                                                                                                                                                                                                                                                 (D.C. Area)
                                                                                                                                                                                     Kansas City                         Indianapolis
                       San Jose
                       (San Francisco Area)                                                                                                                                                                                                                                                         Norfolk
                                                                                                                                                                                                                                                                                                (Southern Virginia)
                                                                                                                                                                                                                                           Louisville
                                                                                                                                                                                                          St. Louis
                                                         Las Vegas

                                                                                                                                                                                                                                                                      Raleigh-Durham
                                                                                                                                                                             Tulsa                                                         Nashville
                                         Burbank                                                       Albuquerque
                                                                                                       (Santa Fe Area)                                                                  Little Rock
             Los Angeles (LAX)                       Ontario                                                                          Amarillo
                                                    (Palm Springs Area)
                  Orange County                                                                                                                       Oklahoma City
                                                                              Phoenix
                               San Diego                                                                                              Lubbock
                                                                                                                                                                                                                                     Birmingham
                                                                                Tucson
                                                                                                                                                               Dallas                                                 Jackson
                                                                                                                 El Paso              Midland/               (Love Field)
                                                                                                                                      Odessa                                                                                                                                  Jacksonville
                                                                                                                                                    Austin
                                                                                                                                                                                                                               New Orleans
                                                                                                                                           San Antonio                                                                                                                Orlando
                                                                                                                                                                                     Houston
                                                                                                                                                                                                                                                        Tampa Bay
                                                                                                                                                                                     (Hobby & Intercontinental)
                                                                                                                                                    Corpus
                                                                                                                                                                                                                                                                                     West Palm Beach
                                                                                                                                                    Christi
                                                                                                                                                                                                                                                                                     Ft. Lauderdale
                       Southwest System Map                                                                                                                                                                                                                                          (Miami Area)
                                                                                                                                                                Harlingen/South Padre Island


                                                                                                                                                                                                                          California
                                                                                                                                                                                                                            18%
                                                                                                                                                                                                                                                                   East
                                                                                                                                                                                                                                                                   27%
                                                         Southwest                           Other Carriers
                                                           64%                                   36%


                                                                                                                                                                                                                  Remaining West
                                                                                                                                                                                                                      27%
                                                                                                                                                                                                                                                                    Midwest
                                                                                                                                                                                                                                                                     15%


                                                                                                                                                                                                                                            Heartland
                                                                                                                                                                                                                                              13%


                                                      Southwest’s Market Share                                                                                                                                    Southwest’s Capacity By Region
                                                   Southwest's top 100 city-pair markets


                                                                                                                                                                                                                                                                                         200
                                    Southwest’s Top Ten Airports                                                                                                                                                                                                        183
                                    Daily Departures
                                                                                                                                                                                                                                                                                         175
                                                                                                                                                                                                                                                  170

                                                                                                                                                                                                                         143                                                             150
                                                                                                                                                                                          134
                                                                                                                                                               131
                                                                                                                                                                                                                                                                                         125
                                                                                                                                                                                           Baltimore/Washington


                                                                                                                                          120
                                                                                                                    119
                                                                                         114
                                                                 87
                                                                                                                                                                                                                                                                                         100
                                      77
                                                                                                                     Chicago Midway


                                                                                                                                                                                                                          Houston Hobby
                                                                                         Los Angeles


                                                                                                                                                               Dallas Love


                                                                                                                                                                                                                                                                                         75
                                                                                                                                                                                                                                                  Las Vegas
                                       San Diego


                                                                  Nashville


                                                                                                                                          Oakland


                                                                                                                                                                                                                                                                         Phoenix


                                                                                                                                                                                                                                                                                         50
S O U T H W E S T A I R L I N E S C O. 2 0 0 1 A N N UA L R E P O RT
                                            FINANCIAL REVIEW


      Management’s Discussion and Analysis                 F2

      Consolidated Financial Statements                   F8

      Notes to Consolidated Financial Statements          F12

      Report of Independent Auditors                     F20

      Quarterly Financial Data                            F21

      Common Stock Price Ranges and Dividends             F21

      Ten-Year Summary                                   F22

      Corporate Data                                     F24

      Directors and Officers                             F24
F2   S O U T H W E S T A I R L I N E S C O. 2 0 0 1 A N N UA L R E P O RT


     MANAGEMENT’S DISCUSSION AND ANALYSIS OF                                           Currently, available seat mile (ASM) capacity is expected to grow
     FINANCIAL CONDITION AND RESULTS OF OPERATIONS                                  approximately 3.5 percent in 2002 with the planned net addition of at
                                                                                    least eight aircraft. The Company will place in service at least 11 new
     YEAR IN REVIEW                                                                 Boeing 737-700s scheduled for delivery during the year and will retire
        In 2001, Southwest posted a profit for the 29th consecutive year in         three of the Company’s older 737-200s. (The immediately preceding
     one of the most challenging operating environments the air travel              sentences are forward-looking statements that involve uncertainties that
     industry has ever faced. During the year, Southwest also increased our         could result in actual results differing materially from expected results.
     domestic market share, made enhancements that will improve our                 Some significant factors include, but may not be limited to, future
     Customer Service, and ended the year with more Employees and aircraft          capacity decisions made by the Company, demand for air travel,
     than we had when we began the year. Despite the onset of a recession           changes in the Company’s aircraft retirement schedule, etc.)
     early in 2001 and the September 11, 2001, terrorist attacks against the
                                                                                    RESULTS OF OPERATIONS
     United States (the terrorist attacks), Southwest was profitable in each
                                                                                       2001 COMPARED WITH 2000 The Company’s consolidated net
     quarter of the year, including the third and fourth quarters after
                                                                                    income for 2001 was $511.1 million ($.63 per share, diluted), as compared
     excluding federal grants recognized in these quarters under the Air
                                                                                    to 2000 net income, before the cumulative effect of change in
     Transportation Safety and System Stabilization Act (the Act). (See
                                                                                    accounting principle, of $625.2 million ($.79 per share, diluted), a
     Note 3 to the Consolidated Financial Statements for further details on
                                                                                    decrease of 18.2 percent. The prior years’ net income per share
     the terrorist attacks and the Act.) Although we were unable to match
                                                                                    amounts have been restated for the 2001 three-for-two stock split (see
     some of the Company’s record-setting performance levels reached in
                                                                                    Note 11 to the Consolidated Financial Statements). Consolidated results
     2000, our business strategy — primarily shorthaul, high frequency, low-fare,
                                                                                    for 2001 included $235 million in gains that the Company recognized
     point-to-point, high-quality Customer Service — continued to serve us
                                                                                    from grants under the Act and special pre-tax charges of approximately
     well during some difficult times in 2001.
                                                                                    $48 million arising from the terrorist attacks (see Note 3 to the
        In 2001, we continued to maintain our cost advantage over our
                                                                                    Consolidated Financial Statements). Excluding the grant and special
     industry while the recession and events of September 11 put downward
                                                                                    charges related to the terrorist attacks, net income for 2001 was
     pressure on revenues. In response to uncertainties following
                                                                                    $412.9 million ($.51 per share, diluted). The cumulative effect of
     September 11 and the precipitous drop in demand for air travel,
                                                                                    change in accounting principle for 2000 was $22.1 million, net of taxes
     Southwest amended its agreement with The Boeing Company to defer
                                                                                    of $14.0 million (see Note 2 to the Consolidated Financial Statements).
     aircraft deliveries (see Note 4 to the Consolidated Financial
                                                                                    Net income and net income per share, diluted, after the cumulative
     Statements) but did not ground airplanes, reduce service, or furlough
                                                                                    change in accounting principle, for 2000 were $603.1 million and $.76,
     Employees. Following the temporary FAA shutdown of U.S. air space
                                                                                    respectively. Operating income for 2001 was $631.1 million, a decrease
     after the terrorist attacks, load factors have steadily improved to
                                                                                    of 38.2 percent compared to 2000.
     somewhat normal, average historical levels. However, these load factors
                                                                                       Following the terrorist attacks, all U.S. commercial flight operations
     have resulted from significant fare discounting, which continues to
                                                                                    were suspended for approximately three days. However, the Company
     result in year-over-year declines in passenger revenue yields per RPM
                                                                                    continued to incur nearly all of its normal operating expenses (with the
     (passenger yields) and operating revenue yields per ASM.
                                                                                    exception of certain direct trip-related expenditures such as fuel, landing
        As we begin 2002, in addition to the difficult revenue environment for
                                                                                    fees, etc.). The Company cancelled approximately 9,000 flights before
     commercial airlines, the Company is faced with increased war risk insurance
                                                                                    resuming flight operations on September 14, although we did not
     and passenger security costs resulting from continually evolving security
                                                                                    resume our normal pre-September 11 flight schedule until September 18,
     laws and directives. In response to the terrorist attacks, the airline
                                                                                    2001. Once the Company did resume operations, load factors and
     industry has worked diligently with Congress, the DOT, the FAA, and
                                                                                    passenger yields were severely impacted, and ticket refund activity
     law enforcement officials to enhance security. During fourth quarter
                                                                                    increased. The Company estimates that from September 11 through
     2001, the Company was able to offset these additional costs because of
                                                                                    September 30, it incurred operating losses in excess of $130 million.
     lower jet fuel prices and through internal cost reduction initiatives
                                                                                       The effects of the terrorist attacks continued to be felt throughout
     implemented following the terrorist attacks. However, there can be no
                                                                                    fourth quarter 2001. The Company’s operating income during fourth quarter
     assurance the Company will be able to continue to offset future cost
                                                                                    2001 was $37.1 million, a decrease of 85.2 percent compared to fourth
     increases resulting from the changing commercial airline environment.
                                                                                    quarter 2000. Without consideration of any federal grant under the Act
     (The immediately preceding sentence is a forward-looking statement
                                                                                    the Company expects to recognize (see Note 3 to the Consolidated
     that involves uncertainties that could result in actual results differing
                                                                                    Financial Statements), it is not yet known whether the Company will be
     materially from expected results. Some significant factors include, but
                                                                                    profitable in first quarter 2002, due to uncertain economic conditions
     may not be limited to, additional laws or directives that could increase
                                                                                    and the difficult airline industry revenue environment.
     the Company’s costs or result in changes to the Company’s operations, etc.)
        During 2001, we began service to two new cities, West Palm Beach,              OPERATING REVENUES Consolidated operating revenues decreased
     Florida, and Norfolk, Virginia, while also discontinuing service to San        1.7 percent primarily due to a 1.6 percent decrease in passenger
     Francisco International Airport due to airport congestion. We have             revenues. The decrease in passenger revenues was a direct result of the
     been pleased with the initial results in both of the new Southwest             terrorist attacks. Because of the terrorist attacks, fluctuations in
     cities. Prior to September 11, the Company also continued to add flights       passenger revenue can best be explained by discussing the year in two
     between cities already served. Southwest ended 2001 serving 58 cities in       distinct time periods: January through August 2001, and September
     30 states. Immediately following the terrorist attacks, Southwest suspended    through December 2001.
     fleet growth. However, by the end of the year, Southwest had                      From January through August 2001, passenger revenues were
     announced plans for modest growth to resume in early 2002.                     approximately 8.7 percent higher than the same period in 2000 due
F3
                                                                                                               S O U T H W E S T A I R L I N E S C O. 2 0 0 1 A N N UA L R E P O RT


primarily to an increase in capacity, as measured by ASMs, of 11.6 percent.        Operating expenses per ASM for 2001 and 2000 were as follows:
The capacity increase was due to the addition of 14 aircraft during
                                                                                 OPERATING EXPENSES PER ASM
2001 (all prior to September 11) and was partially offset by a decrease
of 1.9 percent in passenger yield. Passenger yields decreased as a                                                                INCREASE PERCENT
                                                                                                           2001             2000 (DECREASE) CHANGE
result of fare discounting by the Company and the airline industry in general
as the United States economy weakened throughout the year. The Company’s
                                                                                 Salaries, wages,
load factor (RPMs divided by ASMs) over this time period was 71.2 percent,
                                                                                  and benefits              2.51¢            2.41¢                 .10¢                4.1%
compared to 71.7 percent for the same period in 2000.
   From September through December 2001, passenger revenues were                 Employee retirement
approximately 21.7 percent lower than the same period of 2000. Capacity
                                                                                  plans                      .33                .40               (.07)             ( 17.5)
increased 4.0 percent and the Company’s load factor fell to 62.0 percent,
                                                                                 Fuel and oil                1.18             1.34                (.16)             ( 1 1.9)
compared to 68.2 percent during the same period of 2000. Passenger
yields were 17.2 percent lower during this period versus the same period         Maintenance materials
of 2000 due to aggressive fare sales following the terrorist attacks.
                                                                                  and repairs                .61                .63               (.02)             ( 3.2)
   For the full year, the Company experienced a 1.2 percent increase in
                                                                                 Agency commissions          .16                .27               (. 1 1)           (40.7)
revenue passengers carried, a 5.4 percent increase in revenue passenger
miles (RPMs), and a 9.0 percent increase in ASMs. The Company’s load             Aircraft rentals            .29                .33               (.04)             (12.1 )
factor for 2001 was off 2.4 points to 68.1 percent and there was a 6.6 percent
                                                                                 Landing fees and
decrease in 2001 passenger yield.
                                                                                  other rentals              .48                .44                .04                  9.1
   Load factors in January 2002 continued to trail those experienced
in January 2001. Additionally, passenger yields remain significantly
                                                                                 Depreciation                .49                .47                .02                  4.3
below prior year levels. As a result, the Company expects first quarter 2002
                                                                                 Other                       1.49             1.44                 .05                  3.5
revenue per available seat mile to continue to fall below first quarter
2001 levels. (The immediately preceding sentence is a forward-looking             Total                     7.54¢            7.73¢                (.19)¢               (2.5)%
statement, which involves uncertainties that could result in actual
                                                                                    Approximately 59 percent of the increase in Salaries, wages, and
results differing materially from expected results. Some significant factors
                                                                                 benefits per ASM was due to increases in salaries and wages from higher
include, but may not be limited to, additional incidents that could cause the
                                                                                 average wage rates within certain workgroups and increased headcount
public to question the safety and/or efficiency of air travel, competitive
                                                                                 due, in part, to the increased security requirements following the
pressure such as fare sales and capacity changes by other carriers, general
                                                                                 September terrorist attacks. The remaining 41 percent of the increase
economic conditions, operational disruptions as a result of bad weather,
                                                                                 in Salaries, wages, and benefits per ASM was due to higher benefits
the impact of labor issues, and variations in advance booking trends.)
                                                                                 costs, primarily health care.
See Note 1 to the Consolidated Financial Statements for further
                                                                                    The Company’s Ramp, Operations, and Provisioning Agents are subject
information on the Company’s revenue recognition policy.
                                                                                 to an agreement with the Transport Workers Union of America (TWU),
   As a result of weak economic conditions throughout 2001, consolidated
                                                                                 which became amendable in December 2000. The Company reached an
freight revenues decreased 17.6 percent. There were decreases in both
                                                                                 agreement with the TWU, which was ratified by its membership in June
the number of freight shipments and revenue per shipment. Following
                                                                                 2001. The new contract becomes amendable in June 2006.
the September 11, 2001, terrorist attacks, the United States Postal
                                                                                    The Company’s Mechanics are subject to an agreement with the
Service made the decision to shift a portion of the mail that commercial
                                                                                 International Brotherhood of Teamsters (the Teamsters), which became
carriers had previously carried to freight carriers. As a result of this
                                                                                 amendable in August 2001. Southwest is currently in negotiations with
decision, the Company expects to experience a decrease in freight
                                                                                 the Teamsters for a new contract.
revenues during at least the first half of 2002 when compared to 2001.
                                                                                    The Company’s Flight Attendants are subject to an agreement with
(The immediately preceding sentence is a forward-looking statement,
                                                                                 the TWU, which becomes amendable in June 2002. The Company’s
which involves uncertainties that could result in actual results differing
                                                                                 Customer Service and Reservations Agents are subject to an agreement
materially from expected results. Some significant factors include, but
                                                                                 with the International Association of Machinists and Aerospace
may not be limited to, general economic conditions, subsequent shifts
                                                                                 Workers, which becomes amendable in November 2002.
in business by the United States Postal Service, and capacity changes
                                                                                    Employee retirement plans expense per ASM decreased 17.5 percent,
by other carriers.) Other revenues increased 20.3 percent primarily due
                                                                                 primarily due to the decrease in Company earnings available for
to an increase in commissions earned from programs the Company
                                                                                 profitsharing. The decrease in earnings more than offset an increase in
sponsors with certain business partners, such as the Company-sponsored
                                                                                 expense due to a fourth quarter amendment made to the Company’s
First USA Visa card.
                                                                                 profitsharing plan. This amendment enabled the Company to take into
                                                                                 consideration federal grants under the Act and special charges resulting
   OPERATING EXPENSES Consolidated operating expenses for 2001
                                                                                 from the terrorist attacks in the calculation of profitsharing.
increased 6.4 percent, compared to the 9.0 percent increase in capacity.
                                                                                    Fuel and oil expense per ASM decreased 11.9 percent, primarily due
Operating expenses per ASM decreased 2.5 percent to $.0754,
                                                                                 to a 10.0 percent decrease in the average jet fuel cost per gallon. The
compared to $.0773 in 2000, primarily due to a decrease in average jet
                                                                                 average cost per gallon of jet fuel in 2001 was $.7086 compared to
fuel prices. The average fuel cost per gallon in 2001 was $.7086, 10.0
                                                                                 $.7869 in 2000, including the effects of hedging activities. The
percent lower than the average cost per gallon in 2000 of $.7869.
                                                                                 Company’s 2001 and 2000 average jet fuel prices are net of
Excluding fuel expense, operating expenses per ASM decreased .3 percent.
southwest airline ar01

Mais conteúdo relacionado

Mais procurados

SHFL Q3 11 Earnings Presentation
SHFL Q3 11 Earnings PresentationSHFL Q3 11 Earnings Presentation
SHFL Q3 11 Earnings PresentationAlexandru Corotchi
 
williams 2008 AR Final
williams 2008 AR Finalwilliams 2008 AR Final
williams 2008 AR Finalfinance21
 
constellation energy 2001 Annual Report
constellation energy 2001 Annual Report constellation energy 2001 Annual Report
constellation energy 2001 Annual Report finance12
 
HENRY SCHEIN 2000AnnualReport
HENRY SCHEIN 2000AnnualReportHENRY SCHEIN 2000AnnualReport
HENRY SCHEIN 2000AnnualReportfinance35
 
1 Q08 Results Presentation
1 Q08 Results Presentation1 Q08 Results Presentation
1 Q08 Results PresentationLocaliza
 
stryker 0D01F279-9F33-4E3E-A708-FE2047EF5E47_Stryker08AR.Single
stryker 0D01F279-9F33-4E3E-A708-FE2047EF5E47_Stryker08AR.Singlestryker 0D01F279-9F33-4E3E-A708-FE2047EF5E47_Stryker08AR.Single
stryker 0D01F279-9F33-4E3E-A708-FE2047EF5E47_Stryker08AR.Singlefinance34
 
williams 2007 AR
williams  2007 ARwilliams  2007 AR
williams 2007 ARfinance21
 

Mais procurados (9)

SHFL Q3 11 Earnings Presentation
SHFL Q3 11 Earnings PresentationSHFL Q3 11 Earnings Presentation
SHFL Q3 11 Earnings Presentation
 
williams 2008 AR Final
williams 2008 AR Finalwilliams 2008 AR Final
williams 2008 AR Final
 
constellation energy 2001 Annual Report
constellation energy 2001 Annual Report constellation energy 2001 Annual Report
constellation energy 2001 Annual Report
 
HENRY SCHEIN 2000AnnualReport
HENRY SCHEIN 2000AnnualReportHENRY SCHEIN 2000AnnualReport
HENRY SCHEIN 2000AnnualReport
 
1 Q08 Results Presentation
1 Q08 Results Presentation1 Q08 Results Presentation
1 Q08 Results Presentation
 
MHK07/03/07
MHK07/03/07MHK07/03/07
MHK07/03/07
 
stryker 0D01F279-9F33-4E3E-A708-FE2047EF5E47_Stryker08AR.Single
stryker 0D01F279-9F33-4E3E-A708-FE2047EF5E47_Stryker08AR.Singlestryker 0D01F279-9F33-4E3E-A708-FE2047EF5E47_Stryker08AR.Single
stryker 0D01F279-9F33-4E3E-A708-FE2047EF5E47_Stryker08AR.Single
 
Sbux informe 2009
Sbux informe 2009Sbux informe 2009
Sbux informe 2009
 
williams 2007 AR
williams  2007 ARwilliams  2007 AR
williams 2007 AR
 

Semelhante a southwest airline ar01

southwest airline ar00
southwest airline ar00southwest airline ar00
southwest airline ar00finance40
 
Avnet Analyst Day 2010 Presentation 3 Financial Report
Avnet Analyst Day 2010 Presentation 3 Financial ReportAvnet Analyst Day 2010 Presentation 3 Financial Report
Avnet Analyst Day 2010 Presentation 3 Financial ReportAvnet Electronics Marketing
 
southwest airline ar99
southwest airline ar99southwest airline ar99
southwest airline ar99finance40
 
Bear Stearns & Co. 13th Annual Retail, Restaurants and Consumer Conference
Bear Stearns & Co. 13th Annual Retail, Restaurants and Consumer ConferenceBear Stearns & Co. 13th Annual Retail, Restaurants and Consumer Conference
Bear Stearns & Co. 13th Annual Retail, Restaurants and Consumer Conferencefinance7
 
April Investor Presentation
April Investor PresentationApril Investor Presentation
April Investor Presentationfinance7
 
April Investor Presentation
April Investor PresentationApril Investor Presentation
April Investor Presentationfinance7
 
William Blair & Company 27th Annual Growth Stock Conference
William Blair & Company 27th Annual Growth Stock ConferenceWilliam Blair & Company 27th Annual Growth Stock Conference
William Blair & Company 27th Annual Growth Stock Conferencefinance7
 
Starbucks 2009 Annual Report
Starbucks 2009 Annual ReportStarbucks 2009 Annual Report
Starbucks 2009 Annual Reportnove88
 
Morgan Stanley Global Consumer & Retail Conference
Morgan Stanley Global Consumer & Retail ConferenceMorgan Stanley Global Consumer & Retail Conference
Morgan Stanley Global Consumer & Retail Conferencefinance7
 
emerson electricl annual reports 2008
emerson electricl annual reports 2008emerson electricl annual reports 2008
emerson electricl annual reports 2008finance12
 
emerson electricl Proxy Statement for 2009 Annual Shareholders Meeting
emerson electricl Proxy Statement for 2009 Annual Shareholders Meeting  emerson electricl Proxy Statement for 2009 Annual Shareholders Meeting
emerson electricl Proxy Statement for 2009 Annual Shareholders Meeting finance12
 
Melbourne IT FY 2011 Investor Presentation
Melbourne IT FY 2011 Investor PresentationMelbourne IT FY 2011 Investor Presentation
Melbourne IT FY 2011 Investor PresentationMelbourne IT
 
Call 1 q12
Call 1 q12Call 1 q12
Call 1 q12BRMALLS
 
2011 Annual Report Corporate Section
2011 Annual Report Corporate Section2011 Annual Report Corporate Section
2011 Annual Report Corporate SectionRecticel NV/SA
 
SHFL Q3 11 Earnings Presentation
SHFL Q3 11 Earnings PresentationSHFL Q3 11 Earnings Presentation
SHFL Q3 11 Earnings PresentationAlexandru Corotchi
 
SHFL Q3 11 Earnings Presentation
SHFL Q3 11 Earnings PresentationSHFL Q3 11 Earnings Presentation
SHFL Q3 11 Earnings PresentationAlexandru Corotchi
 
SHFL Q3 11 Earnings Presentation
SHFL Q3 11 Earnings PresentationSHFL Q3 11 Earnings Presentation
SHFL Q3 11 Earnings PresentationAlexandru Corotchi
 

Semelhante a southwest airline ar01 (20)

southwest airline ar00
southwest airline ar00southwest airline ar00
southwest airline ar00
 
Avnet Analyst Day 2010 Presentation 3 Financial Report
Avnet Analyst Day 2010 Presentation 3 Financial ReportAvnet Analyst Day 2010 Presentation 3 Financial Report
Avnet Analyst Day 2010 Presentation 3 Financial Report
 
southwest airline ar99
southwest airline ar99southwest airline ar99
southwest airline ar99
 
Bear Stearns & Co. 13th Annual Retail, Restaurants and Consumer Conference
Bear Stearns & Co. 13th Annual Retail, Restaurants and Consumer ConferenceBear Stearns & Co. 13th Annual Retail, Restaurants and Consumer Conference
Bear Stearns & Co. 13th Annual Retail, Restaurants and Consumer Conference
 
Bear Stearns & Co. 13th Annual Retail, Restaurants and Consumer Conference
Bear Stearns & Co. 13th Annual Retail, Restaurants and Consumer ConferenceBear Stearns & Co. 13th Annual Retail, Restaurants and Consumer Conference
Bear Stearns & Co. 13th Annual Retail, Restaurants and Consumer Conference
 
April Investor Presentation
April Investor PresentationApril Investor Presentation
April Investor Presentation
 
April Investor Presentation
April Investor PresentationApril Investor Presentation
April Investor Presentation
 
William Blair & Company 27th Annual Growth Stock Conference
William Blair & Company 27th Annual Growth Stock ConferenceWilliam Blair & Company 27th Annual Growth Stock Conference
William Blair & Company 27th Annual Growth Stock Conference
 
Starbucks 2009 Annual Report
Starbucks 2009 Annual ReportStarbucks 2009 Annual Report
Starbucks 2009 Annual Report
 
Morgan Stanley Global Consumer & Retail Conference
Morgan Stanley Global Consumer & Retail ConferenceMorgan Stanley Global Consumer & Retail Conference
Morgan Stanley Global Consumer & Retail Conference
 
emerson electricl annual reports 2008
emerson electricl annual reports 2008emerson electricl annual reports 2008
emerson electricl annual reports 2008
 
emerson electricl Proxy Statement for 2009 Annual Shareholders Meeting
emerson electricl Proxy Statement for 2009 Annual Shareholders Meeting  emerson electricl Proxy Statement for 2009 Annual Shareholders Meeting
emerson electricl Proxy Statement for 2009 Annual Shareholders Meeting
 
Q2 2009 Earning Report of Knoll Inc.
Q2 2009 Earning Report of Knoll Inc.Q2 2009 Earning Report of Knoll Inc.
Q2 2009 Earning Report of Knoll Inc.
 
2005 Shareholders Meeting
	2005 Shareholders Meeting	2005 Shareholders Meeting
2005 Shareholders Meeting
 
Melbourne IT FY 2011 Investor Presentation
Melbourne IT FY 2011 Investor PresentationMelbourne IT FY 2011 Investor Presentation
Melbourne IT FY 2011 Investor Presentation
 
Call 1 q12
Call 1 q12Call 1 q12
Call 1 q12
 
2011 Annual Report Corporate Section
2011 Annual Report Corporate Section2011 Annual Report Corporate Section
2011 Annual Report Corporate Section
 
SHFL Q3 11 Earnings Presentation
SHFL Q3 11 Earnings PresentationSHFL Q3 11 Earnings Presentation
SHFL Q3 11 Earnings Presentation
 
SHFL Q3 11 Earnings Presentation
SHFL Q3 11 Earnings PresentationSHFL Q3 11 Earnings Presentation
SHFL Q3 11 Earnings Presentation
 
SHFL Q3 11 Earnings Presentation
SHFL Q3 11 Earnings PresentationSHFL Q3 11 Earnings Presentation
SHFL Q3 11 Earnings Presentation
 

Mais de finance40

thermo fisher ED886123-7163-46F5-8387-5F57485F786B_FINAL09SHOW_III
thermo fisher ED886123-7163-46F5-8387-5F57485F786B_FINAL09SHOW_IIIthermo fisher ED886123-7163-46F5-8387-5F57485F786B_FINAL09SHOW_III
thermo fisher ED886123-7163-46F5-8387-5F57485F786B_FINAL09SHOW_IIIfinance40
 
thermo fisher 04/01/06_10Q
thermo fisher 04/01/06_10Qthermo fisher 04/01/06_10Q
thermo fisher 04/01/06_10Qfinance40
 
thermo fisher 04/01/06_10Q
thermo fisher 04/01/06_10Qthermo fisher 04/01/06_10Q
thermo fisher 04/01/06_10Qfinance40
 
thermo fisher 07/01/06_10Q
thermo fisher 07/01/06_10Qthermo fisher 07/01/06_10Q
thermo fisher 07/01/06_10Qfinance40
 
thermo fisher 07/01/06_10Q
thermo fisher 07/01/06_10Qthermo fisher 07/01/06_10Q
thermo fisher 07/01/06_10Qfinance40
 
thermo fisher 09/30/06_10Q
thermo fisher 09/30/06_10Qthermo fisher 09/30/06_10Q
thermo fisher 09/30/06_10Qfinance40
 
thermo fisher 09/30/06_10Q
thermo fisher 09/30/06_10Qthermo fisher 09/30/06_10Q
thermo fisher 09/30/06_10Qfinance40
 
thermo fisher 12/30/0610K
thermo fisher 12/30/0610Kthermo fisher 12/30/0610K
thermo fisher 12/30/0610Kfinance40
 
thermo fisher 12/30/0610K
thermo fisher 12/30/0610Kthermo fisher 12/30/0610K
thermo fisher 12/30/0610Kfinance40
 
thermo fisher Q107_10Q
thermo fisher Q107_10Qthermo fisher Q107_10Q
thermo fisher Q107_10Qfinance40
 
thermo fisher Q107_10Q
thermo fisher Q107_10Qthermo fisher Q107_10Q
thermo fisher Q107_10Qfinance40
 
thermo fisher Q207_10Q
thermo fisher Q207_10Qthermo fisher Q207_10Q
thermo fisher Q207_10Qfinance40
 
thermo fisher Q207_10Q
thermo fisher Q207_10Qthermo fisher Q207_10Q
thermo fisher Q207_10Qfinance40
 
thermo fisher Q307_10Q
thermo fisher Q307_10Qthermo fisher Q307_10Q
thermo fisher Q307_10Qfinance40
 
thermo fisher Q307_10Q
thermo fisher Q307_10Qthermo fisher Q307_10Q
thermo fisher Q307_10Qfinance40
 
tmo_2007_10K
tmo_2007_10Ktmo_2007_10K
tmo_2007_10Kfinance40
 
tmo_2007_10K
tmo_2007_10Ktmo_2007_10K
tmo_2007_10Kfinance40
 
thermo fisher Q10810q
thermo fisher Q10810qthermo fisher Q10810q
thermo fisher Q10810qfinance40
 
thermo fisher Q10810q
thermo fisher Q10810qthermo fisher Q10810q
thermo fisher Q10810qfinance40
 
thermo fisher tmoq310q
thermo fisher tmoq310qthermo fisher tmoq310q
thermo fisher tmoq310qfinance40
 

Mais de finance40 (20)

thermo fisher ED886123-7163-46F5-8387-5F57485F786B_FINAL09SHOW_III
thermo fisher ED886123-7163-46F5-8387-5F57485F786B_FINAL09SHOW_IIIthermo fisher ED886123-7163-46F5-8387-5F57485F786B_FINAL09SHOW_III
thermo fisher ED886123-7163-46F5-8387-5F57485F786B_FINAL09SHOW_III
 
thermo fisher 04/01/06_10Q
thermo fisher 04/01/06_10Qthermo fisher 04/01/06_10Q
thermo fisher 04/01/06_10Q
 
thermo fisher 04/01/06_10Q
thermo fisher 04/01/06_10Qthermo fisher 04/01/06_10Q
thermo fisher 04/01/06_10Q
 
thermo fisher 07/01/06_10Q
thermo fisher 07/01/06_10Qthermo fisher 07/01/06_10Q
thermo fisher 07/01/06_10Q
 
thermo fisher 07/01/06_10Q
thermo fisher 07/01/06_10Qthermo fisher 07/01/06_10Q
thermo fisher 07/01/06_10Q
 
thermo fisher 09/30/06_10Q
thermo fisher 09/30/06_10Qthermo fisher 09/30/06_10Q
thermo fisher 09/30/06_10Q
 
thermo fisher 09/30/06_10Q
thermo fisher 09/30/06_10Qthermo fisher 09/30/06_10Q
thermo fisher 09/30/06_10Q
 
thermo fisher 12/30/0610K
thermo fisher 12/30/0610Kthermo fisher 12/30/0610K
thermo fisher 12/30/0610K
 
thermo fisher 12/30/0610K
thermo fisher 12/30/0610Kthermo fisher 12/30/0610K
thermo fisher 12/30/0610K
 
thermo fisher Q107_10Q
thermo fisher Q107_10Qthermo fisher Q107_10Q
thermo fisher Q107_10Q
 
thermo fisher Q107_10Q
thermo fisher Q107_10Qthermo fisher Q107_10Q
thermo fisher Q107_10Q
 
thermo fisher Q207_10Q
thermo fisher Q207_10Qthermo fisher Q207_10Q
thermo fisher Q207_10Q
 
thermo fisher Q207_10Q
thermo fisher Q207_10Qthermo fisher Q207_10Q
thermo fisher Q207_10Q
 
thermo fisher Q307_10Q
thermo fisher Q307_10Qthermo fisher Q307_10Q
thermo fisher Q307_10Q
 
thermo fisher Q307_10Q
thermo fisher Q307_10Qthermo fisher Q307_10Q
thermo fisher Q307_10Q
 
tmo_2007_10K
tmo_2007_10Ktmo_2007_10K
tmo_2007_10K
 
tmo_2007_10K
tmo_2007_10Ktmo_2007_10K
tmo_2007_10K
 
thermo fisher Q10810q
thermo fisher Q10810qthermo fisher Q10810q
thermo fisher Q10810q
 
thermo fisher Q10810q
thermo fisher Q10810qthermo fisher Q10810q
thermo fisher Q10810q
 
thermo fisher tmoq310q
thermo fisher tmoq310qthermo fisher tmoq310q
thermo fisher tmoq310q
 

Último

Pooja 9892124323 : Call Girl in Juhu Escorts Service Free Home Delivery
Pooja 9892124323 : Call Girl in Juhu Escorts Service Free Home DeliveryPooja 9892124323 : Call Girl in Juhu Escorts Service Free Home Delivery
Pooja 9892124323 : Call Girl in Juhu Escorts Service Free Home DeliveryPooja Nehwal
 
High Class Call Girls Nagpur Grishma Call 7001035870 Meet With Nagpur Escorts
High Class Call Girls Nagpur Grishma Call 7001035870 Meet With Nagpur EscortsHigh Class Call Girls Nagpur Grishma Call 7001035870 Meet With Nagpur Escorts
High Class Call Girls Nagpur Grishma Call 7001035870 Meet With Nagpur Escortsranjana rawat
 
The Economic History of the U.S. Lecture 20.pdf
The Economic History of the U.S. Lecture 20.pdfThe Economic History of the U.S. Lecture 20.pdf
The Economic History of the U.S. Lecture 20.pdfGale Pooley
 
WhatsApp 📞 Call : 9892124323 ✅Call Girls In Chembur ( Mumbai ) secure service
WhatsApp 📞 Call : 9892124323  ✅Call Girls In Chembur ( Mumbai ) secure serviceWhatsApp 📞 Call : 9892124323  ✅Call Girls In Chembur ( Mumbai ) secure service
WhatsApp 📞 Call : 9892124323 ✅Call Girls In Chembur ( Mumbai ) secure servicePooja Nehwal
 
05_Annelore Lenoir_Docbyte_MeetupDora&Cybersecurity.pptx
05_Annelore Lenoir_Docbyte_MeetupDora&Cybersecurity.pptx05_Annelore Lenoir_Docbyte_MeetupDora&Cybersecurity.pptx
05_Annelore Lenoir_Docbyte_MeetupDora&Cybersecurity.pptxFinTech Belgium
 
Independent Call Girl Number in Kurla Mumbai📲 Pooja Nehwal 9892124323 💞 Full ...
Independent Call Girl Number in Kurla Mumbai📲 Pooja Nehwal 9892124323 💞 Full ...Independent Call Girl Number in Kurla Mumbai📲 Pooja Nehwal 9892124323 💞 Full ...
Independent Call Girl Number in Kurla Mumbai📲 Pooja Nehwal 9892124323 💞 Full ...Pooja Nehwal
 
The Economic History of the U.S. Lecture 22.pdf
The Economic History of the U.S. Lecture 22.pdfThe Economic History of the U.S. Lecture 22.pdf
The Economic History of the U.S. Lecture 22.pdfGale Pooley
 
The Economic History of the U.S. Lecture 19.pdf
The Economic History of the U.S. Lecture 19.pdfThe Economic History of the U.S. Lecture 19.pdf
The Economic History of the U.S. Lecture 19.pdfGale Pooley
 
The Economic History of the U.S. Lecture 30.pdf
The Economic History of the U.S. Lecture 30.pdfThe Economic History of the U.S. Lecture 30.pdf
The Economic History of the U.S. Lecture 30.pdfGale Pooley
 
Solution Manual for Financial Accounting, 11th Edition by Robert Libby, Patri...
Solution Manual for Financial Accounting, 11th Edition by Robert Libby, Patri...Solution Manual for Financial Accounting, 11th Edition by Robert Libby, Patri...
Solution Manual for Financial Accounting, 11th Edition by Robert Libby, Patri...ssifa0344
 
The Economic History of the U.S. Lecture 25.pdf
The Economic History of the U.S. Lecture 25.pdfThe Economic History of the U.S. Lecture 25.pdf
The Economic History of the U.S. Lecture 25.pdfGale Pooley
 
(DIYA) Bhumkar Chowk Call Girls Just Call 7001035870 [ Cash on Delivery ] Pun...
(DIYA) Bhumkar Chowk Call Girls Just Call 7001035870 [ Cash on Delivery ] Pun...(DIYA) Bhumkar Chowk Call Girls Just Call 7001035870 [ Cash on Delivery ] Pun...
(DIYA) Bhumkar Chowk Call Girls Just Call 7001035870 [ Cash on Delivery ] Pun...ranjana rawat
 
CALL ON ➥8923113531 🔝Call Girls Gomti Nagar Lucknow best sexual service
CALL ON ➥8923113531 🔝Call Girls Gomti Nagar Lucknow best sexual serviceCALL ON ➥8923113531 🔝Call Girls Gomti Nagar Lucknow best sexual service
CALL ON ➥8923113531 🔝Call Girls Gomti Nagar Lucknow best sexual serviceanilsa9823
 
Malad Call Girl in Services 9892124323 | ₹,4500 With Room Free Delivery
Malad Call Girl in Services  9892124323 | ₹,4500 With Room Free DeliveryMalad Call Girl in Services  9892124323 | ₹,4500 With Room Free Delivery
Malad Call Girl in Services 9892124323 | ₹,4500 With Room Free DeliveryPooja Nehwal
 
Instant Issue Debit Cards - High School Spirit
Instant Issue Debit Cards - High School SpiritInstant Issue Debit Cards - High School Spirit
Instant Issue Debit Cards - High School Spiritegoetzinger
 
VIP Call Girls Service Dilsukhnagar Hyderabad Call +91-8250192130
VIP Call Girls Service Dilsukhnagar Hyderabad Call +91-8250192130VIP Call Girls Service Dilsukhnagar Hyderabad Call +91-8250192130
VIP Call Girls Service Dilsukhnagar Hyderabad Call +91-8250192130Suhani Kapoor
 
02_Fabio Colombo_Accenture_MeetupDora&Cybersecurity.pptx
02_Fabio Colombo_Accenture_MeetupDora&Cybersecurity.pptx02_Fabio Colombo_Accenture_MeetupDora&Cybersecurity.pptx
02_Fabio Colombo_Accenture_MeetupDora&Cybersecurity.pptxFinTech Belgium
 
Log your LOA pain with Pension Lab's brilliant campaign
Log your LOA pain with Pension Lab's brilliant campaignLog your LOA pain with Pension Lab's brilliant campaign
Log your LOA pain with Pension Lab's brilliant campaignHenry Tapper
 
Booking open Available Pune Call Girls Shivane 6297143586 Call Hot Indian Gi...
Booking open Available Pune Call Girls Shivane  6297143586 Call Hot Indian Gi...Booking open Available Pune Call Girls Shivane  6297143586 Call Hot Indian Gi...
Booking open Available Pune Call Girls Shivane 6297143586 Call Hot Indian Gi...Call Girls in Nagpur High Profile
 

Último (20)

Pooja 9892124323 : Call Girl in Juhu Escorts Service Free Home Delivery
Pooja 9892124323 : Call Girl in Juhu Escorts Service Free Home DeliveryPooja 9892124323 : Call Girl in Juhu Escorts Service Free Home Delivery
Pooja 9892124323 : Call Girl in Juhu Escorts Service Free Home Delivery
 
High Class Call Girls Nagpur Grishma Call 7001035870 Meet With Nagpur Escorts
High Class Call Girls Nagpur Grishma Call 7001035870 Meet With Nagpur EscortsHigh Class Call Girls Nagpur Grishma Call 7001035870 Meet With Nagpur Escorts
High Class Call Girls Nagpur Grishma Call 7001035870 Meet With Nagpur Escorts
 
The Economic History of the U.S. Lecture 20.pdf
The Economic History of the U.S. Lecture 20.pdfThe Economic History of the U.S. Lecture 20.pdf
The Economic History of the U.S. Lecture 20.pdf
 
WhatsApp 📞 Call : 9892124323 ✅Call Girls In Chembur ( Mumbai ) secure service
WhatsApp 📞 Call : 9892124323  ✅Call Girls In Chembur ( Mumbai ) secure serviceWhatsApp 📞 Call : 9892124323  ✅Call Girls In Chembur ( Mumbai ) secure service
WhatsApp 📞 Call : 9892124323 ✅Call Girls In Chembur ( Mumbai ) secure service
 
05_Annelore Lenoir_Docbyte_MeetupDora&Cybersecurity.pptx
05_Annelore Lenoir_Docbyte_MeetupDora&Cybersecurity.pptx05_Annelore Lenoir_Docbyte_MeetupDora&Cybersecurity.pptx
05_Annelore Lenoir_Docbyte_MeetupDora&Cybersecurity.pptx
 
Independent Call Girl Number in Kurla Mumbai📲 Pooja Nehwal 9892124323 💞 Full ...
Independent Call Girl Number in Kurla Mumbai📲 Pooja Nehwal 9892124323 💞 Full ...Independent Call Girl Number in Kurla Mumbai📲 Pooja Nehwal 9892124323 💞 Full ...
Independent Call Girl Number in Kurla Mumbai📲 Pooja Nehwal 9892124323 💞 Full ...
 
The Economic History of the U.S. Lecture 22.pdf
The Economic History of the U.S. Lecture 22.pdfThe Economic History of the U.S. Lecture 22.pdf
The Economic History of the U.S. Lecture 22.pdf
 
The Economic History of the U.S. Lecture 19.pdf
The Economic History of the U.S. Lecture 19.pdfThe Economic History of the U.S. Lecture 19.pdf
The Economic History of the U.S. Lecture 19.pdf
 
The Economic History of the U.S. Lecture 30.pdf
The Economic History of the U.S. Lecture 30.pdfThe Economic History of the U.S. Lecture 30.pdf
The Economic History of the U.S. Lecture 30.pdf
 
Solution Manual for Financial Accounting, 11th Edition by Robert Libby, Patri...
Solution Manual for Financial Accounting, 11th Edition by Robert Libby, Patri...Solution Manual for Financial Accounting, 11th Edition by Robert Libby, Patri...
Solution Manual for Financial Accounting, 11th Edition by Robert Libby, Patri...
 
The Economic History of the U.S. Lecture 25.pdf
The Economic History of the U.S. Lecture 25.pdfThe Economic History of the U.S. Lecture 25.pdf
The Economic History of the U.S. Lecture 25.pdf
 
(DIYA) Bhumkar Chowk Call Girls Just Call 7001035870 [ Cash on Delivery ] Pun...
(DIYA) Bhumkar Chowk Call Girls Just Call 7001035870 [ Cash on Delivery ] Pun...(DIYA) Bhumkar Chowk Call Girls Just Call 7001035870 [ Cash on Delivery ] Pun...
(DIYA) Bhumkar Chowk Call Girls Just Call 7001035870 [ Cash on Delivery ] Pun...
 
CALL ON ➥8923113531 🔝Call Girls Gomti Nagar Lucknow best sexual service
CALL ON ➥8923113531 🔝Call Girls Gomti Nagar Lucknow best sexual serviceCALL ON ➥8923113531 🔝Call Girls Gomti Nagar Lucknow best sexual service
CALL ON ➥8923113531 🔝Call Girls Gomti Nagar Lucknow best sexual service
 
Malad Call Girl in Services 9892124323 | ₹,4500 With Room Free Delivery
Malad Call Girl in Services  9892124323 | ₹,4500 With Room Free DeliveryMalad Call Girl in Services  9892124323 | ₹,4500 With Room Free Delivery
Malad Call Girl in Services 9892124323 | ₹,4500 With Room Free Delivery
 
Veritas Interim Report 1 January–31 March 2024
Veritas Interim Report 1 January–31 March 2024Veritas Interim Report 1 January–31 March 2024
Veritas Interim Report 1 January–31 March 2024
 
Instant Issue Debit Cards - High School Spirit
Instant Issue Debit Cards - High School SpiritInstant Issue Debit Cards - High School Spirit
Instant Issue Debit Cards - High School Spirit
 
VIP Call Girls Service Dilsukhnagar Hyderabad Call +91-8250192130
VIP Call Girls Service Dilsukhnagar Hyderabad Call +91-8250192130VIP Call Girls Service Dilsukhnagar Hyderabad Call +91-8250192130
VIP Call Girls Service Dilsukhnagar Hyderabad Call +91-8250192130
 
02_Fabio Colombo_Accenture_MeetupDora&Cybersecurity.pptx
02_Fabio Colombo_Accenture_MeetupDora&Cybersecurity.pptx02_Fabio Colombo_Accenture_MeetupDora&Cybersecurity.pptx
02_Fabio Colombo_Accenture_MeetupDora&Cybersecurity.pptx
 
Log your LOA pain with Pension Lab's brilliant campaign
Log your LOA pain with Pension Lab's brilliant campaignLog your LOA pain with Pension Lab's brilliant campaign
Log your LOA pain with Pension Lab's brilliant campaign
 
Booking open Available Pune Call Girls Shivane 6297143586 Call Hot Indian Gi...
Booking open Available Pune Call Girls Shivane  6297143586 Call Hot Indian Gi...Booking open Available Pune Call Girls Shivane  6297143586 Call Hot Indian Gi...
Booking open Available Pune Call Girls Shivane 6297143586 Call Hot Indian Gi...
 

southwest airline ar01

  • 1. 2001 marks Southwest Airlines’ 30th Anniversary. For 30 years now, we have had one mission: low fares. In that respect, this year was no different. But as we all know, 2001 was a year like no other, in both our Company’s and our country’s history. In first quarter, we unveiled our new look for the new millennium — beautiful Canyon Blue jets with all-leather interiors. In second quarter, our Chairman, Herb Kelleher, announced that he would be sharing his responsibilities with our new Vice Chairman and CEO, Jim Parker, and our new President and COO, Colleen Barrett. The National Tragedy struck our collective hearts, minds, and lives in third quarter. In fourth quarter, our nation and our Company began the difficult process of healing together. Nothing will keep us from moving ahead. Freedom, and the Freedom to Fly, will most certainly endure. 19.9% * 19.7% $0.79 * 20% 11.1% * $0.80 12% 10.4% 18.1% 10.0% 18% 17.4% $0.63 $0.70 9.2% 10% 8.3% $0.59 $0.55 $0.60 16% 8% 13.7% 14% $0.50 $0.41 6% $0.40 12% 4% $0.30 10% 2% $0.20 8% 1997 1998 1999 2000 2001 1997 1998 1999 2000 2001 1997 1998 1999 2000 2001 Return On Stockholders’ Equity Net Margin Net Income Per Share, Diluted CONSOLIDATED HIGHLIGHTS 2001 2000 CHANGE (DOLLARS IN THOUSANDS, EXCEPT PER SHARE AMOUNTS) Operating revenues $5,555, 1 74 $5,649,560 (1.7)% Operating expenses $4,924,052 $4,628,4 1 5 6.4% (38.2)% Operating income $ 6 3 1 ,1 2 2 $ 1,021,1 4 5 (6.7)pts. Operating margin 1 1 .4% 18.1% Net income $625,224 * $51 1 ,1 47 (18.2)% (1.9)pts. 1 1 .1 %* 9.2% Net margin Net income per share – basic $0.84 * $0.67 (20.2)% $0.79 * Net income per share – diluted $0.63 (20.3)% Stockholders’ equity $4,014,053 $3,451,320 16.3% Return on average stockholders’ equity (6.2)pts. 19.9% * 1 3 .7 % Stockholders’ equity per common share outstanding $5.24 $4.53 15.7% Revenue passengers carried 64,446,773 6 3, 678 , 261 1.2% Revenue passenger miles {RPMs} (000s) 4 4 , 493,9 1 6 4 2 , 2 1 5 ,1 6 2 5.4% Available seat miles {ASMs} (000s) 65,295,290 59,909,965 9.0% Passenger load factor 68.1% 70.5% (2.4)pts. Passenger revenue yield per RPM 12.09¢ 12.95¢ (6.6)% Operating revenue yield per ASM 8.5 1 ¢ 9.43¢ (9.8)% Operating expenses per ASM 7.54¢ 7.73¢ (2.5)% 31,580 29,274 Employees at yearend 7.9% *Excludes cumulative effect of change in accounting principle of $22.1 million ($.03 per share) Southwest Airlines Co. is the nation’s low-fare, high Customer Satisfaction airline. We primarily serve shorthaul city pairs, providing single-class air transportation which targets the business commuter as well as leisure travelers. The Company, incorporated in Texas, commenced Customer Service on June 18, 1971, with three Boeing 737 aircraft serving three Texas cities — Dallas, Houston, and San Antonio. At yearend 2001, Southwest operated 355 Boeing 737 aircraft and provided service to 59 airports in 30 states throughout the United States. Southwest has one of the lowest operating cost structures in the domestic airline industry and consistently offers the lowest and simplest fares. Southwest also has one of the best overall Customer Service records. LUV is our stock exchange symbol, selected to represent our home at Dallas Love Field, as well as the theme of our Employee and Customer relationships.
  • 2. 2 S O U T H W E S T A I R L I N E S C O. 2 0 0 1 A N N UA L R E P O RT TO OUR SHAREHOLDERS: February 1, 2002 “Are you guys ready? Okay. Let’s roll.” – Todd Beamer These heroic words, flung into the macabre face of impending tragedy, were a luminous reflection of the iron character, unquenchable spirit, and inspiring altruism of a noble team leader and player. Todd Beamer’s words and actions, in the scarifying context of the horrific events of September 11, helped to galvanize America into a state of “terrible, swift resolve.” The airline industry was shut down on September 11 — and many of our planes, crews, and Customers were required to land, and thereafter stay, in unintended places. Communicating with, and taking care of, those Customers, crews, and aircraft, as well as passengers reserved on flights cancelled, was a herculean task. As the passenger carriers resumed service, reuniting planes and crews “legal to fly” into a coherent passenger schedule was another hugely complex and enormously difficult undertaking. And the FAA and the DOT, reacting swiftly and well to the crisis, were engaged in the process of issuing a veritable cascade of new Security Directives profoundly changing the manner in which Customers, luggage, and airplanes were protected and cleared for flight, thus compelling probably 1,000,000 airline employees to learn, and apply, new security procedures on a daily and, sometimes, hourly basis. Meanwhile, much of our industry was simultaneously and furiously absorbed in: (i) borrowing as much cash as quickly as it could; (ii) deferring or canceling scheduled new aircraft deliveries; (iii) determining how many flights it should cut and how many employees it should lay off, furlough, or put on unpaid leave; (iv) speculating how low its fares might have to be in order to induce passengers to fly, in the aftermath of a devastating terrorist attack occurring in the midst of a recession; and (v) pondering the imponderables of: (a) what new business models it might adopt in radically changed circumstances; (b) the vagaries of Chapter 11 proceedings; and (c) how long its tenuous future might be. For the airline industry, this was not merely Dante’s purgatory. It was, indeed, Dante’s pure “hell,” created in one amazing and tragic day. Southwest was well poised, financially, to withstand the potentially devastating hammer blow of September 11. Why? Because for several decades our leadership philosophy has been: we manage in good times so that our Company, and our People, can be job secure and prosper through bad times. This philosophy served our People and our Company well during the holocaustic economic catastrophe that afflicted the airline industry from 1990 – 94, when the industry, as a totality, lost a cumulative $13 billion and furloughed approximately 120,000 of its employees, while, during that same 1990 – 94 period, Southwest remained 100 percent job secure and produced profits and Profitsharing for our Employees and Shareholders. Once again, after September 11, our philosophy of managing in good times so as to do well in bad times proved a marvelous prophylactic for our Employees and our Shareholders: 1. On September 11, Southwest had $1.0 billion in cash and cash equivalents on hand, enabling us to withstand the severe cash flow drain suffered by all passenger airlines upon recommencement of air service post September 11. Liquidity is good, not bad! 2. On September 11, Southwest had the strongest balance sheet and the highest credit ratings in the American airline industry. As a consequence, we were able to quickly borrow, at reasonable rates, $1.1 billion in order to ensure that we had enough cash on hand to pay our bills; pay our Employees; fund our Employee Profitsharing commitments; make contractually obligated capital expenditures; and guarantee the longevity of our Company and, thus, of our People’s livelihoods. A conservative balance sheet and high credit ratings are good, not bad! 3. On September 11, Southwest had the lowest cost per Available Seat Mile (ASM) flown of any major passenger air carrier. In the sparse ridership, very low-fare airline industry environment subsequent to September 11, our low costs enabled us to compete effectively by offering extremely low fares, while simultaneously reestablishing a positive cash flow (more cash coming in than going out) and, ultimately, even fourth quarter 2001 profitability. Low costs for producing an ASM are good, not bad! On September 11, our Company had the financial wherewithal to withstand and overcome the dire economic emergency with which it, and our nation, were threatened. But what about our Southwest People, as a whole? How would they respond in an atmosphere of incredulity, fear, sadness, uncertainty, and grave economic jeopardy for themselves and their Company? Here is how they responded: “Are you guys ready? Okay. LET’S ROLL.” While still grieving over the events and losses of September 11, our People returned to work with tears in their eyes but resolve in their hearts. They speedily reassembled our airline, after it had been shut down, and got it flowing smoothly again. In a national and Company emergency, they put aside petty complaints and miniscule concerns and both learned, and endured, the multitude of complicated new security measures and procedures mandated by our federal government. And despite the stress and strain of the post September 11 airline industry environment, they smiled, and cared, for their internal and external Customers, while providing superb Customer Service in their usual spirited, joyful, open, warm-hearted, and humanitarian way.
  • 3. 3 S O U T H W E S T A I R L I N E S C O. 2 0 0 1 A N N UA L R E P O RT The combination of farsighted, rather than nearsighted, Company philosophies and policies and of the Southwest People, who are strong, resolved, dedicated, empathetic, resilient, and also farsighted, rather than nearsighted, in their thoughts and actions, brought about the following proud results for Southwest in the post September 11 period: 1. Southwest operated 100 percent of its aircraft capacity and provided 100 percent job security, with no loss of pay for its People from layoffs, furloughs, or unpaid leaves and with no fear by its People of having to reduce their pay or benefits; 2. Southwest was able to fund its year 2000 Employee Profitsharing and fourth quarter 2001 Employee savings plan obligations in the amount of $197.5 million; 3. Southwest inaugurated service to Southern Virginia through Norfolk; 4. Southwest announced additional nonstop service between the following cities, utilizing two previously deferred new aircraft deliveries: Baltimore/Washington to Manchester, Orlando, and Ft. Lauderdale; and Long Island/Islip to Orlando and Ft. Lauderdale; 5. Southwest prepared to implement its first nonstop flights between Chicago’s Midway Airport and both Seattle and Oakland, utilizing four previously deferred new aircraft deliveries; 6. Year over year, Southwest’s fourth quarter 2001 ASM capacity increased by 6.4 percent; 7. Southwest’s Revenue Passenger Mile (RPM) share of the U.S. domestic air passenger market increased by about 2.0 percent in fourth quarter 2001; 8. Excluding fuel costs (which dropped) and despite greatly increased expenses for added security measures and insurance coverage, Southwest reduced its fourth quarter operating expenses per ASM by 2.5 percent; 9. Southwest reported a profit of $511.1 million for the year 2001 (including federal grants and special charges) or $412.9 million (excluding federal grants, special charges, and their related effects), and amended its Profitsharing Plan in order to pay all of its qualified Employees Profitsharing calculated on the higher ($511.1 million), rather than the lower ($412.9 million), profit figure; 10. Southwest actually reported a profit of $63.5 million for fourth quarter 2001 (including federal grants and special charges) or $32.4 million (excluding federal grants, special charges, and their related effects); and 11. Based upon all of the above occurrences and the market’s concomitant faith in a prosperous future for Southwest Airlines, the price of our stock rose, rather than fell, subsequent to September 11. Including federal grants and special charges, our annual net income declined 18.2 percent to $511.1 million in 2001 (before the cumulative effect of a change in accounting principle in 2000), and excluding such grants, charges, and their related effects, our net income declined 34.0 percent to $412.9 million. Seldom does such a significant decline in earnings provide cause for rejoicing on the part of Employees and Shareholders, but, in the case of 2001, it both does and should. Including federal grants and special charges, the other major carriers lost a cumulative total of $7.8 billion in all of 2001 and a cumulative total of $3.3 billion in fourth quarter 2001 alone, reputedly also “furloughing” up to 100,000 employees without pay. The year 2002 will, in the words of Winston Churchill, demand the expenditure of “blood, toil, tears, and sweat” as our airline and our nation endeavor to recover from the heartrending catastrophe of September 11, which also deepened an already existing domestic economic recession and resulted in the imposition of additional security costs upon our industry as well as enhanced airport processing time upon our industry’s Customers. We are prepared, and our valorous, good-hearted, and united People are determined that, together, as one, we shall overcome any obstacle and conquer every adversity, and that our magnificent Canyon Blue Boeings will fly at the forefront of our industry as it recovers from the ravages of 2001. For 2002, our wonderful People’s brave hearts will be both informed and inspired by Todd Beamer’s brave words — and his devotion to the concept of duty with honor: “LET’S ROLL.” Most sincerely, Herbert D. Kelleher Colleen C. Barrett James F. Parker Chairman of the Board President and Vice Chairman of the Board Chief Operating Officer and Chief Executive Officer
  • 4. 4 S O U T H W E S T A I R L I N E S C O. 2 0 0 1 A N N UA L R E P O RT BE PREPARED! This motto is a governing principle of Southwest Airlines. The way we put it is this: We manage in good times so that our Employees (many of whom are our Shareholders) and our Shareholders (many of whom are our Employees) will do well in bad times. Throughout the Arab oil embargo of 1973 and its aftereffects, the sharp spike in jet fuel prices in 1979 – 1980, the recession of the early 1980s, the airline industry “depression” of 1990 – 1994, and the recession and terrorist-plagued year of 2001: 1. Southwest has provided total job security, with no unpaid furloughs or reductions in pay and benefits, for its Employees; 2. Southwest has expanded its fleet and the amount of service it provides, furnishing new jobs for new hires and enhanced seniority and the opportunity to move both around and up to its existing Employees; 3. Southwest has provided Profitsharing and funded 401(k) plans for its Employees; and 4. Southwest’s earnings have consistently followed a rising trend, propelling our stock price and total market value upward for the benefit of our Shareholders (many of whom are our Employees). The airline business is capital intensive (e.g., year 2001 Southwest expenditures for equipment and property — $1.0 billion); fuel intensive (e.g., year 2001 Southwest expenses for fuel and oil — $770 million); People intensive (e.g., year 2001 Southwest expenses for salaries, wages, and benefits — $1.9 billion); and intensely cyclical (e.g., airline industry losses 1990 – 1994 — $13.0 billion; airline industry loss 2001 — $7.3 billion, after receipt of government grants). It is widely stated that in the 98 years since the Wright brothers flew their first flight, the commercial passenger airline industry has, in the aggregate, produced a net loss, rather than a net profit. During that same 98-year period, innumerable airlines have ceased operations and perished, causing millions of people to lose their jobs. In a business long noted among analysts and economists for its financial misfortunes and frequent vicissitudes, Southwest, which flew its first full year in 1972, has achieved: 1. Twenty-nine consecutive years of profitability and Profitsharing, while expanding our ASMs flown by 24,651 percent (a record unmatched in the history of the airline industry); 2. Thirty consecutive years of 100 percent job security while the number of our Employees has grown from 183 to 31,580 (a record unmatched in the history of the airline industry); 3. An increase in the market value of our stock (of which our Employees, as a group, are the largest owners) of 138,656 percent (a record unmatched in the history of the airline industry); and 4. Year in and year out, the best Customer Satisfaction statistics (a record unmatched in the history of the airline industry). How was Southwest able to achieve these admirable and unprecedented airline industry records for the benefit of our People (many of whom are our Shareholders), our Shareholders (many of whom are our People), and the American public? By adhering to the motto: BE PREPARED! On September 11, Southwest had the lowest cost per available seat mile of any of the major air carriers; the strongest balance sheet in the American airline industry; plenty of cash on hand; ample credit available; and the strongest, most resilient, adaptable, united, Customer-focused, and willing Employees in the airline industry. Southwest was prepared and, once again, that preparedness protected our Employees’ jobs, livelihoods, benefits, and Profitsharing; that preparedness protected the investments of our Shareholders (including Employee Shareholders) in Southwest’s stock; and that preparedness protected the American traveler as Southwest continued to operate 100 percent of its flights post September 11. Economic crises in the American airline industry occur at least once per decade. They always have and they always will. The analysts and the economists are correct — the airline business, as a whole, is fraught with economic peril. It always has been, and it always will be. Southwest has surmounted each such crisis during the past 30 years by being prepared for it. We pledge to our Employees and to our Shareholders that, for their benefit, their continued wellbeing, and their secure, prosperous futures, we will always: BE PREPARED!
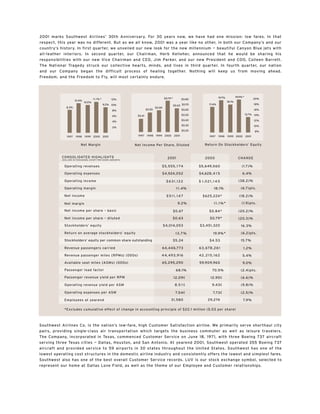
  • 5. 5 S O U T H W E S T A I R L I N E S C O. 2 0 0 1 A N N UA L R E P O RT LOW-FARE COMMITMENT. America’s freedom was threatened on September 11, 2001. However, Southwest’s resolve to Keep America Flying has not changed. We have been successful over the past 30 years because we have not strayed from our commitment to offer affordable fares and high-quality Customer Service. Southwest provides 90 percent of the low-fare competition in the U.S. and our fares are consistently the lowest and simplest in the domestic airline industry. We keep our fares low which, in turn, gives our Customers the Freedom to Fly. We have been profitable for 29 consecutive years and were the only U.S. major carrier to post a profit, with or without the federal grant, during the fourth quarter 2001 and for the full year 2001. We have a proven and flexible business model, which allows us to generate ample profits even though we offer low fares. Of course, the secret is low costs, and the key ingredients to our low-cost formula are our unique operating strategy and our amazing Culture. Southwest has been able to continually achieve the highest productivity of any major U.S. airline, and, therefore, the lowest cost of any major U.S. airline. One of the primary reasons for our productivity advantage is our dedication to the low-fare, point-to- point market niche. This market focus allows us to operate a single aircraft type, the Boeing 737, which significantly simplifies scheduling, operations, and maintenance and, thus, minimizes costs. Southwest also has a very effective and efficient distribution system with over 45 percent of our revenue currently being generated through our award-winning web site at southwest.com. Our web site is easy to use and provides one-stop travel convenience for our Customers. Over 85 percent of our seats sold in 2001 were Ticketless, which eliminates significant processing costs. We offer the most generous frequent flyer program, which was designed to reward our Customers based on trips rather than miles. After purchasing and flying only eight roundtrips on Southwest, Customers receive a roundtrip ticket, good for travel anywhere on our system for up to a year. We schedule our aircraft on a point-to-point, not hub-and spoke, basis and focus on local, not through or connecting, traffic. As a result, over 70 percent of our Customers fly nonstop. Our point-to-point route system, as compared to hub-and-spoke, provides for more direct nonstop routings for our Customers and, therefore, minimizes stops, connections, delays and total trip time. We serve many conveniently located satellite or downtown airports such as Baltimore/Washington, Chicago Midway, Dallas Love Field, Houston Hobby, Long Island/Islip, Oakland, and Providence. Although we have successful operations at major hub airports such as Los Angeles (LAX), we prefer, if possible, to avoid congested hub airports, which enhances our ability to sustain high productivity and reliable ontime performance. We schedule our aircraft to minimize the amount of time at the gate, which is why we continually achieve the highest aircraft utilization and Employee productivity of any major U.S. airline. Because our aircraft are generally at the gate less than 25 minutes, we require fewer aircraft and gate facilities than otherwise would be needed. Although we have experienced higher costs in certain areas due to the events of September 11, we managed to achieve our low-cost objective in fourth quarter 2001 through lower fuel costs and our companywide cost reduction efforts. Among other things, Southwest recently changed its travel agency policy to pay commissions of five percent (with no cap). Although lower fuel costs contributed to our decline in unit costs for both fourth quarter and full year 2001, our Employees also reduced our unit costs, excluding fuel, by 2.5 percent in fourth quarter 2001, despite significant increases in security and insurance costs. This is a remarkable feat for our Employees and a testament to our desire to keep fares low and America Flying. $625* 75% $600 70 44,494 50,000 70.5% 64.4 $511 63.7 42,215 69.0% $474 68.1% 70% $500 60 $433 57.5 40,000 36,479 66.1% 52.6 31,419 63.7% 65% $400 50.4 $318 28,355 50 30,000 60% $300 40 20,000 55% $200 30 50% 10,000 $100 45% 20 1997 1998 1999 2000 2001 1997 1998 1999 2000 2001 1997 1998 1999 2000 2001 1997 1998 1999 2000 2001 Revenue Passengers Carried Passenger Load Factor Net Income Revenue Passenger Miles ( in millions) ( in millions) ( in millions) *Excludes cumulative effect of change in accounting principle of $22.1 million ($.03 per share)
  • 6. 6 S O U T H W E S T A I R L I N E S C O. 2 0 0 1 A N N UA L R E P O RT Although enhanced security measures have not diminished our aircraft productivity or ontime performance, they have resulted in longer checkin lines, at times, for our Customers. We understand how important convenience is to all of our Customers and we have been working tirelessly to reduce wait times. We have made significant facility changes (where possible); have added new screening devices; and are hiring Employees to help our Customers with the new security procedures. As a result, we have been able to streamline Customer processing and have already seen a reduction in Customer lines. Although this remains a challenge, we are committed to meeting the challenge as we continue to explore new methods and technology that will, hopefully, continue this positive trend. We will also work diligently with the federal government as it begins assuming responsibility for airport security on February 17, 2002. Although this change will undoubtedly present new challenges, Southwest has demonstrated that our Employees are adaptable to change and our business strategy is flexible under difficult operating conditions. Following September 11, our Employees quickly restored operations, operating our normal full schedule of approximately 2,800 daily flights with exceptional ontime performance and reliability. For the year 2001, Southwest had the best Ontime Performance and Highest Customer Satisfaction record of all major airlines, based on statistics published in Department of Transportation consumer reports. Our business strategy has served us well during what has been the most difficult period in airline history. And while we are proud of our progress since September 11, we will continue to work hard to improve Customer convenience and maintain our low costs so that we can continue to bring the Freedom to Fly to America for many generations to come. MOVING AHEAD. As we, along with our nation, continue to recover from September 11, we are prepared to move ahead. We took a number of significant steps immediately following the terrorist attacks to stabilize cash and protect our strong financial position. As a result of the extraordinary efforts of our Employees, we quickly restored operations with exceptional ontime performance and reliability. Although demand for air travel dramatically declined following the terrorist attacks, we chose not to reduce our total flights or postpone our new Norfolk, Virginia, service. This decision protected our 30-year history of complete job security for our Employees and now places Southwest in a competitively strong position as we move ahead. To preserve cash following the terrorist attacks, we temporarily deferred placing new aircraft deliveries into service, and with The Boeing Company’s greatly appreciated cooperation, we arranged for a preferred new aircraft delivery schedule (as set forth in the accompanying table). Although we are still in a recovery mode, we believe our overall performance has been strong enough to begin cautiously resuming our growth plans. In February, we will add flights between the following cities, utilizing two previously deferred aircraft deliveries: Baltimore/Washington to Manchester, Orlando, and Ft. Lauderdale; and Long Island/Islip to Orlando and Ft. Lauderdale. In addition, we accelerated delivery of four more previously deferred aircraft into March and April to initiate our first nonstop flights between Chicago’s Midway Airport and both Seattle and Oakland. We will also add an additional flight between Chicago Midway and Phoenix in March. 11:18 400 11:20 355 Type 2002 2003 2004 2005 2006 2007 2008 2009-2012 Total 344 312 280 11:15 300 21 23 24 22 25 6 – Firm Orders 11 132 261 11:12 11:10 11:10 11:10 11:09 – – 13 20 20 9 25 – Options 87 200 11:05 Purchase Rights 20 20 177 217 – – – – – 100 21 36 44 42 54 51 177 436 Total 11 11:00 1997 1998 1999 2000 2001 1997 1998 1999 2000 2001 Boeing 737-700 Firm Orders and Options Aircraft Utilization Fleet Size ( hours and minutes per day) (at yearend )
  • 7. 7 S O U T H W E S T A I R L I N E S C O. 2 0 0 1 A N N UA L R E P O RT Including these six aircraft, we will have accepted delivery of nine of the 11 737-700 aircraft scheduled for delivery in 2002. We will retire three older 737-200s in 2002, which results in a minimum capacity increase of 3.5 percent for the year. In total, the number of firm orders, purchase rights, and options, through 2012, of 436 (including 2002) remains unchanged from pre-September 11. Also we have the flexibility to accelerate delivery of up to eight of the 2003 deliveries into 2002. As we phase out our older 737-200 aircraft from our all-Boeing 737 fleet, we plan to retire the remaining 27 -200s by the end of 2005. All of our new Boeing 737s will be delivered in our new “Canyon Blue” exterior color scheme and “Saddle Tan” all-leather seating configuration to symbolize our renewed 30-year commitment to provide the Freedom to Fly to America. As the economy recovers and America continues to return to the skies, we are well-positioned both competitively and financially to take advantage of growth opportunities as they arise. At yearend, we served 58 cities (59 airports) in 30 states and provided less than ten percent of total domestic capacity. Due to the devastating events of September 11, we do not currently plan to add any new cities to our route system for 2002. However, as the economy recovers and overall air travel demand returns, we believe there will be ample opportunities to add new markets over the longer term. In addition, we continue to have numerous expansion opportunities within our current route system, which now spans from coast to coast. In fact, for the past several years, roughly 75 percent of our aircraft additions were deployed in our existing system by adding frequencies between markets already served and by providing new nonstop service in existing markets. Our capacity is spread throughout the U.S., with 45 percent in the West; 27 percent in the East; 15 percent in the Midwest; and 13 percent in the Heartland region (Texas and surrounding states). As a result, we have a diverse revenue base, with an average of 47 departures per airport. Our low fares generate substantial demand, which allows us to offer lots of convenient flights. For example, our top ten cities’ daily departures are currently Phoenix, 183; Las Vegas, 170; Houston Hobby, 143; Baltimore/Washington, 134; Dallas Love Field, 131; Oakland, 120; Chicago Midway, 119; Los Angeles (LAX), 114; Nashville, 87; and San Diego, 77. While our new city focus over the past few years has been in the eastern region of the U.S., we have numerous expansion opportunities in our more mature regions, as evidenced by our upcoming additions from Chicago’s Midway Airport. As a result of the combination of our low fares, high frequencies, convenience, and high-quality Customer Service, Southwest tends to dominate the majority of the markets it serves. Southwest consistently ranks first in market share in approximately 80 to 90 percent of our top 100 city pairs and, in the aggregate, holds 60 to 65 percent of total market share in those markets. Based on the most recent second quarter 2001 Department of Transportation data available, Southwest held 73 percent of the total intra-Texas market; intra-California, 59 percent; intra-Florida, 52 percent; Baltimore, 36 percent; Las Vegas, 34 percent; and Phoenix, 33 percent. Southwest also carries the most passengers in the top 100 U.S. markets despite serving only 42 of them. While the economic impact of September 11 was devastating for the airline industry as a whole, Southwest was financially well- prepared and is able to move ahead from a relative position of strength. Our commitment to bring low fares to people across America is stronger than ever and numerous opportunities to accelerate our growth currently exist. We will add incremental aircraft capacity in a manner that does not jeopardize our financial stability and safety, nor impair our excellent Customer Service record. 2,800 9.43¢ 2,800 $5,650 $6,000 9.5¢ 7.9¢ $5,555 2,700 7.73¢ $4,736 8.96¢ $5,000 9.0¢ 7.7¢ 2,550 2,600 $4,164 8.76¢ 7.54¢ 8.51¢ 8.58¢ $3,817 $4,000 7.48¢ 8.5¢ 7.5¢ 7.40¢ 7.32¢ 2,334 2,400 $3,000 8.0¢ 7.3¢ 2,268 $2,000 2,200 7.5¢ 7.1¢ $1,000 2,000 7.0¢ 7.0¢ 1997 1998 1999 2000 2001 1997 1998 1999 2000 2001 1997 1998 1999 2000 2001 1997 1998 1999 2000 2001 Operating Revenues Operating Expenses Operating Revenue Average Daily Departures Per Available Seat Mile Per Available Seat Mile ( in millions)
  • 8. Seattle/Tacoma Spokane Portland Manchester (Boston Area) Buffalo/ Boise Niagara Falls Providence Albany (Boston Area) Hartford/Springfield Detroit Long Island/Islip Chicago Reno/Tahoe Cleveland (Midway) Sacramento Omaha Salt Lake City Baltimore/ Washington (BWI) Oakland Columbus (San Francisco Area) (D.C. Area) Kansas City Indianapolis San Jose (San Francisco Area) Norfolk (Southern Virginia) Louisville St. Louis Las Vegas Raleigh-Durham Tulsa Nashville Burbank Albuquerque (Santa Fe Area) Little Rock Los Angeles (LAX) Ontario Amarillo (Palm Springs Area) Orange County Oklahoma City Phoenix San Diego Lubbock Birmingham Tucson Dallas Jackson El Paso Midland/ (Love Field) Odessa Jacksonville Austin New Orleans San Antonio Orlando Houston Tampa Bay (Hobby & Intercontinental) Corpus West Palm Beach Christi Ft. Lauderdale Southwest System Map (Miami Area) Harlingen/South Padre Island California 18% East 27% Southwest Other Carriers 64% 36% Remaining West 27% Midwest 15% Heartland 13% Southwest’s Market Share Southwest’s Capacity By Region Southwest's top 100 city-pair markets 200 Southwest’s Top Ten Airports 183 Daily Departures 175 170 143 150 134 131 125 Baltimore/Washington 120 119 114 87 100 77 Chicago Midway Houston Hobby Los Angeles Dallas Love 75 Las Vegas San Diego Nashville Oakland Phoenix 50
  • 9. S O U T H W E S T A I R L I N E S C O. 2 0 0 1 A N N UA L R E P O RT FINANCIAL REVIEW Management’s Discussion and Analysis F2 Consolidated Financial Statements F8 Notes to Consolidated Financial Statements F12 Report of Independent Auditors F20 Quarterly Financial Data F21 Common Stock Price Ranges and Dividends F21 Ten-Year Summary F22 Corporate Data F24 Directors and Officers F24
  • 10. F2 S O U T H W E S T A I R L I N E S C O. 2 0 0 1 A N N UA L R E P O RT MANAGEMENT’S DISCUSSION AND ANALYSIS OF Currently, available seat mile (ASM) capacity is expected to grow FINANCIAL CONDITION AND RESULTS OF OPERATIONS approximately 3.5 percent in 2002 with the planned net addition of at least eight aircraft. The Company will place in service at least 11 new YEAR IN REVIEW Boeing 737-700s scheduled for delivery during the year and will retire In 2001, Southwest posted a profit for the 29th consecutive year in three of the Company’s older 737-200s. (The immediately preceding one of the most challenging operating environments the air travel sentences are forward-looking statements that involve uncertainties that industry has ever faced. During the year, Southwest also increased our could result in actual results differing materially from expected results. domestic market share, made enhancements that will improve our Some significant factors include, but may not be limited to, future Customer Service, and ended the year with more Employees and aircraft capacity decisions made by the Company, demand for air travel, than we had when we began the year. Despite the onset of a recession changes in the Company’s aircraft retirement schedule, etc.) early in 2001 and the September 11, 2001, terrorist attacks against the RESULTS OF OPERATIONS United States (the terrorist attacks), Southwest was profitable in each 2001 COMPARED WITH 2000 The Company’s consolidated net quarter of the year, including the third and fourth quarters after income for 2001 was $511.1 million ($.63 per share, diluted), as compared excluding federal grants recognized in these quarters under the Air to 2000 net income, before the cumulative effect of change in Transportation Safety and System Stabilization Act (the Act). (See accounting principle, of $625.2 million ($.79 per share, diluted), a Note 3 to the Consolidated Financial Statements for further details on decrease of 18.2 percent. The prior years’ net income per share the terrorist attacks and the Act.) Although we were unable to match amounts have been restated for the 2001 three-for-two stock split (see some of the Company’s record-setting performance levels reached in Note 11 to the Consolidated Financial Statements). Consolidated results 2000, our business strategy — primarily shorthaul, high frequency, low-fare, for 2001 included $235 million in gains that the Company recognized point-to-point, high-quality Customer Service — continued to serve us from grants under the Act and special pre-tax charges of approximately well during some difficult times in 2001. $48 million arising from the terrorist attacks (see Note 3 to the In 2001, we continued to maintain our cost advantage over our Consolidated Financial Statements). Excluding the grant and special industry while the recession and events of September 11 put downward charges related to the terrorist attacks, net income for 2001 was pressure on revenues. In response to uncertainties following $412.9 million ($.51 per share, diluted). The cumulative effect of September 11 and the precipitous drop in demand for air travel, change in accounting principle for 2000 was $22.1 million, net of taxes Southwest amended its agreement with The Boeing Company to defer of $14.0 million (see Note 2 to the Consolidated Financial Statements). aircraft deliveries (see Note 4 to the Consolidated Financial Net income and net income per share, diluted, after the cumulative Statements) but did not ground airplanes, reduce service, or furlough change in accounting principle, for 2000 were $603.1 million and $.76, Employees. Following the temporary FAA shutdown of U.S. air space respectively. Operating income for 2001 was $631.1 million, a decrease after the terrorist attacks, load factors have steadily improved to of 38.2 percent compared to 2000. somewhat normal, average historical levels. However, these load factors Following the terrorist attacks, all U.S. commercial flight operations have resulted from significant fare discounting, which continues to were suspended for approximately three days. However, the Company result in year-over-year declines in passenger revenue yields per RPM continued to incur nearly all of its normal operating expenses (with the (passenger yields) and operating revenue yields per ASM. exception of certain direct trip-related expenditures such as fuel, landing As we begin 2002, in addition to the difficult revenue environment for fees, etc.). The Company cancelled approximately 9,000 flights before commercial airlines, the Company is faced with increased war risk insurance resuming flight operations on September 14, although we did not and passenger security costs resulting from continually evolving security resume our normal pre-September 11 flight schedule until September 18, laws and directives. In response to the terrorist attacks, the airline 2001. Once the Company did resume operations, load factors and industry has worked diligently with Congress, the DOT, the FAA, and passenger yields were severely impacted, and ticket refund activity law enforcement officials to enhance security. During fourth quarter increased. The Company estimates that from September 11 through 2001, the Company was able to offset these additional costs because of September 30, it incurred operating losses in excess of $130 million. lower jet fuel prices and through internal cost reduction initiatives The effects of the terrorist attacks continued to be felt throughout implemented following the terrorist attacks. However, there can be no fourth quarter 2001. The Company’s operating income during fourth quarter assurance the Company will be able to continue to offset future cost 2001 was $37.1 million, a decrease of 85.2 percent compared to fourth increases resulting from the changing commercial airline environment. quarter 2000. Without consideration of any federal grant under the Act (The immediately preceding sentence is a forward-looking statement the Company expects to recognize (see Note 3 to the Consolidated that involves uncertainties that could result in actual results differing Financial Statements), it is not yet known whether the Company will be materially from expected results. Some significant factors include, but profitable in first quarter 2002, due to uncertain economic conditions may not be limited to, additional laws or directives that could increase and the difficult airline industry revenue environment. the Company’s costs or result in changes to the Company’s operations, etc.) During 2001, we began service to two new cities, West Palm Beach, OPERATING REVENUES Consolidated operating revenues decreased Florida, and Norfolk, Virginia, while also discontinuing service to San 1.7 percent primarily due to a 1.6 percent decrease in passenger Francisco International Airport due to airport congestion. We have revenues. The decrease in passenger revenues was a direct result of the been pleased with the initial results in both of the new Southwest terrorist attacks. Because of the terrorist attacks, fluctuations in cities. Prior to September 11, the Company also continued to add flights passenger revenue can best be explained by discussing the year in two between cities already served. Southwest ended 2001 serving 58 cities in distinct time periods: January through August 2001, and September 30 states. Immediately following the terrorist attacks, Southwest suspended through December 2001. fleet growth. However, by the end of the year, Southwest had From January through August 2001, passenger revenues were announced plans for modest growth to resume in early 2002. approximately 8.7 percent higher than the same period in 2000 due
  • 11. F3 S O U T H W E S T A I R L I N E S C O. 2 0 0 1 A N N UA L R E P O RT primarily to an increase in capacity, as measured by ASMs, of 11.6 percent. Operating expenses per ASM for 2001 and 2000 were as follows: The capacity increase was due to the addition of 14 aircraft during OPERATING EXPENSES PER ASM 2001 (all prior to September 11) and was partially offset by a decrease of 1.9 percent in passenger yield. Passenger yields decreased as a INCREASE PERCENT 2001 2000 (DECREASE) CHANGE result of fare discounting by the Company and the airline industry in general as the United States economy weakened throughout the year. The Company’s Salaries, wages, load factor (RPMs divided by ASMs) over this time period was 71.2 percent, and benefits 2.51¢ 2.41¢ .10¢ 4.1% compared to 71.7 percent for the same period in 2000. From September through December 2001, passenger revenues were Employee retirement approximately 21.7 percent lower than the same period of 2000. Capacity plans .33 .40 (.07) ( 17.5) increased 4.0 percent and the Company’s load factor fell to 62.0 percent, Fuel and oil 1.18 1.34 (.16) ( 1 1.9) compared to 68.2 percent during the same period of 2000. Passenger yields were 17.2 percent lower during this period versus the same period Maintenance materials of 2000 due to aggressive fare sales following the terrorist attacks. and repairs .61 .63 (.02) ( 3.2) For the full year, the Company experienced a 1.2 percent increase in Agency commissions .16 .27 (. 1 1) (40.7) revenue passengers carried, a 5.4 percent increase in revenue passenger miles (RPMs), and a 9.0 percent increase in ASMs. The Company’s load Aircraft rentals .29 .33 (.04) (12.1 ) factor for 2001 was off 2.4 points to 68.1 percent and there was a 6.6 percent Landing fees and decrease in 2001 passenger yield. other rentals .48 .44 .04 9.1 Load factors in January 2002 continued to trail those experienced in January 2001. Additionally, passenger yields remain significantly Depreciation .49 .47 .02 4.3 below prior year levels. As a result, the Company expects first quarter 2002 Other 1.49 1.44 .05 3.5 revenue per available seat mile to continue to fall below first quarter 2001 levels. (The immediately preceding sentence is a forward-looking Total 7.54¢ 7.73¢ (.19)¢ (2.5)% statement, which involves uncertainties that could result in actual Approximately 59 percent of the increase in Salaries, wages, and results differing materially from expected results. Some significant factors benefits per ASM was due to increases in salaries and wages from higher include, but may not be limited to, additional incidents that could cause the average wage rates within certain workgroups and increased headcount public to question the safety and/or efficiency of air travel, competitive due, in part, to the increased security requirements following the pressure such as fare sales and capacity changes by other carriers, general September terrorist attacks. The remaining 41 percent of the increase economic conditions, operational disruptions as a result of bad weather, in Salaries, wages, and benefits per ASM was due to higher benefits the impact of labor issues, and variations in advance booking trends.) costs, primarily health care. See Note 1 to the Consolidated Financial Statements for further The Company’s Ramp, Operations, and Provisioning Agents are subject information on the Company’s revenue recognition policy. to an agreement with the Transport Workers Union of America (TWU), As a result of weak economic conditions throughout 2001, consolidated which became amendable in December 2000. The Company reached an freight revenues decreased 17.6 percent. There were decreases in both agreement with the TWU, which was ratified by its membership in June the number of freight shipments and revenue per shipment. Following 2001. The new contract becomes amendable in June 2006. the September 11, 2001, terrorist attacks, the United States Postal The Company’s Mechanics are subject to an agreement with the Service made the decision to shift a portion of the mail that commercial International Brotherhood of Teamsters (the Teamsters), which became carriers had previously carried to freight carriers. As a result of this amendable in August 2001. Southwest is currently in negotiations with decision, the Company expects to experience a decrease in freight the Teamsters for a new contract. revenues during at least the first half of 2002 when compared to 2001. The Company’s Flight Attendants are subject to an agreement with (The immediately preceding sentence is a forward-looking statement, the TWU, which becomes amendable in June 2002. The Company’s which involves uncertainties that could result in actual results differing Customer Service and Reservations Agents are subject to an agreement materially from expected results. Some significant factors include, but with the International Association of Machinists and Aerospace may not be limited to, general economic conditions, subsequent shifts Workers, which becomes amendable in November 2002. in business by the United States Postal Service, and capacity changes Employee retirement plans expense per ASM decreased 17.5 percent, by other carriers.) Other revenues increased 20.3 percent primarily due primarily due to the decrease in Company earnings available for to an increase in commissions earned from programs the Company profitsharing. The decrease in earnings more than offset an increase in sponsors with certain business partners, such as the Company-sponsored expense due to a fourth quarter amendment made to the Company’s First USA Visa card. profitsharing plan. This amendment enabled the Company to take into consideration federal grants under the Act and special charges resulting OPERATING EXPENSES Consolidated operating expenses for 2001 from the terrorist attacks in the calculation of profitsharing. increased 6.4 percent, compared to the 9.0 percent increase in capacity. Fuel and oil expense per ASM decreased 11.9 percent, primarily due Operating expenses per ASM decreased 2.5 percent to $.0754, to a 10.0 percent decrease in the average jet fuel cost per gallon. The compared to $.0773 in 2000, primarily due to a decrease in average jet average cost per gallon of jet fuel in 2001 was $.7086 compared to fuel prices. The average fuel cost per gallon in 2001 was $.7086, 10.0 $.7869 in 2000, including the effects of hedging activities. The percent lower than the average cost per gallon in 2000 of $.7869. Company’s 2001 and 2000 average jet fuel prices are net of Excluding fuel expense, operating expenses per ASM decreased .3 percent.