Foot Locker, Inc. reported strong financial results for 2003, with total sales increasing 6.0% to $4.779 billion and operating profit margin expanding to 7.2% from 6.0%. The company saw significant growth from its international operations, particularly in Europe, and its direct-to-customer business. For 2004, Foot Locker plans to open approximately 110 new stores while remodeling over 200 existing stores, focusing on continued expansion in international markets like Europe as well as growing its e-commerce business. The company ended 2003 in a strong financial position with $112 million in cash, positioning it to take advantage of future investment and expansion opportunities.
2. FOOT LOCKER, INC.
About the Company
Foot Locker, Inc. (NYSE: FL) is the world's leading Additionally, the Company's Footlocker.com/Eastbay
retailer of athletic footwear and apparel. Headquartered business operates a rapidly growing direct-to-customers
in New York City, it operates approximately 3,600 athlet- business offering athletic footwear, apparel and equip-
ic retail stores in 16 countries in North America, Europe ment through its Internet and catalog channels.
and Australia under the brand names Foot Locker,
Lady Foot Locker, Kids Foot Locker and Champs Sports.
Athletic Stores Sales Per Average Gross Square Foot
(dollars)
2003
$335
2002
$316
2001
$306
2000
$301
1999
$282
Operating Profit Margin
(percent)
2003
7.2%
2002
6.0%
2001
4.5%
2000
4.2%
1999
-1.8%
Income from Continuing Operations
(millions)
2003
$209
2002
$162
2001
$111
2000
$107
1999
$59
ROE
(percent)
2003
16.8%
2002
15.4%
2001
11.1%
2000
10.0%
1999
5.4%
Table of Contents
Shareholders’ Letter 1 Business Overview 4 Foot Locker 5 Champs Sports 6 Lady Foot Locker/Kids Foot Locker 7 Footlocker.com/Eastbay 8
Form 10-K 9 Board of Directors, Corporate Management, Division Management, Corporate Information IBC
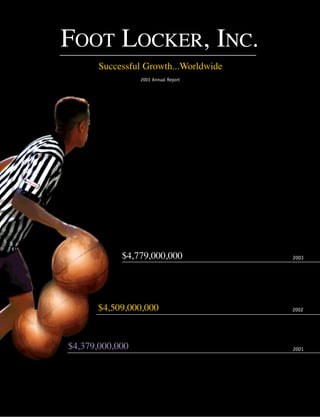
Cover image illustrates sales growth.
3. SHAREHOLDERS’ LETTER
The successful implementation of strategic initiatives
has contributed to our significantly improved profitability,
strong cash flow and solid balance sheet.
Since the commencement of the new 2003 Financial Highlights dence and a highly promotional retail
millennium, our financial results have 2003 was a significant year for us. environment. Yet, despite the overall
consistently improved on a quarter-over- We reported strong growth in earnings retailing environment, we succeeded by
quarter and year-over-year comparative and cash flow, and also better posi- differentiating our businesses from the
basis, and, I am pleased to say that in tioned ourselves to continue to report competition by identifying emerging
2003 we continued Foot Locker, Inc.’s further gains in the future. Every year is fashion trends early and working closely
strong track record of producing mean- filled with distinct challenges as well as with our suppliers to develop new and
ingful earnings growth and a further unique opportunities, and 2003 was no exclusive products for our customers.
strengthening of our financial position. exception. First, however, let’s review
Growth At Home And Abroad
Moreover, our near-term and longer-term our financial results:
The balance we are building into our
prospects are promising and we believe
• Total sales increased 6.0 percent to business model is an important factor
that we are just beginning to hit our
$4.8 billion. that has contributed to our impressive
stride.
• Operating profit margin expanded to financial performance. Namely, we are
Our significant accomplishments over 7.2 percent from 6.0 percent. growing our business both at home and
the past four years are attributable to • Earnings per share grew by 27 abroad. In fact, our most significant
the hard work and dedication of our percent to $1.40 from $1.10. sales and profit growth were generated
40,000 worldwide associates. We have • Return on equity improved to 16.8 by our stores operating in international 1
built a results-oriented culture within a percent from 15.4 percent. regions. Europe, where we currently
highly disciplined organization that is • Total cash, net of debt increased operate 427 stores, generated a 40 per-
focused on improving returns for our by $112 million. cent increase in total sales and produced
shareholders. While we are highly record profits during 2003. We have tar-
Identifying Emerging
encouraged by our recent progress, we geted this market as a significant oppor-
Fashion Trends Early
remain focused on continuing to raise tunity for profitable growth over the
As we entered 2003, our stores in the
the bar for ourselves. We are committed next several years. In total, our athletic
United States faced several unfavorable
to enhancing shareholder value by driv- store segment sales grew by 6.1 percent
trends that put pressure on comparable-
ing continued earnings per share growth and, more importantly, division profit
store sales. These trends included a
and by using the cash that we are gen- increased 30 percent.
fashion-shift to lower-priced classic
erating to both reinvest in our business
footwear, declining customer traffic in
and to pay cash dividends to our share-
shopping malls, weak consumer confi-
holders.
Financial Highlights
(Millions, except per share amounts)
2003 2002 2001
Sales $ 4,779 $ 4,509 $ 4,379
Total operating profit $ 342 $ 269 $ 197
Income from continuing operations $ 209 $ 162 $ 111
Diluted EPS from continuing operations $ 1.40 $ 1.10 $ 0.77
Cash, net of debt $ 112 $ --- $ (184)
4. Gross Square Footage
Store Summary 2003 2004
February 1, January 31, Remodeled/ Average Total Targeted
2003 Opened Closed 2004 Relocated Size Openings
(in thousands)
Foot Locker 1,477 30 59 1,448 75 4,100 5,916 33
Lady Foot Locker 606 2 24 584 105 2,200 1,303 2
Kids Foot Locker 377 — 20 357 19 2,400 863 1
Foot Locker International 583 64 7 640 10 2,800 1,823 68
Champs Sports 582 17 18 581 41 5,600 3,239 6
Total 3,625 113 128 3,610 250 3,600 13,144 110
Another source of sales and profit sales growth trend that we experienced sion into the Asia/Pacific region being
growth in 2003 was our direct-to-cus- last year. Our U.S. stores have reached explored for the longer-term. Our plans
tomers business. This business segment an inflection point, having passed the in 2004 call for growing our international
is comprised of our Footlocker.com and one-year anniversary of the trends that store base by approximately 10 percent,
Eastbay Internet and catalog channels. put pressure on our athletic footwear including the planned entrance into the
Division profit from this segment sales during the first three quarters of Republic of Ireland, Hungary and the
increased 33 percent during 2003, reach- 2003. Moreover, we believe that we will Czech Republic, each of which represents
ing $53 million, or 14.5 percent of sales. also benefit from a healthier athletic a new market for Foot Locker, Inc.
footwear and apparel retail industry,
Investment In Our Future
Growing our direct-to-customers chan-
including indications of continued con-
While 2003 was an excellent year in
nels profitably is the Company’s second
solidation of other U.S. retail athletic
terms of our financial performance, it
key strategy. This segment is the
companies.
was also a period of continued invest-
Company’s fastest growing business area,
ment in our future, from store base As we move forward, we will continue to
propelled by the explosive growth of the
growth to enhancements to our opera- be guided, first and foremost, by our
Internet for retail shopping. We plan to
2
tional and technological infrastructure. overarching goal of enhancing share-
continue to expand this business
We opened 113 new stores and remod- holder value by expanding our leadership
through internally generated initiatives
eled or relocated 250 existing stores position in the global specialty athletic
and by identifying new ventures with
during the year. We also continued to footwear and apparel retail industry.
other well-known third parties.
invest in several projects designed to Toward this goal, we are continuing to
The Company’s third key strategy is to
strengthen our sourcing, information implement our Company’s three key
enhance the profitability of its U. S.
systems and merchandise distribution ongoing strategies:
stores through several initiatives includ-
capabilities – an infrastructure which
• Open additional stores in
ing those designed to lower its occupan-
we believe is one of the most efficient
international markets.
cy rate as a percentage of sales. We are
in the retail industry. We initiated the
• Rapidly grow direct-to-customers aggressively remodeling and relocating
installation of a new state-of-the-art
channels. certain stores, opening new stores in
point of sale system in our Champs
high-volume locations, closing unprof-
Sports and Foot Locker U.S. stores, • Improve productivity of U.S.
itable units, and selectively negotiating
completed arrangements to expand our store base.
new lease arrangements. Longer-term,
European distribution center in 2004
Several existing and new international sustained profitability growth is predi-
and enhanced the productivity of our
markets have been identified for expan- cated on our ability to continue to dis-
direct-to-customers fulfillment center.
sion that we expect will provide Foot tinguish our businesses from their
Locker, Inc. with significant opportuni- competition, by providing trend-right
Continued Future Growth -
ties to grow its store base. Europe pro- products and superior customer service
2004 And Beyond
vides our most significant opportunity through convenient retail channels.
As we look forward to 2004, we are
over the near term with further expan-
very encouraged given the improving
5. The ability to operate profitably in international
markets provides our Company with geographic
diversification and exciting growth opportunities.
Matthew D. Serra
Enhanced Shareholder Value Reflecting its confidence in the commitment to our Company as a mem-
Company’s future growth and profitability, ber of our Board and as the Board’s Lead
The Company ended 2003 in a strong
towards the end of 2003 the Board of Director.
financial position, with a cash position,
Directors doubled the cash dividend on
net of debt, of $112 million. We have
common stock, raising the annual rate Finally, we value the ongoing support of
financed all of the cash requirements of
from $0.12 to $0.24 per share. our shareholders. As we mark the 30th
our worldwide store expansion of recent
anniversary of the opening of the first
years with internally generated funds,
Since we place our shareholders’ best Foot Locker store, we believe the
while also repaying debt and increasing
interests above all else, we are commit- Company’s prospects have never been
our cash balance. As a result, we cur-
ted to maintaining best practices in our brighter. Our outlook is positive and our
rently have a strong foundation to capi-
corporate governance. Toward this end, opportunities are many. As we move for-
talize, as appropriate, on incremental
our Board of Directors is committed to ward, we will continue to work hard to
investment opportunities.
the assurance that our shareholders capitalize on these opportunities for the
Capital spending of $165 million is maintain confidence in our financial benefit of all of our shareholders.
planned for 2004, to enable the reporting. Our internal auditors continu- 3
On behalf of our Board of Directors and
Company to continue its worldwide ally examine the effectiveness of our
our 40,000 associates worldwide, I thank
store expansion program and maintain controls and processes across the organ-
you for your continued support and
an efficient infrastructure. This capital ization on an ongoing basis to ensure
encouragement.
spending plan includes opening approxi- consistent and accurate financial report-
mately 110 new stores and remodeling ing. Our Audit Committee is very
Sincerely,
or relocating over 200 existing stores. involved in the review of all outside dis-
As in prior years, the total amount is closures and adherence to new require-
expected to be financed utilizing funds ments regulated by the SEC and the
generated from operations. Financial Accounting Standards Board.
Matthew D. Serra
Our Board is comprised of individuals
The management of Foot Locker, Inc. is
Chairman of the Board, President
with sterling reputations and expertise.
focused on our foremost priority:
and Chief Executive Officer
In particular this year, and on behalf
enhancing shareholder value. We measure
of the entire Board, I would like to
the accomplishment of this objective as
thank J. Carter Bacot for his valued
the increase in our common stock price
service during the past three years as
plus dividends paid to our shareholders.
Foot Locker, Inc.’s non-executive
As such, 2003 was an extraordinary year
Chairman. Mr. Bacot has been an impor-
as our stock price more than doubled,
tant advisor to management, particularly
ending the year at $24.74 per share.
in matters of corporate governance and
finance. We appreciate his continuing
6. BUSINESS OVERVIEW
Primary Customer Merchandise Mix # of Stores Average Store Size
Men’s, Women’s and Children’s Athletic
Footwear 4,100 Gross
12 to 20 Year Old Men’s Athletic Apparel and Accessories 1,448 Square Feet
14 to 35 Year Old Women’s Athletic Footwear, Apparel 2,200 Gross
Female and Accessories 584 Square Feet
Children’s Athletic Footwear, Apparel 2,400 Gross
5 to 11 Year Old and Accessories 357 Square Feet
Men’s, Women’s and Children’s
Athletic Footwear 2,800 Gross
12 to 20 Year Old Men’s Athletic Apparel and Accessories 640 Square Feet
Men’s, Women’s and Children’s Athletic
Footwear
4 Men’s Athletic Apparel and Accessories 5,600 Gross
12 to 25 Year Old Athletic Equipment 581 Square Feet
Men’s, Women’s and Children’s
12 to 35 Year Old Athletic Footwear, Apparel and Equipment
Global diversification is a vital component
of the Company's strategic positioning. This
diversification is unique in the athletic
footwear and apparel retail industry and
provides many distinct advantages. Foot
Locker, Inc. has established a strong pres-
ence in several global markets within the
United States, Canada, Europe and
168 Canadian Stores 427 European Stores
Australia.
2,826 U.S. Stores
70 Puerto Rico Stores
5 Guam Stores
8 Virgin Islands Stores
22 Hawaii Stores
79 Australian Stores
5 New Zealand Stores
7. The Foot Locker specialty store format Developing this global footprint prof-
was developed by the Company to offer itably in various international markets
the 12 to 20 year old target customer provides the Company with significant
with an in-depth selection of the latest growth opportunities for the foreseeable
styles and technologies of athletic future. New Foot Locker store openings
footwear and apparel. Initially launched are being prioritized to target global
in the United States in 1974, Foot markets where a highly profitable pres-
Locker began its international expansion ence has already been established.
some six years later with its first store Extensive research is also being con-
in the United Kingdom. Today, Foot ducted to identify new international
Locker operates very successfully with markets for future expansion. During
1,448 stores in the United States, 427 2004, 101 new Foot Locker stores are
stores in Western Europe, 129 stores in scheduled to open, with 33 targeted in
Canada and 84 stores in Australia. Foot the United States, 60 in Europe and 8 in
Locker celebrates its 30th anniversary in Australia.
2004 as the world’s largest athletic spe-
cialty retailer with 2,088 stores that
average 3,700 gross square feet, in 16
countries.
5
We distinguish our businesses from their
competition by providing trend-right
products and superior customer service
through convenient retail channels.
8. Champs Sports, which was acquired by Developing new and exclusive athletic
the Company in 1987, has grown to be footwear products in coordination with
one of the largest mall-based athletic the Company’s well-known merchandise
retailers in North America. Its 581 stores suppliers is a key merchandising strate-
in the United States and Canada, which gy. Apparel, equipment and accessory
average approximately 5,600 gross categories are also very important and
square feet, are designed to provide a provide a significant point of differenti-
sales environment that is attractive to ation from Champs Sports’ mall-based
its target customer: the 12 to 25 year competitors. A key competitive advan-
old who resides in a suburban communi- tage is its private-label apparel offerings
ty. Champs Sports offers a product mix that the Company designs and sources
comprising athletic footwear, apparel, directly from manufacturers. Over time,
and accessories for a wide variety of the Company believes that Champs
sports, fitness and lifestyle activities. Sports has an opportunity to grow to
become an 800 store chain.
6
We believe that we are well positioned in
the athletic retail industry to continue
our profitable growth.
9. Lady Foot Locker was developed in 1982 The initial Kids Foot Locker store was
to offer athletic footwear and apparel to opened in 1987 specifically targeted to
women who are active, fashion-con- appeal to mothers of 5 to 11 year old
scious and brand aware. Today, with children. Today, Kids Foot Locker oper-
584 stores in the United States, Lady ates 357 stores across the United States
Foot Locker is the only national special- that average 2,400 gross square feet,
ty store chain that focuses on women’s offering the latest styles of athletic
athletic footwear and apparel. During footwear and apparel for young boys and
2004, the Company plans to continue to girls. Its product offerings include
invest in remodeling its Lady Foot branded athletic footwear, supplemented
Locker stores, which average 2,200 gross by branded, licensed and private-label
square feet. In addition, Lady Foot apparel. Going forward, the Company
Locker’s branded and private-label plans to continue to build on Kids Foot
apparel offerings have been modified to Locker’s significant success in 2003, by
have more appeal to its target customer: working with its well-known third party
the 14 to 35 year old woman. suppliers to develop new and exclusive
athletic footwear and apparel products.
7
We expect to improve the productivity of our
existing business through the continued execu-
tion of our diligent expense control process and
real estate strategies.
10. Footlocker.com is the world’s leading ing new initiatives for its existing
retailer that sells athletic footwear, business and exploring additional part-
apparel and equipment direct to cus- nership opportunities with well-known
tomers via catalogs and E-commerce third parties. During 2003, a partnership
websites. The Company’s direct-to- agreement was established with
customers business originated in 1997 Amazon.com and the NBA, whereby the
through the purchase of Eastbay, a cata- Company currently provides fulfillment
log retailer that focused on selling ath- and customer service for the NBA Store
letic footwear and apparel to sports and WNBA Store on NBA.com and
teams in the United States. Since then, WNBA.com. A new 5-year extension with
the Company has rapidly expanded this the National Football League was
segment, reaching an annual sales vol- signed, whereby Foot Locker designs,
ume of $366 million and an operating merchandises and fulfills NFL’s official
profit of $53 million in 2003, by suc- catalog and E-commerce site.
cessfully improving the productivity of Additionally, in January 2004,
its catalog business and initiating an Footlocker.com entered into a 6-year
Internet channel. agreement with the United States
Olympic Committee providing
The strategic priorities for
Footlocker.com with the exclusive mer-
Footlocker.com/Eastbay, which are
chandising rights to sell USOC endorsed
geared towards maintaining a strong
8
products through catalogs and via a new
profitable growth rate, include develop-
E-commerce site.
Our direct-to-customers business is poised for
several years of continued growth, particularly as
the Internet continues to become a more widely
used medium for retail commerce.
11. SECURITIES AND EXCHANGE COMMISSION
Washington, D.C. 20549
FORM 10-K
Annual Report Pursuant to Section 13 or 15(d)
of the Securities Exchange Act of 1934
For the fiscal year ended January 31, 2004
Commission file number 1-10299
FOOT LOCKER, INC.
(Exact name of Registrant as specified in its charter)
New York 13-3513936
(State or other jurisdiction of (I.R.S. Employer Identification No.)
incorporation or organization)
112 West 34th Street, New York, New York 10120
(Address of principal executive offices) (Zip Code)
Registrant’s telephone number, including area code:
(212) 720-3700
Securities registered pursuant to Section 12(b) of the Act:
Title of each class Name of each exchange on which registered
Common Stock, par value $0.01 New York Stock Exchange
Preferred Stock Purchase Rights New York Stock Exchange
Securities registered pursuant to Section 12(g) of the Act:
None
Indicate by check mark whether the Registrant (1) has filed all reports required to be filed by Section 13 or 15(d)
of the Securities Exchange Act of 1934 during the preceding 12 months (or for such shorter period that the Registrant
was required to file such reports), and (2) has been subject to such filing requirements for the past 90 days. Yes H No h
Indicate by check mark if disclosure of delinquent filers pursuant to Item 405 of Regulation S-K is not contained
herein, and will not be contained, to the best of Registrant’s knowledge, in definitive proxy or information statements
incorporated by reference in Part III of this Form 10-K or any amendment to this Form 10-K. H
Indicate by check mark whether the Registrant is an accelerated filer (as defined in Rule 12b-2 of the Act).
Yes H No h
See pages 60 through 63 for Index of Exhibits.
Number of shares of Common Stock outstanding at March 26, 2004: 144,761,434
The aggregate market value of voting stock held by non-affiliates of the Registrant
computed by reference to the closing price as of the last business day of the
Registrant’s most recently completed second fiscal quarter, August 1, 2003, was
approximately: $1,788,814,575*
* For purposes of this calculation only (a) all directors plus one executive officer and owners of five percent or more
of the Registrant are deemed to be affiliates of the Registrant and (b) shares deemed to be “held” by such persons
at August 1, 2003, include only outstanding shares of the Registrant’s voting stock with respect to which such persons
had, on such date, voting or investment power.
DOCUMENTS INCORPORATED BY REFERENCE
Portions of the Registrant’s definitive Proxy Statement (the “Proxy Statement”) to be filed in connection with the 2004
Annual Meeting of Shareholders: Parts III and IV.
13. PART I
Item 1. Business
General
Foot Locker, Inc., incorporated under the laws of the State of New York in 1989, is a leading global retailer of athletic
footwear and apparel, operating as of January 31, 2004, 3,610 primarily mall-based stores in North America, Europe and
Australia. Foot Locker, Inc. and its subsidiaries hereafter are referred to as the “Registrant” or “Company.” Information
regarding the business is contained under the “Business Overview” section in “Item 7. Management’s Discussion and
Analysis of Financial Condition and Results of Operations.”
The Company maintains a website on the Internet at www.footlocker-inc.com. The Company’s filings with the
Securities and Exchange Commission, including its annual reports on Form 10-K, quarterly reports on Form 10-Q, current
reports on Form 8-K, and all amendments to those reports are available free of charge through this website as soon as
reasonably practicable after they are filed with or furnished to the SEC by clicking on the “SEC Filings” link. The Corporate
Governance section of the Company’s corporate website at www.footlocker-inc.com contains the Company’s Corporate
Governance Guidelines, Committee Charters and the Company’s Code of Business Conduct for directors, officers and
employees, including the Chief Executive Officer, Chief Financial Officer and Chief Accounting Officer. Copies of these
documents may also be obtained free of charge upon written request to the Company’s Corporate Secretary at 112 West
34th Street, New York, NY 10120.
Information Regarding Business Segments and Geographic Areas
The financial information concerning business segments, divisions and geographic areas is contained under the
“Business Overview” and “Segment Information” sections in “Item 7. Management’s Discussion and Analysis of Financial
Condition and Results of Operations.” Information regarding sales, operating results and identifiable assets of the
Company by business segment and by geographic area is contained under the “Segment Information” footnote in “Item
8. Consolidated Financial Statements and Supplementary Data.”
The service marks and trademarks appearing on this page and elsewhere in this report (except for NFL, NBA, Nike,
Amazon.com, Burger King, Popeye’s, The San Francisco Music Box Company and USOC) are owned by Foot Locker, Inc. or
its subsidiaries.
Employees
The Company and its consolidated subsidiaries had 15,782 full-time and 24,516 part-time employees at January 31,
2004. The Company considers employee relations to be satisfactory.
Competition
The financial information concerning competition is contained under the “Business Risk” section in the “Financial
Instruments and Risk Management” footnote in “Item 8. Consolidated Financial Statements and Supplementary Data.”
Merchandise Purchases
The financial information concerning merchandise purchases is contained under the “Business Concentration”
section in “Item 7. Management’s Discussion and Analysis of Financial Condition and Results of Operations” and under
the “Business Risk” section in the “Financial Instruments and Risk Management” footnote in “Item 8. Consolidated
Financial Statements and Supplementary Data.”
1
14. Item 2. Properties
The properties of the Company and its consolidated subsidiaries consist of land, leased and owned stores
and administrative and distribution facilities. Total selling area for the Athletic Stores segment at the end of 2003 was
approximately 7.92 million square feet. These properties are primarily located in the United States, Canada and Europe.
The Company currently operates three distribution centers, of which one is owned and two are leased, occupying an
aggregate of 1.88 million square feet. Two of the three distribution centers are located in the United States and one is
in Europe. The Company also has one additional distribution center that is leased and sublet, occupying approximately
0.1 million square feet.
Item 3. Legal Proceedings
Legal proceedings pending against the Company or its consolidated subsidiaries consist of ordinary, routine
litigation, including administrative proceedings, incident to the businesses of the Company, as well as litigation incident
to the sale and disposition of businesses that have occurred in the past several years. Management does not believe that
the outcome of such proceedings will have a material effect on the Company’s consolidated financial position, liquidity,
or results of operations.
Item 4. Submission of Matters to a Vote of Security Holders
There were no matters submitted to a vote of security holders during the fourth quarter of the year ended
January 31, 2004.
Executive Officers of the Company
Information with respect to Executive Officers of the Company, as of April 5, 2004, is set forth below:
Chairman of the Board, President and Chief Executive Officer Matthew D. Serra
Executive Vice President and Chief Financial Officer Bruce L. Hartman
President and Chief Executive Officer, Foot Locker, Inc. — U.S.A. Richard T. Mina
Senior Vice President, General Counsel and Secretary Gary M. Bahler
Senior Vice President — Real Estate Jeffrey L. Berk
Senior Vice President — Chief Information Officer Marc D. Katz
Senior Vice President — Strategic Planning Lauren B. Peters
Senior Vice President — Human Resources Laurie J. Petrucci
Vice President — Investor Relations and Treasurer Peter D. Brown
Vice President and Chief Accounting Officer Robert W. McHugh
Matthew D. Serra, age 59, has served as Chairman of the Board since February 1, 2004. He served as President since
April 12, 2000 and Chief Executive Officer since March 4, 2001. Mr. Serra served as Chief Operating Officer from February
2000 to March 3, 2001 and as President and Chief Executive Officer of Foot Locker Worldwide from September 1998 to
February 2000.
Bruce L. Hartman, age 50, has served as Executive Vice President since April 18, 2002 and Chief Financial Officer since
February 27, 1999. He served as Senior Vice President from February 1999 to April 2002. Mr. Hartman served as Vice
President-Corporate Shared Services from August 1998 to February 1999.
Richard T. Mina, age 47, has served as President and Chief Executive Officer of Foot Locker, Inc. — U.S.A. since
February 2, 2003. He served as President and Chief Executive Officer of Champs Sports from April 1999 to February 1, 2003.
He served as President of Foot Locker Europe from January 1996 to April 1999.
Gary M. Bahler, age 52, has served as Senior Vice President since August 1998, General Counsel since February 1993
and Secretary since February 1990.
2
15. Jeffrey L. Berk, age 48, has served as Senior Vice President — Real Estate since February 2000 and President of Foot
Locker Realty, North America from January 1997 to February 2000.
Marc D. Katz, age 39, has served as Senior Vice President — Chief Information Officer since May 12, 2003. Mr. Katz
served as Vice President and Chief Information Officer from July 2002 to May 11, 2003 and as Vice President and Controller
from April 2002 to July 2002. During the period of 1997 to 2002, he served in the following capacities at the Financial
Services Center of Foot Locker Corporate Services: Vice President and Controller from July 2001 to April 2002; Controller
from December 1999 to July 2001; and Retail Controller from October 1997 to December 1999.
Lauren B. Peters, age 42, has served as Senior Vice President — Strategic Planning since April 18, 2002. Ms. Peters
served as Vice President — Planning from January 2000 to April 17, 2002. She served as Vice President and Controller
from August 1998 to January 2000.
Laurie J. Petrucci, age 45, has served as Senior Vice President — Human Resources since May 2001. Ms. Petrucci served
as Senior Vice President — Human Resources of Foot Locker Worldwide from March 2000 to April 2001. She served as Vice
President of Organizational Development and Training of Foot Locker Worldwide from February 1999 to March 2000 and
as Vice President — Human Resources of Foot Locker Canada from February 1997 to February 1999.
Peter D. Brown, age 49, has served as Vice President — Investor Relations and Treasurer since October 2001. Mr. Brown
served as Vice President — Investor Relations and Corporate Development from April 2001 to October 2001 and as Assistant
Treasurer — Investor Relations and Corporate Development from August 2000 to April 2001. He served as Vice President
and Chief Financial Officer of Lady Foot Locker from October 1999 to August 2000, and as Director of the Company’s Profit
Improvement Task Force from November 1998 to October 1999.
Robert W. McHugh, age 45, has served as Vice President and Chief Accounting Officer since January 2000. He served
as Vice President — Taxation from November 1997 to January 2000.
There are no family relationships among the executive officers or directors of the Company.
PART II
Item 5. Market for the Company’s Common Equity and Related Stockholder Matters
Information regarding the Company’s market for common equity, quarterly high and low prices, dividend policy and
stock exchange listings are contained in the “Shareholder Information and Market Prices” footnote under “Item 8.
Consolidated Financial Statements and Supplementary Data.”
Item 6. Selected Financial Data
Selected financial data is included as the “Five Year Summary of Selected Financial Data” footnote in “Item 8.
Consolidated Financial Statements and Supplementary Data.”
Item 7. Management’s Discussion and Analysis of Financial Condition and Results of Operations
Business Overview
Foot Locker, Inc., through its subsidiaries, operates in two reportable segments — Athletic Stores and Direct-to-
Customers. The Athletic Stores segment is one of the largest athletic footwear and apparel retailers in the world, whose
formats include Foot Locker, Lady Foot Locker, Kids Foot Locker and Champs Sports. The Direct-to-Customers segment
reflects Footlocker.com, Inc., which sells, through its affiliates, including Eastbay, Inc., to customers through catalogs
and Internet websites.
3
16. The Foot Locker brand is one of the most widely recognized names in the market segments in which the Company
operates, epitomizing high quality for the active lifestyle customer. This brand equity has aided the Company’s ability
to successfully develop and increase its portfolio of complementary retail store formats, specifically, Lady Foot Locker and
Kids Foot Locker, as well as Footlocker.com, Inc., its direct-to-customers business. Through various marketing channels,
including television campaigns and sponsorships of various sporting events, Foot Locker, Inc. reinforces its image with
a consistent message; namely, that it is the destination store for athletic apparel and footwear with a wide selection of
merchandise in a full-service environment.
Athletic Stores
The Company operates 3,610 stores in the Athletic Stores segment. The following is a brief description of the Athletic
Stores segment’s operating businesses:
Foot Locker — Foot Locker is a leading athletic footwear and apparel retailer. Its stores offer the latest in athletic-
inspired performance products, manufactured primarily by the leading athletic brands. Foot Locker offers products for a
wide variety of activities including running, basketball, hiking, tennis, aerobics, fitness, baseball, football and soccer.
Its 2,088 stores are located in 16 countries including 1,448 in the United States, Puerto Rico, the United States Virgin
Islands and Guam, 129 in Canada, 427 in Europe and a combined 84 in Australia and New Zealand. The domestic stores
have an average of 2,400 selling square feet and the international stores have an average of 1,600 selling square feet.
Lady Foot Locker — Lady Foot Locker is a leading U.S. retailer of athletic footwear, apparel and accessories for women.
Its stores carry all major athletic footwear and apparel brands, as well as casual wear and an assortment of proprietary
merchandise designed for a variety of activities, including running, basketball, walking and fitness. Its 584 stores are
located in the United States and Puerto Rico and have an average of 1,200 selling square feet.
Kids Foot Locker — Kids Foot Locker is a national children’s athletic retailer that offers the largest selection of brand-
name athletic footwear, apparel and accessories for infants, boys and girls, primarily on an exclusive basis. Its stores
feature an entertaining environment geared to both parents and children. Its 357 stores are located in the United States
and Puerto Rico and have an average of 1,400 selling square feet.
Champs Sports — Champs Sports is one of the largest mall-based specialty athletic footwear and apparel retailers
in the United States. Its product categories include athletic footwear, apparel and accessories, and a focused assortment
of equipment. This combination allows Champs Sports to differentiate itself from other mall-based stores by presenting
complete product assortments in a select number of sporting activities. Its 581 stores are located throughout the United
States and Canada. The Champs Sports stores have an average of 3,900 selling square feet.
Store Profile
At At
February 1, 2003 Opened Closed January 31, 2004
Foot Locker . . . . . . . . . . . . . . . . . . . . . . . . . . . . . . 2,060 94 66 2,088
Lady Foot Locker . . . . . . . . . . . . . . . . . . . . . . . . . 606 2 24 584
Kids Foot Locker . . . . . . . . . . . . . . . . . . . . . . . . . 377 — 20 357
Champs Sports . . . . . . . . . . . . . . . . . . . . . . . . . . . 582 17 18 581
Total Athletic Stores . . . . . . . . . . . . . . . . . . . . . 3,625 113 128 3,610
4
17. Direct-to-Customers
Footlocker.com — Footlocker.com, Inc., sells, through its affiliates, directly to customers through catalogs and its
Internet websites. Eastbay, Inc., one of its affiliates, is one of the largest direct marketers of athletic footwear, apparel,
equipment and licensed private-label merchandise in the United States and provides the Company’s seven full-service
e-commerce sites access to an integrated fulfillment and distribution system. The Company has an agreement with the
National Football League as its official catalog and e-commerce retailer, which includes managing the NFL catalog and
e-commerce businesses. Footlocker.com designs, merchandises and fulfills the NFL’s official catalog (NFL Shop) and the
e-commerce site linked to www.NFLshop.com. The Company has a strategic alliance to offer footwear and apparel on the
Amazon.com website and the Foot Locker brands are featured in the Amazon.com specialty stores for apparel and accessories
and sporting goods. During 2003, the Company entered into an arrangement with the NBA and Amazon.com whereby Foot
Locker began to provide the fulfillment services for NBA licensed products sold over the Internet at NBAstore.com and the
NBA store on Amazon.com. In addition, the Company also entered into a marketing agreement with the U.S. Olympic
Committee (USOC) providing the Company with the exclusive rights to sell USOC licensed products through catalogs and via
a new e-commerce site.
Sales by Segment
The following table summarizes sales by segment, after reclassification for businesses disposed. The disposition of
all businesses previously held for disposal was completed by the end of 2001:
2003 2002 2001
(in millions)
Athletic Stores . . . . . . . . . . . . . . . . . . . . . . . . . . . . . . . . . . . . . . . . . . . . . $4,413 $4,160 $3,999
Direct-to-Customers . . . . . . . . . . . . . . . . . . . . . . . . . . . . . . . . . . . . . . . . 366 349 326
4,779 4,509 4,325
Disposed(1) . . . . . . . . . . . . . . . . . . . . . . . . . . . . . . . . . . . . . . . . . . . . . . . . . — — 54
$4,779 $4,509 $4,379
Division Profit
The Company evaluates performance based on several factors, of which, the primary financial measure is division
results. Division profit reflects income from continuing operations before income taxes, corporate expense, non-operating
income and net interest expense. The following table reconciles division profit by segment to income from continuing
operations before income taxes.
2003 2002 2001
(in millions)
Athletic Stores . . . . . . . . . . . . . . . . . . . . . . . . . . . . . . . . . . . . . . . . . . . . . $363 $279 $283
Direct-to-Customers . . . . . . . . . . . . . . . . . . . . . . . . . . . . . . . . . . . . . . . . 53 40 24
Division profit from ongoing operations . . . . . . . . . . . . . . . . . . . . 416 319 307
Disposed(1) . . . . . . . . . . . . . . . . . . . . . . . . . . . . . . . . . . . . . . . . . . . . . . . . . — — (12)
Restructuring income (charges)(2) . . . . . . . . . . . . . . . . . . . . . . . . . . (1) 2 (33)
Total division profit . . . . . . . . . . . . . . . . . . . . . . . . . . . . . . . . . . . 415 321 262
Corporate expense(3) . . . . . . . . . . . . . . . . . . . . . . . . . . . . . . . . . . . . . . . (73) (52) (65)
Total operating profit . . . . . . . . . . . . . . . . . . . . . . . . . . . . . . . . . . . . . . 342 269 197
Non-operating income . . . . . . . . . . . . . . . . . . . . . . . . . . . . . . . . . . . . . — 3 2
Interest expense, net . . . . . . . . . . . . . . . . . . . . . . . . . . . . . . . . . . . . . . (18) (26) (24)
Income from continuing operations before
income taxes . . . . . . . . . . . . . . . . . . . . . . . . . . . . . . . . . . . . . . . . . . . . $324 $246 $175
(1) Includes The San Francisco Music Box Company and Burger King and Popeye’s franchises.
(2) Restructuring charges of $1 million and $33 million in 2003 and 2001, respectively, and restructuring income of $2 million in 2002 reflect the
disposition of non-core businesses and an accelerated store-closing program.
(3) 2001 includes a $1 million restructuring charge related to the 1999 closure of a distribution center.
5
18. Sales
All references to comparable-store sales for a given period relate to sales of stores that are open at the period-end
and that have been open for more than one year. Accordingly, stores opened and closed during the period are not included.
All comparable-store sales increases and decreases exclude the impact of foreign currency fluctuations.
Sales of $4,779 million in 2003 increased by 6.0 percent from sales of $4,509 million in 2002. Excluding the effect
of foreign currency fluctuations, sales increased by 2.2 percent as compared with 2002, primarily as a result of the
Company’s continuation of the new store opening program. Comparable-store sales decreased by 0.5 percent.
Sales of $4,509 million in 2002 increased 3.0 percent from sales of $4,379 million in 2001. Excluding sales from
businesses disposed and the effect of foreign currency fluctuations, 2002 sales increased by 3.1 percent as compared with
2001 primarily as a result of the new store opening program. Comparable-store sales increased by 0.1 percent.
Gross Margin
Gross margin, as a percentage of sales, of 30.9 percent increased by 110 basis points in 2003 from 29.8 percent in
2002, primarily reflecting a decrease in the cost of merchandise, as a percentage of sales. Increased vendor allowances
improved gross margin, as a percentage of sales, by 28 basis points, year over year.
Gross margin, as a percentage of sales, of 29.8 percent declined by 10 basis points in 2002 as compared with 29.9
percent in 2001, primarily resulting from the increase in the cost of merchandise, as a percentage of sales, due to increased
markdown activity. The impact of the vendor allowances was an improvement in gross margin in 2002, as a percentage
of sales, of 30 basis points as compared with 2001.
Segment Information
Athletic Stores
2003 2002 2001
(in millions)
Sales . . . . . . . . . . . . . . . . . . . . . . . . . . . . . . . . . . . . . . . . . . . . . . . . . . . . . . . $4,413 $4,160 $3,999
Division profit
Stores . . . . . . . . . . . . . . . . . . . . . . . . . . . . . . . . . . . . . . . . . . . . . . . . . . . . . . $ 363 $ 279 $ 283
Restructuring income . . . . . . . . . . . . . . . . . . . . . . . . . . . . . . . . . . . . . . — 1 —
Total division profit . . . . . . . . . . . . . . . . . . . . . . . . . . . . . . . . . . . $ 363 $ 280 $ 283
Sales as a percentage of consolidated total . . . . . . . . . . . . . . . . 92% 92% 92%
Number of stores at year end . . . . . . . . . . . . . . . . . . . . . . . . . . . . . . . 3,610 3,625 3,590
Selling square footage (in millions) . . . . . . . . . . . . . . . . . . . . . . . . 7.92 8.04 7.94
Gross square footage (in millions) . . . . . . . . . . . . . . . . . . . . . . . . . . 13.14 13.22 13.14
Athletic Stores sales of $4,413 million increased 6.1 percent in 2003, as compared with $4,160 million in 2002.
Excluding the effect of foreign currency fluctuations, primarily related to the euro, sales from athletic store formats
increased 1.9 percent in 2003, driven by the Company’s new store opening program, particularly in Foot Locker Europe
and Foot Locker Australia. Foot Locker Europe and Foot Locker Australia also continued to generate solid comparable-store
sales increases. Total Athletic Stores comparable-store sales decreased by 0.9 percent in 2003.
6
19. Footwear sales in the U.S. were led by the classic category. Consumer demand for “retro” fashioned athletic footwear
was also a primary driver of sales throughout 2003. The Company also benefited from exclusive offerings from its primary
suppliers, such as the Nike 20 pack line in the latter part of 2003. Sales of private label and licensed product also
contributed to the increase in sales, as consumer interest began to show improvement with the strengthening of the
economy.
Comparable-store sales at Kids Foot Locker continually improved since the realignment under the Foot Locker U.S.
management team in 2002. Kids Foot Locker’s sales, significantly improved during the fourth quarter of 2003, nearly
reaching double-digit comparable-store sales.
Lady Foot Locker sales remained essentially unchanged in 2003 versus the prior year as this business continued to
modify its merchandising mix to better suit its target customers. The Company closed a number of underperforming stores,
focused on remodeling and relocating numerous stores and changed its merchandise assortment.
Athletic Stores sales of $4,160 million increased 4.0 percent in 2002, as compared with $3,999 million in 2001. The
increase was in part due to the euro strengthening against the U.S. dollar in 2002, particularly in the third and fourth
quarters. Excluding the effect of foreign currency fluctuations, sales from athletic store formats increased 2.8 percent in
2002, which was driven by the Company’s new store opening program, particularly in Foot Locker Europe and Champs
Sports. Foot Locker Europe and Foot Locker Australia generated impressive comparable-store sales increases. Champs
Sports also contributed a comparable-store sales increase. Total Athletic Stores comparable-store sales decreased by 0.4
percent in 2002.
The Foot Locker business in the United States, as a whole, showed disappointing sales during 2002. In the United
States, both the basketball category as well as the trend in classic shoes led footwear sales across most formats, although
certain higher-priced marquee footwear did not sell as well as anticipated in the first quarter of 2002. During the second
quarter of 2002, the Company successfully moved its marquee footwear back in line with historical levels and re-focused
its marquee footwear selection on products having a retail price of $90 to $120 per pair and made changes to the product
assortment, which accommodated customer demands in the third quarter of 2002. Lower mall traffic resulted in
disappointing sales during the fourth quarter of 2002. Sales, however, benefited from the apparel strategy led by
merchandise in private label and licensed offerings.
Sales from the Lady Foot Locker and Kids Foot Locker formats were particularly disappointing in 2002. The Kids Foot
Locker format, which had previously been managed in conjunction with Lady Foot Locker, was realigned and is currently
being managed by the Foot Locker U.S. management team. Pursuant to SFAS No. 144, the Company performed an analysis
of the recoverability of store long-lived assets for the Lady Foot Locker format during the third quarter of 2002 and for
the Kids Foot Locker format during the fourth quarter of 2002 and recorded asset impairment charges of $1 million and
$6 million, respectively.
Division profit from Athletic Stores increased by 30.1 percent to $363 million in 2003 from $279 million in 2002.
Division profit, as a percentage of sales, increased to 8.2 percent in 2003 from 6.7 percent in 2002. The increase in 2003
was primarily driven by the overall improvement in the gross margin rate, as a result of better merchandise purchasing,
as well as, increased vendor allowances which contributed 30 basis points to the overall improvement. Additionally, during
2002 the Company recorded $7 million of impairment charges for the Kids Foot Locker and Lady Foot Locker formats.
Operating performance improved in the U.S. Foot Locker, Kids Foot Locker and international formats as compared with
the prior year. Champs Sports and Lady Foot Locker remained relatively flat as compared with 2002. However, for the second
half of 2003 the operating results of the Lady Foot Locker format improved considerably, as compared with the
corresponding prior year period. Management expects this trend to continue.
7
20. Division profit from athletic store formats decreased 1.4 percent to $279 million in 2002 from $283 million in 2001.
Division profit, as a percentage of sales, decreased to 6.7 percent in 2002 from 7.1 percent in 2001 primarily due to the
increased operating expenses associated with the new store-opening program. The impact of no longer amortizing
goodwill as a result of the Company’s adoption of SFAS No. 142 was a reduction of amortization expense of $2 million
in 2002. Operating performance improved internationally but was more than offset by the decline in performance in the
United States from the Foot Locker, Lady Foot Locker and Kids Foot Locker formats. Division profit included asset
impairment charges of $1 million and $2 million in 2002 and 2001, respectively, for the Lady Foot Locker format. An asset
impairment charge of $6 million was also recorded in 2002 related to the Kids Foot Locker format.
Direct-to-Customers
2003 2002 2001
(in millions)
Sales . . . . . . . . . . . . . . . . . . . . . . . . . . . . . . . . . . . . . . . . . . . . . . . . . . . . . . . . . . . . . $366 $349 $326
Division profit . . . . . . . . . . . . . . . . . . . . . . . . . . . . . . . . . . . . . . . . . . . . . . . . . . . . $ 53 $ 40 $ 24
Sales as a percentage of consolidated total . . . . . . . . . . . . . . . . . . . . . . 8% 8% 7%
Direct-to-Customers sales increased 4.9 percent in 2003 to $366 million as compared with $349 million in 2002.
Division profit, as a percentage of sales, in this quickly expanding division, is more profitable than the store business.
The growth of the Internet business continued to drive sales in 2003. Internet sales increased by 32.6 percent to $191
million from $144 million in 2002. Catalog sales decreased by 14.6 percent to $175 million in 2003 from $205 million
in 2002. Management believes that the decrease in catalog sales is substantially offset by the increase in Internet sales
as the trend has continued for customers to browse and select products through its catalogs and then to make their
purchases via the Internet. The Company continues to implement new initiatives to grow this business, including new
marketing arrangements and strategic alliances with well-known third parties. During 2003, the Company extended its
agreement with the NFL, entered into new alliance agreements with the NBA and the USOC and expanded its services
through on-line specialty stores with Amazon.com. These agreements generally provide for the Company to merchandise,
fulfill and manage the websites of these strategic partners.
Direct-to-Customers sales increased by 7.1 percent to $349 million in 2002 from $326 million in 2001. The Internet
business continued to drive the sales growth in 2002. Internet sales increased by $44 million, or 44.0 percent, to $144
million in 2002 compared with $100 million in 2001. Catalog sales decreased 9.3 percent to $205 million in 2002 from
$226 million in 2001. During 2002, the Company implemented many new initiatives designed to increase market share
within the Internet arena. A new catalog website was launched that offers value-based products. The Company began to
offer product customization to further differentiate its products from those of competitors, expanded on the existing
relationship with the National Football League and, prior to the end of 2002, entered into a strategic alliance to offer
footwear and apparel on the Amazon.com website. Foot Locker is a featured brand in the Amazon.com specialty store for
apparel and accessories.
The Direct-to-Customers business generated division profit of $53 million in 2003, as compared with $40 million in
2002. The increase in division profit was primarily due to increased sales. Division profit, as a percentage of sales, increased
to 14.5 percent in 2003 from 11.5 percent in 2002. Management anticipates that the sales and earnings of the integrated
Internet and catalog business will continue to grow.
The Direct-to-Customers business generated division profit of $40 million in 2002 as compared with $24 million in
2001. Division profit, as a percentage of sales, increased to 11.5 percent in 2002 from 7.4 percent in 2001. The increase
was primarily due to the increase in gross margin, reduced marketing costs and $5 million related to the impact of no
longer amortizing goodwill as a result of the Company’s adoption of SFAS No. 142 in 2002.
8
21. All Other Businesses
The “All Other” category included Afterthoughts, The San Francisco Music Box Company (“SFMB”), the Burger King
and Popeye’s franchises, Randy River Canada, Weekend Edition and the Garden Centers. The disposition of these businesses
was completed by the end of 2001.
2003 2002 2001
(in millions)
Sales . . . . . . . . . . . . . . . . . . . . . . . . . . . . . . . . . . . . . . . . . . . . . . . . . . . . . . . . . . . . . $— $— $ 54
Division profit (loss)
Disposed . . . . . . . . . . . . . . . . . . . . . . . . . . . . . . . . . . . . . . . . . . . . . . . . . . . . . . . . . $— $— $(12)
Restructuring income (charges) . . . . . . . . . . . . . . . . . . . . . . . . . . . . . . . . . . (1) 1 (33)
Total division profit (loss) . . . . . . . . . . . . . . . . . . . . . . . . . . . . . . . . . . $ (1) $1 $(45)
Sales as a percentage of consolidated total . . . . . . . . . . . . . . . . . . . . . . —% —% 1%
In connection with the 1999 restructuring program, restructuring charges of $1 million and $33 million, were
recorded in 2003 and 2001, respectively, related to the dispositions of the non-core businesses. The charge in 2003 was
primarily related to the Company’s guarantee of the lease liabilities of the distribution center and certain stores of SFMB
as a result of their filing for bankruptcy, while the restructuring charges of $33 million recorded in 2001 related to the
disposition of SFMB and the Burger King and Popeye’s franchises. In 2002, a $1 million reduction was recorded due to
actual amounts being better than anticipated.
The sale of SFMB was completed on November 13, 2001, for cash proceeds of approximately $14 million. In addition,
on October 10, 2001, the Company completed the sale of assets related to its Burger King and Popeye’s franchises for cash
proceeds of approximately $5 million.
Corporate Expense
Corporate expense consists of unallocated general and administrative expenses related to the Company’s corporate
headquarters, centrally managed departments, unallocated insurance and benefit programs, certain foreign exchange
transaction gains and losses and other items. Corporate expense included depreciation and amortization of $25 million
in 2003, $26 million in 2002 and $28 million in 2001. The increase in corporate expense in 2003 was primarily related
to increased compensation costs for incentive bonuses and increased restricted stock expense related to additional grants.
Corporate expense in 2002 declined compared with 2001 primarily reflecting decreased payroll expenses related to
reductions in headcount. Corporate expense in 2002 was also reduced by a net foreign exchange gain of $4 million related
to intercompany foreign currency denominated firm commitments.
9
22. Results of Operations
Selling, General and Administrative Expenses
Selling, general and administrative expenses (“SG&A”) increased by $59 million to $987 million in 2003, or by
6.4 percent, as compared with 2002. Excluding the effect of foreign currency fluctuations, primarily related to the euro,
SG&A increased by 2.7 percent. The increases were related to additional payroll costs of $16 million in Europe, primarily
as a result of new store openings and $12 million related to compensation costs for incentive bonuses due to the Company’s
performance. Additionally, pension expense increased by $8 million due to the decline in plan asset values experienced
in prior years, partially offset by a $4 million increase in the recognition of postretirement income and foreign exchange
gain recorded in 2002. During 2002, the Company recorded asset impairment charges of $6 million and $1 million related
to the Kids Foot Locker and Lady Foot Locker formats, respectively. SG&A as a percentage of sales remained relatively flat
as compared with the corresponding prior year period.
SG&A increased by $5 million in 2002 to $928 million. The increase included $13 million related to new
store openings, $11 million related to the impact of foreign currency fluctuations, primarily related to the euro, and
$10 million related to increased pension costs. The increase in pension costs resulted from the decline in the retirement
plans’ asset values experienced in prior years and the expected long-term rate of return used to determine the expense.
These increases were partially offset by $29 million in the reduction in SG&A expenses related to the dispositions of SFMB
and the Burger King and Popeye’s franchises during the third quarter of 2001, and a $3 million increase in income related
to the postretirement plan. The increase in postretirement income of $3 million resulted from the amortization of the
associated gains. SG&A, as a percentage of sales, decreased to 20.6 percent in 2002 from 21.1 percent in 2001. During
2002, the Company recorded asset impairment charges of $6 million and $1 million related to the Kids Foot Locker and
Lady Foot Locker formats, respectively, compared with $2 million in 2001 for the Lady Foot Locker format. SG&A in 2002
was reduced by a net foreign exchange gain of $4 million related to intercompany foreign currency denominated firm
commitments.
Depreciation and Amortization
Depreciation and amortization of $147 million decreased by 1.3 percent in 2003 from $149 million in 2002. Excluding
the impact of foreign currency fluctuations, depreciation and amortization declined by $5 million. The decrease relates
primarily to assets becoming fully depreciated for the U.S. Athletic stores, offset in part by an increase related to the
European new stores.
Depreciation and amortization of $149 million decreased by 3.2 percent in 2002 from $154 million in 2001. The
impact of no longer amortizing goodwill, as required by SFAS No. 142, which was adopted by the Company effective
February 3, 2002, was $7 million and was partially offset by increased depreciation of $2 million associated with the new
store opening program, primarily in Europe.
Interest Expense, Net
2003 2002 2001
(in millions)
Interest expense . . . . . . . . . . . . . . . . . . . . . . . . . . . . . . . . . . . . . . . . . . . . . . . . . $ 26 $ 33 $ 35
Interest income . . . . . . . . . . . . . . . . . . . . . . . . . . . . . . . . . . . . . . . . . . . . . . . . . . (8) (7) (11)
Interest expense, net . . . . . . . . . . . . . . . . . . . . . . . . . . . . . . . . . . . . . . . $ 18 $ 26 $ 24
Weighted-average interest rate (excluding facility fees):
Short-term debt. . . . . . . . . . . . . . . . . . . . . . . . . . . . . . . . . . . . . . . . . . . . . . —% —% 6.0%
Long-term debt . . . . . . . . . . . . . . . . . . . . . . . . . . . . . . . . . . . . . . . . . . . . . . 6.1% 7.2% 7.4%
Total debt . . . . . . . . . . . . . . . . . . . . . . . . . . . . . . . . . . . . . . . . . . . . . . . . . . . 6.1% 7.2% 7.4%
Short-term debt outstanding during the year:
High . . . . . . . . . . . . . . . . . . . . . . . . . . . . . . . . . . . . . . . . . . . . . . . . . . . . . . . . . $— $— $ 11
Weighted-average. . . . . . . . . . . . . . . . . . . . . . . . . . . . . . . . . . . . . . . . . . . . $— $— $—
10
23. Interest expense of $26 million declined by 21.2 percent in 2003 from $33 million in 2002. Interest expense primarily
related to the facility fees and amortization of the issuance costs for the credit facility, remained flat at $3 million. Interest
expense related to long-term debt declined by $6 million primarily as a result of the $100 million of interest rate swaps
that were outstanding during 2003. These interest rate swaps were entered into in order to convert the 8.50 percent fixed-
rate debentures, which are due in 2022 to a lower variable rate. The Company entered into an interest rate swap agreement
in December 2002 to convert $50 million of the 8.50 percent debentures to variable rate debt and subsequently entered
into two additional swaps during 2003, totaling $50 million, which allowed the Company to lower the net amount of
interest expense being paid at each interest payment date. The swaps reduced interest expense by approximately
$4 million. The remaining decrease is a result of the lower debt balance as the Company repurchased $19 million of the
8.50 percent debentures in 2003 and $9 million in the latter part of 2002. Interest expense was further reduced as a result
of the repayment of the remaining $32 million of the $40 million 7.00 percent medium-term notes that matured in
October 2002.
Interest expense of $33 million declined by 5.7 percent in 2002 from $35 million in 2001. Interest expense related
to the revolving credit facility decreased by $1 million primarily as a result of the amortization of deferred financing
costs over the amended agreement term. Interest expense related to long-term debt also declined by $1 million. There
was an increase of $3 million in interest expense in 2002 resulting from the issuance of the $150 million 5.50 percent
convertible notes in June 2001. This increase was more than offset by the reduction in interest expense that resulted from
the repayment of the remaining $32 million of the $40 million 7.00 percent medium-term notes in October 2002 and the
interest expense in 2001 associated with the $50 million 6.98 percent medium-term notes that were repaid in
October 2001.
Interest income related to cash and cash equivalents and other short-term investments amounted to $5 million in
both 2003 and 2002. Additional interest income in 2003 of $2 million was generated through accretion of the
Northern Group note to its present value and accrued interest income on the note, which was recorded during the fourth
quarter of 2002. Interest income of $1 million and $2 million was related to tax refunds and settlements in 2003 and
2002, respectively.
Interest income related to cash and cash equivalents and other short-term investments amounted to $5 million in
2002 and $4 million in 2001. Interest income in both 2002 and 2001 included $2 million of interest income related to
tax refunds and settlements. Also included was intercompany interest of $5 million in 2001 related to the Northern Group
segment. The offsetting interest expense for the Northern Group was charged to the reserve for discontinued operations.
Income Taxes
The effective rate for 2003 was 35.5 percent, as compared with 34.2 percent in the prior year. The increased tax rate
was primarily due to the Company recording tax benefits of $5 million in 2003 as compared to $9 million in 2002. In
addition the rate increased due to a shift in taxable income by jurisdiction. During 2003, the Company recorded a $1 million
tax benefit related to state tax law changes, a $2 million tax benefit related to a reduction in the valuation allowance
for deferred tax assets related to a multi-state tax planning strategy, a $1 million tax benefit related to a reduction in
the valuation allowance for foreign tax loss carryforwards and a tax benefit of $1 million related to the settlement of
tax examinations.
The effective rate for 2002 was 34.2 percent. The Company recorded a tax benefit during 2002 of $5 million related
to a multi-state tax planning strategy, a $1 million tax benefit related to settlement of tax examinations, a $2 million
benefit related to the reduction in the valuation allowance for deferred tax assets related to foreign tax credits and a
$1 million benefit related to international tax planning strategies. The combined effect of these items, in addition to
higher earnings in lower tax jurisdictions and the utilization of tax loss carryforwards reduced the effective tax rate.
In 2001, the effective tax rate was 36.6 percent. The Company recorded a tax benefit during 2001 of $7 million related
to state and local income tax settlements, partially offset by a $2 million charge from the impact of Canadian tax rate
reductions on existing deferred tax assets. The combined effect of these items, in addition to higher earnings in lower
tax jurisdictions and the utilization of tax loss carryforwards were offset, in part, by the impact of non-deductible goodwill
which reduced the effective tax rate.
11
24. Liquidity and Capital Resources
Cash Flow and Liquidity
Generally, the Company’s primary source of cash has been from operations. The Company has a revolving credit
facility, which was amended on July 30, 2003. As a result of the amendment, the credit facility was increased by $10 million
to $200 million and the maturity date was extended to July 2006 from June 2004. The amendment also provided for a
lower pricing structure and increased covenant flexibility. Other than $24 million utilized for stand-by letter of credit
requirements, this revolving credit facility was not used during 2003. In 2001, the Company raised $150 million in cash
through the issuance of subordinated convertible notes. The Company may redeem all or a portion of the notes at any
time on or after June 4, 2004. If the Company were to exercise its option, the Company anticipates that the holders of
the notes would convert to common stock, provided that the Company’s common stock price at that time exceeds the
conversion price of $15.806; however, the holders of the notes may elect to receive cash at the then applicable conversion
premium. The Company generally finances real estate with operating leases. The principal uses of cash have been to finance
inventory requirements, capital expenditures related to store openings, store remodelings and management information
systems, and to fund other general working capital requirements.
Management believes operating cash flows and current credit facilities will be adequate to finance its working capital
requirements, to make scheduled pension contributions for the Company’s retirement plans, to fund quarterly dividend
payments, and support the development of its short-term and long-term operating strategies. The Company contributed
an additional $44 million and $6 million to its U.S. and Canadian qualified pension plans, respectively, in February 2004.
The U.S. contribution was made in advance of ERISA requirements. Planned capital expenditures for 2004 are $141 million,
of which $97 million relates to new store openings and modernizations of existing stores and $44 million reflects the
development of information systems and other support facilities. In addition, planned lease acquisition costs are
$24 million and primarily relate to the Company’s operations in Europe. The Company has the ability to revise and
reschedule the anticipated capital expenditure program, should the Company’s financial position require it.
Any materially adverse reaction to customer demand, fashion trends, competitive market forces, uncertainties
related to the effect of competitive products and pricing, customer acceptance of the Company’s merchandise mix and
retail locations, the Company’s reliance on a few key vendors for a significant portion of its merchandise purchases (and
on one key vendor for approximately 40 percent of its merchandise purchases), risks associated with foreign global
sourcing or economic conditions worldwide could affect the ability of the Company to continue to fund its needs from
business operations.
Operating activities of continuing operations provided cash of $264 million in 2003 as compared with $347 million
in 2002. These amounts reflect income from continuing operations adjusted for non-cash items and working capital
changes. The decrease was primarily the result of a $50 million pension contribution and working capital usage, partially
offset by increased income from continuing operations. Income from continuing operations increased by $54 million in
2003. Working capital usage included higher net cash outflow for merchandise inventories in 2003 as compared with 2002
and the Company increased its inventory position to accommodate anticipated sales in 2004. The decrease in income taxes
payable was attributable to increased payments made during 2003. The Company received a refund of tax and interest
of $13 million during the fourth quarter of 2003.
Operating activities of continuing operations provided cash of $347 million in 2002 compared with $204 million in
2001. The increase in cashflow from operations of $143 million in 2002 was primarily due to improved operating
performance and was also related to working capital changes primarily related to merchandise inventories, offset by the
related payables and income taxes payable. During the third quarter of 2002, the Company recorded a current receivable
of approximately $45 million related to a Federal income tax refund and subsequently received the cash during the fourth
quarter. Payments charged to the repositioning and restructuring reserves were $3 million in 2002 compared with
$62 million in 2001.
12
25. Net cash used in investing activities of the Company’s continuing operations was $159 million in 2003 compared
with $162 million in 2002. Capital expenditures of $144 million in 2003 and $150 million in 2002 primarily related to
store remodelings and new stores. Lease acquisition costs, primarily related to the process of securing and extending prime
lease locations for real estate in Europe, were $15 million and $18 million in 2003 and 2002, respectively. Proceeds from
the disposal of real estate of $6 million in 2002 primarily related to the condemnation of a part-owned and part-leased
property. This real estate transaction resulted in a gain of $3 million, which was recorded in other income.
Net cash used in investing activities of continuing operations was $162 million in 2002 compared with $116 million
in 2001. The change was due to a $34 million increase in capital expenditures in 2002 related to store remodelings and
new stores. Lease acquisition costs were $18 million and $20 million in 2002 and 2001, respectively. Proceeds from sales
of real estate and other assets and investments were $6 million in 2002 compared with $20 million in 2001. Proceeds from
the condemnation of the Company’s part-owned and part-leased property contributed $6 million of cash received in 2002.
Proceeds from the sales of The San Francisco Music Box Company and the Burger King and Popeye’s franchises contributed
$14 million and $5 million in cash, respectively, in 2001.
Net cash used in financing activities of continuing operations was $13 million in 2003 compared with $36 million
in 2002. The Company repurchased $19 million of its 8.50 percent debentures that are due in 2022 during 2003. During
2002, the Company repaid the remaining $32 million of the $40 million 7.00 percent medium-term notes due in October
2002 and retired approximately $9 million of its 8.50 percent debentures. The Company declared and paid a $0.03 per
share dividend in each of the first three quarters and a $0.06 per share dividend in the fourth quarter of 2003, totaling
$21 million for the year. During 2002, the Company declared and paid a dividend during the fourth quarter of $0.03 per
share totaling $4 million. During 2003 and 2002, the Company received proceeds from the issuance of common stock in
connection with employee stock programs of $27 million and $10 million, respectively.
Net cash used in financing activities of the Company’s continuing operations was $36 million in 2002 as compared
with $89 million of cash provided by financing activities of continuing operations in 2001. The change in 2002 compared
with 2001 was primarily due to the issuance of $150 million of convertible notes on June 8, 2001, which was partially
offset by the repayment of the $50 million 6.98 percent medium-term notes that matured in October 2001 and the
repurchase and retirement of $8 million of the $40 million 7.00 percent medium-term notes. During 2002, the Company
repaid the balance of the $40 million 7.00 percent medium-term notes that were due in October 2002 and $9 million of
the $200 million of debentures due in 2022. There were no outstanding borrowings under the Company’s revolving credit
agreement as of February 1, 2003 and February 2, 2002. During 2002, the Company declared and paid a $0.03 per share
dividend during the fourth quarter of $4 million.
Net cash provided by and used in discontinued operations includes the loss from discontinued operations, the change
in assets and liabilities of the discontinued segments and disposition activity related to the reserves. In 2003, net cash
provided by discontinued operations was $7 million and primarily related to an income tax benefit of $21 million offset
by payments against the reserves of $13 million. In 2002 and 2001, discontinued operations utilized cash of $10 million
and $75 million, respectively, which consisted of payments for the Northern Group’s operations and disposition activity
related to the other discontinued segments.
Capital Structure
As of January 31, 2004, the Company increased cash, net of debt and capital lease obligations, to $112 million. In
2003, the Company repurchased $19 million of the 8.50 percent debentures due in 2022. The Company declared and
paid dividends totaling $21 million during 2003. The Company’s revolving credit facility was amended in 2003 to increase
the available line of credit by $10 million to $200 million and lengthened the term to July 2006. The amended agreement
includes various restrictive financial covenants with which the Company was in compliance on January 31, 2004. The
Company made a $50 million contribution to its U.S. qualified retirement plan in February 2003, in advance of
ERISA requirements.
13