
Recomendados
Mais conteúdo relacionado
Mais procurados
Mais procurados (19)
Destaque
Semelhante a unisys 4Q05_SPR
Semelhante a unisys 4Q05_SPR (17)
Mais de finance36
Último
Último (20)
unisys 4Q05_SPR
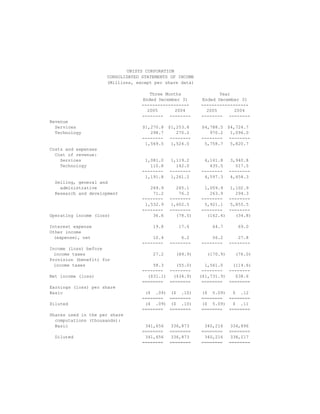
- 1. UNISYS CORPORATION CONSOLIDATED STATEMENTS OF INCOME (Millions, except per share data) Three Months Year Ended December 31 Ended December 31 ------------------ ------------------ 2005 2004 2005 2004 -------- -------- -------- -------- Revenue Services $1,270.8 $1,253.8 $4,788.5 $4,724.7 Technology 298.7 270.2 970.2 1,096.0 -------- -------- -------- -------- 1,569.5 1,524.0 5,758.7 5,820.7 Costs and expenses Cost of revenue: Services 1,081.0 1,119.2 4,161.8 3,940.8 Technology 110.8 142.0 435.5 517.5 -------- -------- -------- -------- 1,191.8 1,261.2 4,597.3 4,458.3 Selling, general and administrative 269.9 265.1 1,059.9 1,102.9 Research and development 71.2 76.2 263.9 294.3 -------- -------- -------- -------- 1,532.9 1,602.5 5,921.1 5,855.5 -------- -------- -------- -------- Operating income (loss) 36.6 (78.5) (162.4) (34.8) Interest expense 19.8 17.6 64.7 69.0 Other income (expense), net 10.4 6.2 56.2 27.8 -------- -------- -------- -------- Income (loss) before income taxes 27.2 (89.9) (170.9) (76.0) Provision (benefit) for income taxes 58.3 (55.0) 1,561.0 (114.6) -------- -------- -------- -------- Net income (loss) ($31.1) ($34.9) ($1,731.9) $38.6 ======== ======== ======== ======== Earnings (loss) per share Basic ($ .09) ($ .10) ($ 5.09) $ .12 ======== ======== ======== ======== Diluted ($ .09) ($ .10) ($ 5.09) $ .11 ======== ======== ======== ======== Shares used in the per share computations (thousands): Basic 341,656 336,873 340,216 334,896 ======== ======== ======== ======== Diluted 341,656 336,873 340,216 338,217 ======== ======== ======== ========
- 2. UNISYS CORPORATION SEGMENT RESULTS (Millions) Elimi- Total nations Services* Technology* -------- -------- -------- ---------- Three Months Ended December 31, 2005 ------------------ Customer revenue $1,569.5 $1,270.8 $298.7 Intersegment ($66.9) 4.5 62.4 -------- -------- -------- -------- Total revenue $1,569.5 ($66.9) $1,275.3 $361.1 ======== ======== ======== ======== Gross profit percent 24.1% 13.6% 56.2% ======== ======== ======== Operating profit (loss) percent 2.3% (2.0%) 16.7% ======== ======== ======== Three Months Ended December 31, 2004 ------------------ Customer revenue $1,524.0 $1,253.8 $270.2 Intersegment ($85.2) 3.6 81.6 -------- -------- -------- -------- Total revenue $1,524.0 ($85.2) $1,257.4 $351.8 ======== ======== ======== ======== Gross profit percent 17.2% 6.2% 54.2% ======== ======== ======== Operating profit (loss) percent (5.2%) (9.4%) 12.0% ======== ======== ======== Year Ended December 31, 2005 ------------------ Customer revenue $5,758.7 $4,788.5 $970.2 Intersegment ($259.6) 18.7 240.9 -------- -------- -------- -------- Total revenue $5,758.7 ($259.6) $4,807.2 $1,211.1 ======== ======== ======== ======== Gross profit percent 20.2% 12.1% 48.4% ======== ======== ======== Operating profit (loss) percent (2.8%) (4.3%) 4.2% ======== ======== ======== Year Ended December 31, 2004 ------------------ Customer revenue $5,820.7 $4,724.7 $1,096.0 Intersegment ($251.8) 18.1 233.7 -------- -------- -------- -------- Total revenue $5,820.7 ($251.8) $4,742.8 $1,329.7 ======== ======== ======== ======== Gross profit percent 23.4% 14.8% 51.7% ======== ======== ======== Operating profit (loss) percent (0.6%) (1.7%) 10.2% ======== ======== ======== * 2004 results exclude charges for cost reductions and related actions as announced on October 6, 2004
- 3. UNISYS CORPORATION CONSOLIDATED BALANCE SHEETS (Millions) December 31, December 31, 2005 2004 ---------- ---------- Assets Current assets Cash and cash equivalents $642.5 $660.5 Accounts and notes receivable, net 1,111.5 1,136.8 Inventories Parts and finished equipment 103.4 93.7 Work in process and materials 90.7 122.4 Deferred income taxes 68.2 291.8 Prepaid expense and other current assets 137.0 112.4 ---------- ---------- Total 2,153.3 2,417.6 ---------- ---------- Properties 1,320.8 1,305.5 Less accumulated depreciation and amortization 934.4 881.4 ---------- ---------- Properties, net 386.4 424.1 ---------- ---------- Outsourcing assets, net 416.0 431.9 Marketable software, net 327.6 336.8 Investments at equity 207.8 197.1 Prepaid pension cost 66.1 52.5 Deferred income taxes 138.4 1,394.6 Goodwill 192.0 189.9 Other long-term assets 141.3 176.4 ---------- ---------- Total $4,028.9 $5,620.9 ========== ========== Liabilities and stockholders' equity Current liabilities Notes payable $18.1 $1.0 Current maturities of long-term debt 58.8 151.7 Accounts payable 444.6 487.4 Other accrued liabilities 1,293.3 1,382.7 ---------- ---------- Total 1,814.8 2,022.8 ---------- ---------- Long-term debt 1,049.0 898.4 Accrued pension liabilities 506.9 537.9 Other long-term liabilities 690.8 655.3 Stockholders' equity (deficit) Common stock 3.4 3.4 Accumulated deficit (2,108.1) (376.2) Other capital 3,917.0 3,883.8 Accumulated other comprehensive loss (1,844.9) (2,004.5) ---------- ---------- Stockholders' equity (deficit) (32.6) 1,506.5 ---------- ---------- Total $4,028.9 $5,620.9 ========== ==========
- 4. UNISYS CORPORATION CONSOLIDATED STATEMENTS OF CASH FLOWS (Millions) Year Ended December 31 ------------------- 2005 2004 ------- ------- Cash flows from operating activities Net income (loss) ($1,731.9) $38.6 Add (deduct) items to reconcile net income (loss) to net cash provided by operating activities: Equity income (9.2) (16.1) Depreciation and amortization of properties 120.7 136.5 Depreciation and amortization of outsourcing assets 128.8 123.3 Amortization of marketable software 124.7 134.2 Impairment charge related to outsourcing assets 125.6 Gain on sale of facility (15.8) Loss on the tender of debt 10.7 Decrease (increase) in deferred income taxes, net 1,491.2 (41.2) Decrease (increase) in receivables, net 34.8 (61.8) Decrease in inventories 20.9 23.0 Decrease in accounts payable and other accrued liabilities (61.4) (122.1) Increase in other liabilities 149.4 111.3 Increase in other assets (34.3) (16.2) Other 53.4 34.7 ------- ------- Net cash provided by operating activities 282.0 469.8 ------- ------- Cash flows from investing activities Proceeds from investments 7,726.2 6,026.5 Purchases of investments (7,709.6) (6,054.3) Investment in marketable software (125.7) (119.6) Capital additions of properties (112.0) (137.0) Capital additions of outsourcing assets (143.8) (177.5) Purchases of businesses (1.5) (19.4) Proceeds from sales of properties and businesses 23.4 1.7 ------- ------- Net cash used for investing activities (343.0) (479.6) ------- ------- Cash flows from financing activities Net proceeds from (reduction in) short-term borrowings 17.2 (20.0) Proceeds from employee stock plans 12.8 38.8 Payments of long-term debt (509.1) (3.5) Proceeds from issuance of long-term debt 541.5 ------- ------- Net cash provided by financing activities 62.4 15.3 ------- ------- Effect of exchange rate changes on cash and cash equivalents (19.4) 19.1 ------- ------- (Decrease) increase in cash and cash equivalents (18.0) 24.6 Cash and cash equivalents, beginning of period 660.5 635.9 ------- ------- Cash and cash equivalents, end of period $642.5 $660.5 ======= =======
- 5. Reconciliation of GAAP to Non-GAAP Financial Information The preceding release presents information with and without pension expense. Unisys believes that this information will enhance an overall understanding of its financial performance due to the significant change in pension expense from period to period and the non-operational nature of pension expense. The presentation of non-GAAP information is not meant to be considered in isolation or as a substitute for results prepared in accordance with accounting principles generally accepted in the United States.
- 6. UNISYS CORPORATION RECONCILIATION OF GAAP TO NON-GAAP CONSOLIDATED STATEMENTS OF INCOME (Millions, except per share data) Three Months Ended December 31, 2005 ---------------------------- US GAAP Less Without as Pension Pension Reported Expense Expense -------- -------- -------- Revenue $1,569.5 $1,569.5 Costs and expenses Cost of revenue 1,191.8 ($30.8) 1,161.0 Selling, general and administrative 269.9 (8.7) 261.2 Research and development 71.2 (4.8) 66.4 -------- -------- -------- 1,532.9 (44.3) 1,488.6 -------- -------- -------- Operating income 36.6 44.3 80.9 Interest expense 19.8 19.8 Other income (expense), net 10.4 10.4 -------- -------- -------- Income before income taxes 27.2 44.3 71.5 Provision for income taxes 58.3 5.1 63.4 -------- -------- -------- Net income (loss) ($31.1) $39.2 $8.1 ======== ======== ======== Earnings (loss) per share ($ .09) $ .11 $ .02 ======== ======== ======== Three Months Ended December 31, 2004 ---------------------------- US GAAP Less Without as Pension Pension Reported Expense Expense -------- -------- -------- Revenue $1,524.0 $1,524.0 Costs and expenses Cost of revenue 1,261.2 ($16.8) 1,244.4 Selling, general and administrative 265.1 (4.2) 260.9 Research and development 76.2 (2.1) 74.1 -------- -------- -------- 1,602.5 (23.1) 1,579.4 -------- -------- -------- Operating income (loss) (78.5) 23.1 (55.4) Interest expense 17.6 17.6 Other income (expense), net 6.2 6.2 -------- -------- -------- Income (loss) before income taxes (89.9) 23.1 (66.8) Provision (benefit) for income taxes (55.0) 7.4 (47.6) -------- -------- -------- Net income (loss) ($34.9) $15.7 ($19.2) ======== ======== ======== Earnings (loss) per share ($ .10) $ .05 ($ .05) ======== ======== ========
- 7. UNISYS CORPORATION RECONCILIATION OF GAAP TO NON-GAAP CONSOLIDATED STATEMENTS OF INCOME (Millions, except per share data) Year Ended December 31, 2005 ---------------------------- US GAAP Less Without as Pension Pension Reported Expense Expense -------- -------- -------- Revenue $5,758.7 $5,758.7 Costs and expenses Cost of revenue 4,597.3 ($125.8) 4,471.5 Selling, general and administrative 1,059.9 (35.8) 1,024.1 Research and development 263.9 (19.5) 244.4 -------- -------- -------- 5,921.1 (181.1) 5,740.0 -------- -------- -------- Operating income (loss) (162.4) 181.1 18.7 Interest expense 64.7 64.7 Other income (expense), net 56.2 56.2 -------- -------- -------- Income (loss) before income taxes (170.9) 181.1 10.2 Provision (benefit) for income taxes 1,561.0 21.7 1,582.7 -------- -------- -------- Net income (loss) ($1,731.9) $159.4 ($1,572.5) ======== ======== ======== Earnings (loss) per share ($ 5.09) $ .47 ($ 4.62) ======== ======== ======== Year Ended December 31, 2004 ---------------------------- US GAAP Less Without as Pension Pension Reported Income Income -------- -------- -------- Revenue $5,820.7 $5,820.7 Costs and expenses Cost of revenue 4,458.3 ($67.2) 4,391.1 Selling, general and administrative 1,102.9 (18.3) 1,084.6 Research and development 294.3 (8.1) 286.2 -------- -------- -------- 5,855.5 (93.6) 5,761.9 -------- -------- -------- Operating income (loss) (34.8) 93.6 58.8 Interest expense 69.0 69.0 Other income (expense), net 27.8 27.8 -------- -------- -------- Income (loss) before income taxes (76.0) 93.6 17.6 Provision (benefit) for income taxes (114.6) 30.0 (84.6) -------- -------- -------- Net income $38.6 $63.6 $102.2 ======== ======== ======== Earnings per share $ .11 $ .19 $ .30 ======== ======== ========
- 8. UNISYS CORPORATION RECONCILIATION OF GAAP TO NON-GAAP SEGMENT RESULTS OF OPERATIONS (Millions) Three Months Ended December 31, 2005 ---------------------------- Less Without As Pension Pension Reported Expense Expense -------- -------- -------- Services Segment Total revenue $1,275.3 $1,275.3 Gross profit 173.9 ($29.8) 203.7 % of revenue 13.6% 16.0% Operating income (loss) (25.3) (37.0) 11.7 % of revenue -2.0% 0.9% Technology Segment Total revenue 361.1 361.1 Gross profit 202.9 (1.0) 203.9 % of revenue 56.2% 56.5% Operating income 60.2 (7.3) 67.5 % of revenue 16.7% 18.7% Total Company Total revenue 1,569.5 1,569.5 Gross profit 377.7 (30.8) 408.5 % of revenue 24.1% 26.0% Operating income 36.6 (44.3) 80.9 % of revenue 2.3% 5.2% Three Months Ended December 31, 2004 ---------------------------- Less Without As Pension Pension Reported Expense Expense -------- -------- -------- Services Segment * Total revenue $1,257.4 $1,257.4 Gross profit 78.2 ($16.4) 94.6 % of revenue 6.2% 7.5% Operating income (loss) (118.0) (20.1) (97.9) % of revenue -9.4% -7.8% Technology Segment * Total revenue 351.8 351.8 Gross profit 190.6 (0.4) 191.0 % of revenue 54.2% 54.3% Operating income 42.0 (3.0) 45.0 % of revenue 12.0% 12.8% Total Company Total revenue 1,524.0 1,524.0 Gross profit 262.8 (16.8) 279.6 % of revenue 17.2% 18.3% Operating income (loss) (78.5) (23.1) (55.4) % of revenue -5.2% -3.6% * 2004 results exclude charges for cost reductions and related actions as announced on October 6, 2004
- 9. UNISYS CORPORATION RECONCILIATION OF GAAP TO NON-GAAP SEGMENT RESULTS OF OPERATIONS (Millions) Year Ended December 31, 2005 ---------------------------- Less Without As Pension Pension Reported Expense Expense -------- -------- -------- Services Segment Total revenue $4,807.2 $4,807.2 Gross profit 580.5 ($121.9) 702.4 % of revenue 12.1% 14.6% Operating income (loss) (207.0) (151.6) (55.4) % of revenue -4.3% -1.2% Technology Segment Total revenue 1,211.1 1,211.1 Gross profit 585.7 (3.9) 589.6 % of revenue 48.4% 48.7% Operating income 51.0 (29.5) 80.5 % of revenue 4.2% 6.6% Total Company Total revenue 5,758.7 5,758.7 Gross profit 1,161.4 (125.8) 1,287.2 % of revenue 20.2% 22.4% Operating income (loss) (162.4) (181.1) 18.7 % of revenue -2.8% 0.3% Year Ended December 31, 2004 ---------------------------- Less Without As Pension Pension Reported Income Income -------- -------- -------- Services Segment * Total revenue $4,742.8 $4,742.8 Gross profit 702.2 ($65.7) 767.9 % of revenue 14.8% 16.2% Operating income (loss) (82.8) (81.1) (1.7) % of revenue -1.7% 0.0% Technology Segment * Total revenue 1,329.7 1,329.7 Gross profit 686.8 (1.5) 688.3 % of revenue 51.7% 51.8% Operating income 136.0 (12.5) 148.5 % of revenue 10.2% 11.2% Total Company Total revenue 5,820.7 5,820.7 Gross profit 1,362.4 (67.2) 1,429.6 % of revenue 23.4% 24.6% Operating income (loss) (34.8) (93.6) 58.8 % of revenue -0.6% 1.0% * 2004 results exclude charges for cost reductions and related actions as announced on October 6, 2004