2. CONTENTS
COVER PHOTO
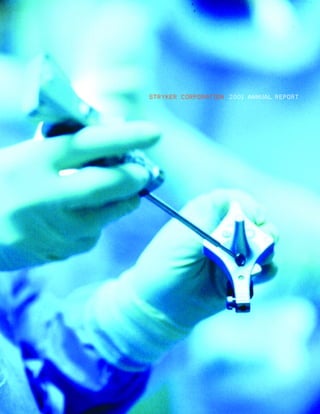
Stryker’s new image-guided 03 Letter to Shareholders
system for total knee 06 Anticipate the Future
replacement helps the surgeon 10 Build on the Best
achieve highly accurate
14 Drive Innovation
alignment and optimal soft
20 Lead the Market
tissue balancing.
25 Financial Review
3. Stryker Corporation develops, manufactures and markets specialty surgical and medical prod-
ucts worldwide. These products include orthopaedic implants, trauma systems, the bone
growth factor osteogenic protein-1, powered surgical instruments, endoscopic systems and
patient care and handling equipment. The Company also provides outpatient rehabilitative health
services in the United States. Stryker executes through 14 product and sales divisions, each of
which drives toward the Company’s exacting standards for quality, service, and growth.
STRYKER PRODUCT AND SALES DIVISIONS
O RT H O PA E D I C S
Orthopaedic Implants Trauma Systems Surgical Instruments Biotechnology
and Equipment
Stryker Howmedica Osteonics Stryker Trauma Stryker Instruments Stryker Biotech
Orthopaedic reconstructive Trauma-related products Powered surgical instruments Osteogenic protein-1 (OP-1)
products including hip, knee including nailing, plating and and other products, such bone growth factor. Production
and shoulder implants. external fixation systems. as lavage systems and cement facilities in Massachusetts,
Production facilities in New Production facilities in injection systems. Production New Hampshire and Ireland.
Jersey, Ireland and France. New Jersey, Germany and facilities in Michigan, Puerto
Switzerland. Rico and Ireland.
Stryker Spine
Spinal implant products. Stryker Leibinger Stryker Endoscopy
Production facilities in France. Plating systems, instruments Medical video-imaging
and related products for equipment and instruments for
craniomaxillofacial surgery; arthroscopy and general
systems for image-guided surgery. Production facilities in
surgery. Production facilities in California and Puerto Rico.
Michigan and Germany.
4. Financial Highlights
(in millions, except per share amounts)
2001 2000 % Change
Net sales $2,602.3 $2,289.4 14
Earnings before income taxes and extraordinary item 405.7 334.9 21
Income taxes 133.9 113.9 18
Earnings before extraordinary item 271.8 221.0 23
Extraordinary loss, net of income taxes (4.8) – –
Net earnings $267.0 $221.0 21
Diluted earnings per share of common stock:
Before extraordinary item $1.34 $1.10 22
Extraordinary loss ($.02) – –
Net earnings $1.32 $1.10 20
MEDICAL EQUIPMENT R E H A B I L I TAT I V E M E D I C A L I N T E R N AT I O N A L S A L E S
S E RV I C E S
Stryker Medical Physiotherapy Associates Stryker Europe Stryker Canada
Specialty hospital beds Outpatient rehabilitation Sale and distribution of Stryker Sale and distribution of Stryker
and stretchers, general services with a focus products throughout Europe, products in Canada.
patient-room beds and emer- on physical and occupational the Middle East and Africa.
gency medical service cots. therapy. More than 300 Stryker Latin America
Production facilities locations throughout the Stryker Japan Sale and distribution of Stryker
in Michigan and Canada. United States. Sale and distribution of Stryker products throughout Central
products in Japan. and South America, Mexico
and the Caribbean.
Stryker Pacific
Sale and distribution of Stryker
products throughout
Asia and the Pacific, with the
exception of Japan.
5. Execution is Everything
Stryker Corporation holds itself to high standards of performance that benefit our customers,
patients, employees and shareholders. Across our divisions, we execute consistently on all
aspects of our business to deliver outstanding results. We are able to develop, manufacture and
market best-in-class medical and surgical products because of our strategic vision, installed
technology and intellectual property, innovation and market leadership. This focus on execution
is responsible for our 25-year compound annual net earnings growth rate of 25 percent.
267.0
250
NET EARNINGS *
($ millions)
221.0
25-Year Compound Annual
Growth Rate of 25%
200
150
125.3
104.5
100
87.0
72.4
60.2
60.0
47.7
50
33.1
23.6
19.4
19.2
15.9
12.7
* Before 1990 extraordinary gain;
10.2
8.6
1998 and 1999 include
7.1
5.9
4.8
3.9
3.2
2.6
1.9
1.1
1.5
Howmedica acquisition-related
costs and charges.
76 77 78 79 80 81 82 83 84 85 86 87 88 89 90 91 92 93 94 95 96 97 98 99 00 01
6.
7. 02 03
To Our Shareholders:
A strongly held belief at Stryker is the importance of setting challenging goals and continually
executing on all aspects of business fundamentals in order to achieve our targets. Our perform-
ance in 2001 bears out this approach. The Company had a very successful year, delivering solid
sales growth, launching innovative new products and reaching a long-sought milestone with the
marketing authorization for our bone growth factor, OP-1, for certain specific indications involving
long-bone fractures.
We have exceeded our goal of at least 20 percent net earnings growth, which we believe is
the best test of our ability to execute. For the year ended December 31, 2001, net sales rose 14
percent, to $2,602 million, versus $2,289 million in 2000. Earnings before an extraordinary item
increased 23 percent, to $272 million. Our diluted earnings per share before an extraordinary
item increased 22 percent over 2000, to $1.34. Net earnings were $267 million, a 21 percent
increase over the prior year. Cash flow from operations finished the year at $468 million.
OP-1 Gains Marketing Authorization New Product Group Formed
In , with the marketing approval of op-1 (osteogenic Recognizing both the potential and the challenges involved
protein-), our patented recombinant protein that induces in the commercialization of op-1, the Company created a
bone formation, we reached a goal at which we have been new product group, Stryker Biotech, Spine and Trauma,
aiming for years. op-1 was approved in Australia, the under the leadership of newly appointed Group President
Jamie Kemler. Jamie, who joined Stryker in as General
European Union and the United States for treating specific
trauma indications. Because the U.S. approval was the first Manager of Stryker Biotech, became President of that divi-
sion in and directed the regulatory process for op-1. In
for a bone morphogenic protein, it was especially challeng-
ing. The process involved significant information requests his new position, Jamie is also responsible for Stryker Spine
from the U.S. Food and Drug Administration and resulted and Stryker Trauma, the Company’s two fastest-growing
in a narrowly defined approved indication under a Human- orthopaedic implant businesses. Spine and trauma indica-
itarian Device Exemption. More detailed information on tions will be key to the long-term success of op-1. In addi-
the approved indications is included later in this report. tion to the synergies among their products, our biotech,
Even as we celebrate this major accomplishment, spine and trauma divisions are all organized globally.
we recognize that there is still much to be done in order to
make op-1 a commercial success. As first steps, we have
developed sales strategies for each of the three regions and
launched the product in all of them. Concurrently, we are
pursuing broader applications for op-1 by conducting clini-
cal trials for spinal indications in North America and Japan.
8. To spearhead the commercialization of op-1, we have Stryker from Howmedica when that company was acquired
in late and played a vital role in the integration of
promoted Tim Scannell to Vice President and General
Manager of Stryker Biotech. Tim was formerly Executive Howmedica and Stryker’s former Osteonics division into
the current Stryker Howmedica Osteonics. In early ,
Vice President of Stryker Endoscopy, where he was respon-
sible for that rapidly growing division’s sales, marketing and Ron was promoted to President of Stryker Europe. Under
operations. his leadership, Stryker Europe has strengthened its man-
agement team, sharpened its customer focus and improved
its operating results. Ron is now responsible for Stryker’s
Excellent Performance by Stryker Howmedica
sales operations in Europe, Japan and the Pacific.
Osteonics and Stryker MedSurg Groups
Our U.S.-based product and sales groups delivered double- Luciano Cattani has succeeded Ron Lawson as Presi-
digit growth in . Stryker Howmedica Osteonics, led by dent of Stryker Europe. He joined Stryker in as Senior
Group President Ned Lipes, launched new reconstructive Vice President of Stryker Europe after a long and success-
implant products and ably marketed its strong product port- ful career with Pfizer Italy and Howmedica Europe. We
folio while making major manufacturing and distribution believe that Luciano will continue the leadership that Ron
improvements and consolidating operations at its new cam- brought to Stryker Europe.
pus in Mahwah, New Jersey. The Stryker MedSurg Group, Yoshi Nakazawa, President of Stryker Japan, has done
under Group President Si Johnson, turned in an excellent an excellent job this year managing challenging conditions
performance with particularly strong showings by the in Japan, including price cuts. We expect him to continue
Endoscopy and Medical divisions. In addition, our service his success with support from Ron Lawson, with whom he
division, Physiotherapy Associates, increased revenues by had a long working relationship at Howmedica.
double digits through both acquisitions and same-store In December, Bill Laube, President of Stryker Pacific,
growth. announced that he would retire from Stryker at year-end
after years of service. At the time of his retirement, Bill
was the Company’s most tenured officer. He joined Stryker
A Group Approach to International Sales
in as President of Stryker International and tirelessly
Stryker’s reputation as an outstanding sales organization is
largely attributable to the concerted focus we give to every traveled the globe, single-handedly establishing most of our
aspect of the sales process. We have taken that focus one international distributor relationships and positioning us as
step further by promoting Ron Lawson to the new position a leading worldwide orthopaedic device company. As a
of Group President, Stryker International. Ron joined result of Bill’s pioneering efforts, Stryker’s international
sales—a mere million when he joined the Company—
reached over million in . In , Bill was
appointed to the presidency of Stryker Pacific and devel-
oped business in the region from his base in Hong Kong. I
would like to pay my deepest personal respects to Bill for his
many achievements as Stryker’s “Mr. International,” and to
thank him for agreeing to serve as an advisor to me as
Chairman of Stryker Pacific.
9. 04 05
Bill Laube’s retirement has occasioned several other which are regulated in every market in which we compete,
management changes at Stryker, and we are proud that our we have formed a steering committee to provide greater
“deep bench” has allowed us to make these changes with corporate oversight of our worldwide quality and regulatory
proven members of our team. All of these promotions activities. This committee will facilitate the implementation
will support our strong sales organizations and product of common standards, metrics and best practices across
divisions. divisions.
Andrew Fox-Smith has been promoted to Vice Presi- With all of the Company’s strengths, and with out-
dent and General Manager of Stryker Pacific, based in standing line managers—Si Johnson, Jamie Kemler, Ron
Hong Kong and reporting to Ron Lawson. Andrew, who Lawson and Ned Lipes—heading up our four groups, I look
was most recently Stryker’s Managing Director for forward to a future of high growth for Stryker. I want to
U.K./Ireland/South Africa, was instrumental in the success- thank our shareholders for their confidence in the Company
and our employees for their hard work in .
ful integration of Howmedica and Stryker in the United
Kingdom and Ireland. Earlier, with Howmedica, he gained
broad experience in the Pacific as a leading sales representa- Sincerely,
tive in Australia and a Regional Manager for Asia.
Pat Beyer, most recently Vice President and General
Manager of Stryker Medical, was appointed Managing
Director for U.K./Ireland/South Africa. Pat held a number
of key positions for Stryker in Europe before returning to
Kalamazoo in to lead our founding division, where he
has grown both sales and operating income at an excep- John W. Brown
tional rate. Jim Cunniff, formerly Vice President of Mar- Chairman, President and Chief Executive Officer
keting at Stryker Medical, has been promoted to Vice
President and General Manager of the division.
Continual Improvement
Stryker is committed to delivering superior results to our
shareholders. To make good on that commitment, we real-
ize that we must continually improve our work in product
development, manufacturing and distribution, and sales.
Because quality is a primary requirement for our products,
10. ANTICIPATE THE FUTURE
Stryker’s vision of the future encompasses many factors. Emerging medical needs are often
defined by societal conditions. In the United States, Europe and Japan, the world’s three
major medical markets, an aging population creates demand for more orthopaedic solutions.
At the same time, this population has greater expectations for activity, culturally appropriate
solutions and overall quality of life than ever before, pointing to a need for innovative, high-
performance products. Broad advances in technology, such as the advent of biotechnology
or wireless communications, present opportunities to customize and apply these innovations
to Stryker’s existing and potential markets.
11. 06 07
MEDICAL NEED
A D VA N C I N G T E C H N O L O G Y
VISION R&D
PILOT STUDIES
R E G U L AT O RY P R O C E S S
In the United States, the Food and Drug Administra-
A Global View
Stryker’s vision of the future in orthopaedics was confirmed tion (fda) approved op-1 as a humanitarian use device, one
in by the marketing approval and subsequent launches that may be used to treat conditions that are manifested in
fewer than , patients in the United States per year. The
of op-1, our proprietary bone growth factor, in Australia, the
European Union and the United States for a specific approved indication in the United States is as an alternative
approved indication in each jurisdiction. These approvals to autograft in recalcitrant long-bone nonunions where
were the first for a bone morphogenic protein in each of the autograft is unfeasible and alternative treatments have failed.
three jurisdictions, and they led to our next step into the We launched op-1 successively in Australia, Europe and
future—the creation of the Biotech, Spine and Trauma the United States during the spring, summer and fall. While
Group. This group has a global focus in product develop- we have developed sales strategies appropriate to each
ment and manufacturing, and more than percent of its regional market and approved indication, they all share the
products are sold outside the United States. We expect that primary objective of educating orthopaedic surgeons about
this new structure will further accelerate the fast-growing the product. In the United States and Australia, we have
spine and trauma divisions of the Company, and that it will developed specialist sales forces, and in Europe, we are sell-
enable us to enhance future opportunities for synergy ing on a country-by-country basis via a specially trained
between spine and trauma products and op-1. group of our trauma sales representatives.
Each of the three specific approved indications for Stryker continues to seek approval for broader indica-
op-1 involves nonunion—or difficult-to-heal—fractures of tions for op-1. We have initiated a multicenter pivotal trial
long bones. The op-1 is mixed with a collagen carrier and for posterolateral spine fusion in the United States and
Canada, and we expect to complete enrollment in .
wetted to form a paste that is surgically implanted into the
fracture gap. Australia, where op-1 has been employed for Additionally, enrollment in a single-site clinical feasibility
several years on a compassionate use basis, issued the broad- study has been completed for a similar indication in Japan,
est approval, covering the treatment of long-bone fractures and we are in the process of submitting an application
secondary to trauma. The European authorization covers for a multicenter trial. The market for posterolateral spine
the treatment of nonunion of the tibia of at least nine treatment is large and growing. The current clinical investi-
months’ duration, secondary to trauma, in skeletally mature gations of op-1 could lead both to better outcomes for
patients for whom autograft has failed or is not feasible. patients and cost savings for the health-care system.
12. OP-1
>>
Twenty years ago, Stryker
saw the potential that biologics
held for orthopaedics. Although
the biotechnology industry
was then in its infancy and its
products unproven, we invested
in a proprietary, recombinant
version of the bone growth fac-
tor osteogenic protein-1 (OP-1)
and persevered through years of
development, clinical trials
and regulatory filings. In 2001,
our vision was validated
with marketing authorization for
OP-1 by Australia and the
European Union and approval as
a humanitarian use device
by the United States for specific
indications involving difficult
long-bone fractures. Stryker is
also investigating spinal
applications for OP-1 through
clinical trials in North America
and Japan.
•••
13. 08 09
REFLEX
>>
ANTERIOR CERVICAL PLATE
Stryker Spine entered the The spine division also intro-
cervical fixation market in 2001 duced two other new products, a
with the Reflex system, which stainless steel version of the
generated excellent customer popular Xia fixation system and,
acceptance in the United States outside the United States, the
and Europe. This innovative Stabilis anterior interbody fusion
product addresses the increasing device. Stryker Spine significantly
demand for fixation products increased manufacturing
for the upper part of the spine. The capacity at its production facility in
Reflex system features Stryker’s France, inaugurated dedicated
proprietary TMZF advanced alloy sales in Japan’s major urban
material, a one-step locking centers and further strengthened
system and simple-to-use instru- its U.S. sales force.
ment technology. •••
T2
>> IM NAILING SYSTEM
Stryker Trauma’s T2 nailing facilitate rapid development of
system, launched in the second the T2, which earned immediate
half of 2001 in the United States, favorable response from our
Europe and Japan, provides customers. In addition, Stryker
a wide range of fracture repair Trauma further specialized
options for long bones using a its three production plants in
common set of instruments. Switzerland and Germany,
The expertise of the same engi- fine-tuned inventory control and
neering team and manufacturing initiated a dedicated sales force
personnel who created the in Japan’s largest cities.
well-established, best-in-class •••
Gamma family of nails for
hip fractures was leveraged to
14. BUILD ON THE BEST
In developing new products and extended lines, Stryker draws on the Company’s rich intel-
lectual property portfolio. We incorporate design philosophies, specialized design and engi-
neering features and proprietary materials to create improved and next-generation products
and more comprehensive lines. Prime examples include Crossfire, our patented highly
crosslinked polyethylene, which is now incorporated into nearly 70 percent of our hip implant
liners, and the unique Scorpio knee geometry, which serves as the platform for several
advanced knee systems. In both hip and knee implants, we have extended our successful
product lines to create revision and early intervention implants and to address specialized
regional and clinical needs.
15. 10 11
I N S TA L L E D T E C H N O L O G Y
I N T E L L E C T U A L P R O P E RT Y
LEVERAGE C O L L A B O R AT I O N
N E W A P P L I C AT I O N S
LINE EXTENSIONS
intraoperative choice. In —its first full year on the mar-
Capitalizing on Stryker’s Strengths
With established intellectual property and strong patent ket—our Scorpio ts revision knee system achieved stellar
positions, Stryker executes to extend the reach of its mate- sales growth. The Scorpio ts is designed to work with the
rials and technology within and across its product lines and Modular Rotating Hinge (mrh)—also introduced in
—and the Modular Revision System (mrs). Using a
divisions. For example, our tmzf alloy, a titanium-based
metal with increased flexibility and strength, was developed single set of bone cuts, the surgeon can begin the procedure
by Stryker Howmedica Osteonics for our Citation hip sys- and then choose the most appropriate of these three
tem. It is now used not only in other hip implants, but also implants depending on the amount of bone remaining. Our
in Stryker Spine’s new Reflex cervical system. revision hip portfolio also provides an extended-indication
Outstanding designs and technologies also provide product line to address problems including bone loss and
platforms for new products that address different needs. anatomical deficiencies.
The Zoom drive, the only motorized patient handling We have taken a similar approach to addressing
device that increases patient mobility, eliminates the need regional needs, particularly in Japan, which has different
for transfers to accomplish specialized medical procedures size, range-of-motion and flexion requirements than the
United States and Europe. In , we adapted our Scorpio
and reduces strain on hospital staff, was launched by Stryker
Medical in late in critical care beds. In , we intro- knee for Japan, branding it Superflex, and in we did the
duced the Zoom drive in medical-surgical beds. The Xia same with our Eon and Secur-fit hips, known as Super Eon
Spinal System, a titanium rod and screw system that was and Super Secur-fit in their Japanese versions.
successfully launched in , now has a counterpart in
stainless steel designed to address deformities. The newly
introduced t nail for long-bone fractures builds on our long
history of innovation in intramedullary nailing technology.
In hip and knee implants, we offer comprehensive lines
to fill every need from early intervention to revision. By
using the same geometries and instrumentation throughout
a line, we offer the surgeon both ease of use and greater
16. XIA
>>
STAINLESS STEEL
Much of the growth in Stryker’s
spinal business in the past two
years has been attributable to the
Xia Spinal System, a fixation
system that uses rods and screws
to stabilize the spine and help
relieve pain. In 2001, we
expanded the utility of this popular
system with the introduction
of Xia Stainless Steel for use
in deformity correction indications,
including scoliosis.
•••
SCORPIO+
>> MOBILE BEARING KNEE SYSTEM
This year, Stryker extended the single-radius design lends itself
Scorpio knee geometry to enter particularly well to a mobile
the mobile bearing knee market in bearing system, and Stryker has
Europe and Australia. We are engineered unique, patented
currently anticipating marketing features into Scorpio+, which
approval for this system in Japan, allow the surgeon to make
and we have initiated an intraoperative choices about the
Investigational Device Exemption retention or removal of the
(IDE) study in the United States. cruciate ligament.
The Scorpio+ system tibial insert •••
allows rotation to occur more
naturally, finding its position
according to the anatomy of the
individual patient. Scorpio’s
17. 12 13
ACCOLADE
>>
TMZF FEMORAL HIP SYSTEM
The sales growth of the Accolade coating, Purefix HA, which has
hip, launched in 2001, demon- yielded unprecedented clinical
strates the importance of applying results in a multicenter study
installed technology and followed for 13 years. Combining
proprietary materials to new prod- these materials with the tapered
ucts. This stem implant is made wedge stem geometry, the
of TMZF, Stryker’s innovative beta Accolade system is performing
titanium alloy, which has demon- up to the promise of its name.
strated 25 percent greater flexibil- •••
ity than competing materials while
also maintaining more than
20 percent higher tensile strength.
The stem has a coating of
Stryker’s patented hydroxylapatite
18. DRIVE INNOVATION
Today, innovation is essential to success, whether the goal is to enter a market, become a
major player or maintain a leadership position. Even in emerging markets, there is high
demand for advanced technology that better serves patients, offers greater ease of use to
physicians and clinical personnel and ultimately drives down costs for hospitals. Stryker exe-
cutes on our long-term commitment to research and development and continuous improve-
ment in order to meet this demand. We recognize that innovation involves not only developing
new products, but also looking creatively at existing products and market opportunities.
19. 14 15
EMERGING TECHNOLOGY
A D VA N C E D M AT E R I A L S
SOLUTIONS N E W A P P L I C AT I O N S
I M P R O V E D PAT I E N T O U T C O M E S
G R E AT E R C U S T O M E R E F F I C I E N C I E S
Howmedica Osteonics’ knee implants. In Germany, where
Innovation in the OR
Stryker has introduced innovations that are changing the the reception of this product has been particularly enthusi-
operating-room experience for patients, surgeons and staff astic, Stryker has been steadily generating new customers
while supporting the overall operations and marketing for both the navigation system and knee implants them-
objectives of hospitals and health-care systems. selves. Approximately half of the German knee navigation
Stryker Endoscopy’s Endosuites, for example, provide a system customers had not been using Stryker implants prior
major advance in OR design and functionality through the to purchasing the system but have since converted to our
integration of communications technology to support surgi- lines. We are now seeing similar opportunities in other
cal procedures. Introduced in 1992 and now in use in more European countries.
than facilities in the United States and abroad, these Execution of this product launch required collaboration
fully functioning operating suites support minimally inva- among three Stryker divisions. All of the navigation soft-
sive surgery across virtually all specialties. Stryker ware components are made in Leibinger’s vertically inte-
Endoscopy has continually improved the communications grated facility in Germany. Stryker Instruments developed
devices and regularly added new components—in , a and manufactures the instrumentation. Stryker Howmedica
video camera with fully digital output and surgeons’ digital Osteonics contributed its orthopaedic expertise to assure
video loupes. that the system would be compatible with its implants. This
Stryker Leibinger has been an industry innovator in the division and Leibinger have teamed up to sell the system in
development of image-guided surgical systems, producing the United States.
In , Stryker Medical, our founding division,
the only such systems that offer active two-way wireless
communication between the surgical instrument and the brought a revolutionary product for the OR to the market.
camera. Leibinger’s system for image-guided functional The Trio system redefines the actual operating platform,
neurosurgery was introduced in , and the division is enabling a patient to move from preoperative preparation
delivering on the promise of this technology for other spe- through surgery and to postoperative recovery without
cialties including spinal and ear, nose and throat surgery. being transferred from surface to surface.
In , Leibinger introduced the Stryker Knee Navi-
gation System, its first image-guided orthopaedic system, in
Europe. The U.S. launch followed in January . This
system is designed to work in concert with Stryker
20.
21. >> STRYKER KNEE
NAVIGATION SYSTEM
Stryker’s surgical navigation in Buffalo, New York, was
system for total knee replacement introduced in the United States in
offers unequaled technology January 2002 following the
for the accurate alignment of the well-received European launch in
knee. It provides the surgeon with the summer of 2001. Because
assessments of the patient’s joint this system also provides total
kinematic measurements before documentation on each patient,
and after the surgical cuts are it is especially valuable in large
made and during the procedure. It teaching institutions such
also gives a unique visualization as Buffalo General, and to the
tool for soft tissue balancing. The opinion leaders who practice in
system, shown here during such settings.
surgery by Kenneth A. Krackow, •••
M.D., at Buffalo General Hospital
22. OPTIVU
>> HDVD
A leader in innovative technology
to support minimally invasive
surgery, Stryker Endoscopy intro-
duced a new digital platform
in late 2001 with its OptiVu HDVD
wireless imaging system. Using
OptiVu’s digital video loupes
(DVLs), surgeons can view surgi-
cal images while maintaining
a natural head and neck position.
This lightweight “heads-up”
display improves surgical visuali-
zation by aligning the image
with the surgeon’s hands. It also
reduces the number of video
monitors required in the OR and
eliminates the need to reposition
the monitors during a procedure.
•••
TRIDENT
>> CERAMIC ACETABULAR SYSTEM
The Trident system from acceptance and delivered out-
Stryker Howmedica Osteonics is standing clinical results in Europe,
an advanced hip replacement Canada and Australia. Similar
product particularly suited to the clinical results have been demon-
needs of younger, more active strated in U.S. trials, and we
patients. Trident features continue to work with the FDA
alumina ceramic bearing surfaces, and our ceramic supplier to obtain
which have been shown in the regulatory approval.
laboratory to exhibit 200 times •••
less wear than conventional metal
on polyethylene surfaces. This
product has met with wide
23. TRIO
>>
MOBILE SURGERY PLATFORM
Greeted enthusiastically in its
first year on the market, Stryker
Medical’s Trio Mobile Surgery
Platform is the first fully functional
product in its class. Trio redefines
most commonly performed
outpatient surgeries by eliminating
the need to transfer the patient
from a preoperative surface
to an operating platform to yet
another surface for postoperative
recovery. Additionally, because
Trio adjusts to a variety of posi-
tions, it can be used in a wide
range of procedures. The benefits
are clear: Trio replaces multiple
products—so much so that
some surgery center systems are
standardizing on this product—
and reduces physical stress on
patients and hospital staff
alike. Further, a study of Trio
in actual use has demonstrated
that this platform facilitates
much faster operating-room
turnover time.
•••
24. LEAD THE MARKET
Staying ahead of the curve requires focus on all aspects of the business, from R&D to dis-
tribution, from customers to patients. Technological innovation, continuous improvement,
comprehensive product lines, and adding new platforms in established markets are all criti-
cally important to this process. At Stryker, we are keenly aware that the factors that help us
lead the market can also help our customers—physicians and hospitals alike—attract new
patients and excel in their markets. Ultimately, being close to the customer through sales,
service, education and training provides a constant source of ideas for new products and
service offerings.
25. 20 21
CUSTOMER FOCUS
CONTINUOUS IMPROVEMENT
LEADERSHIP S E RV I C E L E V E L S
COMPREHENSIVE LINES
N E W O P P O RT U N I T I E S
Instruments and other Stryker divisions have implemented
Building and Extending the Franchise
The performance of Stryker Instruments provides an production and distribution systems and customer service
instructive case study of leadership and execution. By devel- programs most suited to their markets and technologies.
oping and manufacturing best-in-class products, this divi- Our international sales reorganization reflects the
sion is the undisputed market leader in heavy-duty surgical importance of focus to sales success. Following the encour-
instruments. It maintains that position by continually aging European turnaround, we look forward to improve-
upgrading and improving the power and speed of these ments in Japan and the Pacific. The excellent performance
instruments, such as the System fourth-generation cord- of Stryker Canada in exemplifies how focus and man-
less driver for total joint replacement surgery. agement skill can make a challenging market productive,
Stryker Instruments has extended its franchise beyond and we believe that this approach will yield positive results
heavy-duty instruments by building strength in micropow- in Latin America over the long term.
ered surgical instruments with the Total Performance Sys- Physiotherapy Associates, Stryker’s service business,
tem (tps). Here, too, continuous improvement is the rule, continues to execute on its strategy and deliver strong
demonstrated by the recent redesign of core components of results. This division delivered double-digit same-store
growth in , while adding new locations evenly
the system to increase speed and efficiency. Additionally,
this division regularly develops new systems of attachments divided between acquisitions and newly developed facilities.
for key surgical specialties. In , Stryker Instruments It closed the year with locations. Among these are
specialized pediatric facilities—all developed in —that
introduced the latest such system—the Elite line of attach-
ments for the fast-growing specialties of neurosurgery and address developmental delays with a team approach draw-
spine surgery. It has also replaced its earlier generation of ing on the expertise of physical, occupational and speech
attachments for ear, nose and throat procedures with the therapists.
advanced Saber system.
This division has also introduced new platforms within
its hospital market, including pain management and oper-
ating room waste management. Because manufacturing and
service initiatives are critical to market leadership, Stryker
26. EIUS
>> UNI KNEE SYSTEM
Stryker entered the growth area of
early intervention knee surgery
with the global launch of the EIUS
system in the fourth quarter
of 2001. This unicompartmental
product is designed to conserve
bone in situations where only one
portion of the knee is worn,
and the precision instrumentation
facilitates a minimally invasive
procedure with accurate
alignment. This approach can
shorten hospital stays to one
day, decrease soft-tissue damage
and hasten rehabilitation.
•••
TPS
>>
U2 DRILL WITH ELITE ATTACHMENTS
Stryker is methodically expanding enabling the surgeon to work
the applications for its best- with greater precision and control.
in-class TPS (Total Performance Because these attachments
System) micropowered surgical accommodate a single bur that
instruments by introducing the surgeon can customize to any
new attachments to work with the of five lengths, the Elite system
powerful U2 drill. In 2001, we helps hospitals simplify and
launched the Elite line of attach- reduce inventory.
ments to serve the growing •••
neurosurgery and spine surgery
markets. These attachments
are ergonomically designed and
provide a better line of sight,
27. 22 23
988
>>
DIGITAL 3-CHIP CAMERA
Building on Stryker Endoscopy’s
leadership position in medical
video imaging and six previous
generations of our 3-chip
cameras, in August we launched
the first digital output video
camera in the medical industry to
immediate sales success. The
988 Digital 3-Chip Camera offers
multiple pure digital outputs
and can provide analog outputs
as well. Because it is effective
across a number of surgical
specialties, the 988 camera helps
hospitals standardize operating-
room equipment.
•••
28. PAINPUMP
>>
Postoperative pain management
is proving to be a successful
new platform for Stryker Instru-
ments. The Stryker PainPump
delivers a continuous, controlled
infusion of local anesthetic directly
to the surgical area. This safe
and convenient technology
not only eases postoperative dis-
comfort, but it also reduces
patient downtime and rehabilita-
tion requirements.
•••
RESTORATION T3
>>
REVISION HIP SYSTEM
This revision system demonstrates
Stryker’s commitment to compre-
hensive lines of orthopaedic
implants. The T3 system is
designed for the most complex
types of revision surgeries,
where bone is deficient, damaged
or has been lost entirely. The
two-piece modular stem implant
provides stability while also
allowing proper restoration of leg
length and hip-joint mechanics.
•••
29. Fi n a n c i a l R e v i e w
26 Ten-Year Review
28 Management’s Discussion and Analysis of
Financial Condition and Results of Operations
36 Consolidated Balance Sheets
37 Consolidated Statements of Earnings
38 Consolidated Statements of Stockholders’ Equity
39 Consolidated Statements of Cash Flows
40 Notes to Consolidated Financial Statements
60 Summary of Quarterly Data
60 Report of Independent Auditors
61 Board of Directors and Corporate Officers
62 Operating Divisions
30. Te n - Ye a r R e v i e w
(dollars in millions, except per share amounts)
S u m m a r y of O p e rat i on s 2001 2000 1999
Net sales $2,602.3 $2,289.4 $2,103.7
Cost of sales:
Before inventory step-up 963.8 815.2 791.5
Inventory step-up – – 198.2
Total cost of sales 963.8 815.2 989.7
Gross profit 1,638.5 1,474.2 1,114.0
Research, development and engineering expenses 142.1 122.2 105.2
Selling, general and administrative expenses 985.4 885.6 808.4
Purchased research and development – – –
Acquisition-related, restructuring and special charges (credits) 0.6 (1.0) 18.9
Gain on patent judgment – – –
1,128.1 1,006.8 932.5
Other expense (income) 104.7 132.5 151.7
Earnings before income taxes and extraordinary item 405.7 334.9 29.8
Income taxes 133.9 113.9 10.4
Earnings before extraordinary item 271.8 221.0 19.4
Extraordinary loss, net of income taxes (4.8) – –
Net earnings $267.0 $221.0 $19.4
Net earnings per share of common stock(a):
$1.38(b)
Basic $1.13 $.10
$1.34(b)
Diluted $1.10 $.10
Dividend per share of common stock(a) $.10 $.08 $.065
Average number of shares outstanding – in millions(a):
Basic 196.3 195.1 193.8
Diluted 203.0 201.1 198.6
(a) Adjusted for the two-for-one stock splits effective June 10, 1996 and May 12, 2000.
(b) Excludes net extraordinary loss per share of $.02 basic and $.02 diluted.
Fi n a n c i a l a n d S tat i s t i c a l Data 2001 2000 1999
Cash and marketable securities 50.1 54.0 83.5
Working capital 459.7 379.6 440.8
Current ratio 1.9 1.6 1.7
Property, plant and equipment – net 444.0 378.1 391.5
Capital expenditures 161.9 80.7 76.4
Depreciation and amortization 172.0 168.6 162.8
Total assets 2,423.6 2,430.8 2,580.5
Long-term debt, including current maturities 722.6 1,012.5 1,287.4
Stockholders’ equity 1,056.2 854.9 671.5
Return on average equity 27.9% 29.0% 2.9%
Net cash provided by operating activities 468.3 331.8 284.0
Number of stockholders of record 2,886 2,904 2,929
Number of employees 12,839 12,084 10,925
32. M a n ag e m e n t ’s D i s c u s s i on a n d A n a ly s i s of Fi n a n c i a l C on d i t i on
a n d R e s u lt s of O p e rat i on s
Results of Operations
The table below outlines the components of the consolidated statements of earnings as a percentage of net sales and the year-
to-year percentage change in dollar amounts:
Percentage of Net Sales Percentage Change
2001 2000 1999 2001/00 2000/99
Net sales 100.0% 100.0% 100.0% 14% 9%
Cost of sales:
Before inventory step-up 37.0 35.6 37.6 18 3
Inventory step-up – – 9.4 – –
Total cost of sales 37.0 35.6 47.0 18 (18)
Gross profit 63.0 64.4 53.0 11 32
Research, development and engineering expenses 5.5 5.3 5.0 16 16
Selling, general and administrative expenses 37.9 38.7 38.4 11 10
Acquisition-related and restructuring charges (credits) – – 0.9 – –
Other expense (income) 4.0 5.8 7.2 (21) (13)
Earnings before income taxes and extraordinary item 15.6 14.6 1.4 21 –
Income taxes 5.1 5.0 0.5 18 –
Earnings before extraordinary item 10.4 9.7 0.9 23 –
Extraordinary loss, net of income taxes (0.2) – – – –
Net earnings 10.3% 9.7% 0.9% 21 –
The table below sets forth domestic/international and product line sales information:
Net Sales (in millions) Percentage Change
2001 2000 1999 2001/00 2000/99
Domestic/international sales
Domestic $1,688.4 $1,408.2 $1,228.4 20% 15%
International 913.9 881.2 875.3 4 1
Total net sales $2,602.3 $2,289.4 $2,103.7 14 9
Product line sales
Orthopaedic Implants $1,442.5 $1,313.0 $1,248.2 10 5
MedSurg Equipment 978.9 829.1 733.5 18 13
Physical Therapy Services 180.9 147.3 122.0 23 21
Total net sales $2,602.3 $2,289.4 $2,103.7 14 9
2001 Compared with 2000
Stryker Corporation’s net sales increased 14% in 2001 to $2,602.3 million from $2,289.4 million in 2000. Net sales grew by
12% as a result of increased unit volume and changes in product mix; 3% related to higher selling prices; 1% as a result of
acquired businesses; and 1% related to the inclusion of freight revenue in net sales in 2001. Freight revenue was recorded as
an offset to cost of sales during 2000. These increases were partially offset by a 3% decline due to changes in foreign currency
exchange rates.
33. 28 29
The Company’s domestic sales increased 20% in 2001 to $1,688.4 million from $1,408.2 million in 2000. The domestic
sales gain is a result of higher shipments of Orthopaedic Implants, MedSurg Equipment and higher revenue from Physical
Therapy Services. International sales increased 4% for the year to $913.9 million from $881.2 million in 2000 as a result of
higher shipments of Orthopaedic Implants and MedSurg Equipment. The impact of foreign currency comparisons on
the dollar value of international sales was unfavorable by $62.1 million for the year. Excluding the impact of foreign currency,
international sales increased 11% in 2001.
Worldwide sales of Orthopaedic Implants were $1,442.5 million for 2001, representing an increase of 10% as a result of
higher shipments of reconstructive (hip, knee and shoulder), trauma and spinal implants. Excluding the impact of foreign
currency, sales of Orthopaedic Implants increased 13% in 2001. Worldwide sales of MedSurg Equipment were $978.9 million
for 2001, representing an increase of 18% based on higher shipments of powered surgical instruments, endoscopic systems,
hospital beds and stretchers and Leibinger craniomaxillofacial implants and image-guided surgical systems. Excluding the
impact of foreign currency, sales of MedSurg Equipment increased 20% in 2001. Physical Therapy Services revenues were
$180.9 million for 2001, representing an increase of 23% as a result of new physical therapy centers and higher revenue from
existing centers.
Cost of sales represented 37.0% of sales compared with 35.6% in 2000. The higher cost of sales percentage in 2001 resulted
primarily from the change in recording of freight revenue described above and the classification of certain shipping costs as
cost of sales in 2001 that had been reported in selling, general and administrative expenses in the prior year. The cost of sales
percentage increased approximately 1.0% in 2001 as a result of the change in classification of freight revenue and shipping
costs. Cost of sales for 2001 were also higher by approximately 0.4% due to an increase in unabsorbed manufacturing costs
caused by the slowing of production in certain of the Company’s manufacturing plants to reduce overall inventory levels. The
Company continually assesses the overall capacity provided by its manufacturing plants relative to cost, inventory manage-
ment and expected sales growth. A slight increase in Orthopaedic Implant margins was more than offset by higher sales and
revenues of lower-margin MedSurg Equipment products and Physical Therapy Services.
Research, development and engineering expenses increased 16% in 2001 and represented 5.5% of sales compared with 5.3%
in 2000. The increase in research, development and engineering spending in 2001 resulted from continued Company-wide
focus on new product development. New product introductions in 2001 included the Accolade Cemented Hip Stem, EIUS
knee,T2 Intramedullary Nail System, Reflex Anterior Cervical Plate, Percutaneous Cement Delivery System, Elite Attachments
for TPS, Cordless Driver II, Stryker Knee Navigation System, SDC Pro II surgical documentation system, 988 Digital Camera,
Go Bed, Trio Mobile Surgery Platform and an enhanced Secure II bed. In the second quarter of 2001, the Company received
marketing approval for its OP-1 Implant product in Australia and the European Union. The approved indication in Australia
is for the treatment of nonunion of long bone fractures secondary to trauma for the purposes of initiating repair by new
bone formation. The approved indication in Europe is for tibial nonunions of nine-month duration, secondary to trauma, in
skeletally mature patients, in cases where previous treatment with autograft has failed or use of autograft is unfeasible. In the
fourth quarter of 2001, the Company was granted Humanitarian Device Exemption (HDE) status for OP-1 Implant by the
U.S. Food and Drug Administration (FDA). The approved indication in the U.S. is for use as an alternative to autograft in
recalcitrant long bone nonunions where use of autograft is unfeasible and alternative treatments have failed. Under the HDE,
OP-1 Implant will be made available as a humanitarian device, defined by the FDA as one intended to benefit patients by
treating or diagnosing a disease or condition that affects fewer than 4,000 individuals per year in the U.S. The first commercial
sales of OP-1 in Australia began in mid-May and the commercial launch of OP-1 in select markets of the European Union
began in August. The first sales of OP-1 in the U.S. under the HDE began in November. The commercial launch of OP-1 did
not have a significant impact on sales in 2001 and the Company cannot predict the impact on sales in future years.
Selling, general and administrative expenses increased 11% in 2001 and represented 37.9% of sales compared with 38.7%
in 2000. The classification of certain shipping costs as cost of sales in 2001 reduced selling, general and administrative expenses
as a percent of sales by approximately 0.4% in 2001. In addition, discount expense related to the accounts receivable securiti-
zation program, which is included in selling, general and administrative expenses, declined to $5.8 million in 2001 from $7.1
million in 2000 as a result of lower discount rates.
34. The Company recognized nonrecurring charges of $0.6 million in continuing operations relating to various acquisition-
related and restructuring events in the fourth quarter of 2001 and recognized nonrecurring acquisition-related and restruc-
turing credits of $1.0 million in 2000. The 2001 acquisition-related and restructuring charges include $2.4 million of charges,
partially offset by the reversal of prior year restructuring accruals totaling $1.8 million.The $2.4 million in 2001 charges includes
a $0.9 million acquisition-related charge for severance and related costs associated with the reorganization of the Company’s
sales structure in Italy to accommodate the integration of the business acquired from the Company’s independent Italian
distributor. The reorganization established a direct sales force in Italy that will distribute the Company’s full product portfolio.
The $0.9 million charge covers severance costs for three employees in Italy and costs to cancel contracts with discontinued
agents. The reorganization of the sales structure in Italy is expected to be completed in the first quarter of 2002. The 2001
charge also includes a $0.7 million charge related to the reorganization of the Company’s distribution channels in Latin America
and $0.8 million for severance costs for 10 employees in Europe. The $0.7 million charge reflects the cost to terminate a
distributor and is based on contractual terms. Planned European workforce reductions are expected to be completed in the
first quarter of 2002. The $1.8 million in credits includes $1.4 million related to a reduction in the expected costs to complete
headcount reductions associated with the 2000 and 1999 reorganizations of the Company’s European and Japanese distri-
bution operations. The 2001 credits also include $0.4 million to reverse the remaining loss reserves established in Japan for
discontinued ophthalmology inventories sold on a contingent basis in 1999.
In 2000, the Company recognized nonrecurring credits of $1.0 million consisting of the reversal of prior year restructuring
accruals totaling $7.0 million, partially offset by charges totaling $6.0 million. The $7.0 million in credits included $1.2 million
related to the reorganization of Stryker’s distribution channels associated with the acquisition of Howmedica and $2.7
million to reverse reserves for a distributor reorganization that was charged to operations in 1996. The credits also included
$2.7 million related to a reduction in the expected costs to complete headcount reductions in Japan and $0.4 million to reverse
a portion of loss reserves established in Japan for discontinued ophthalmology inventories sold on a contingent basis in 1999.
The $6.0 million in 2000 restructuring charges included a $4.0 million charge to cover severance costs for 95 employees,
primarily in Europe; and $1.4 million for asset write-offs, primarily for goodwill and inventory, and lease commitments asso-
ciated with certain operations, principally in Europe, that were closed in the fourth quarter of 2000. The planned workforce
reductions were completed in 2001, and the remaining amount of the reserve was reversed in 2001. The 2000 restructuring
charges also included $0.6 million to terminate two small European distributors.
Interest expense declined to $67.9 million in 2001 from $96.6 million in 2000, primarily as a result of lower outstanding
debt balances. The increase in intangibles amortization to $38.4 million in 2001 from $34.7 million in 2000 relates primarily
to business acquisitions during 2001 and the last half of 2000. Other income increased to $1.6 million in 2001 from other
expense of $1.2 million in 2000, primarily as a result of foreign currency transaction gains in 2001 versus foreign currency
transaction losses in 2000, partially offset by lower interest income. The effective income tax rate for 2001 was 33.0% compared
with a 34.0% effective income tax rate in 2000. The decrease in the rate from 2000 to 2001 is attributable to the mix of
operating results among the tax jurisdictions.
Earnings before extraordinary item increased 23% to $271.8 million from $221.0 million in 2000; basic earnings per share
before extraordinary item increased 22% to $1.38 in 2001 from $1.13 in 2000; and diluted earnings per share before extraor-
dinary item increased 22% to $1.34 in 2001 from $1.10 in 2000. In December 2001, the Company refinanced and prepaid
the remaining $642.7 million outstanding under the $1,650.0 million Senior Secured Credit Facilities established in 1998
in connection with the Howmedica acquisition. The prepayment of the 1998 Facilities resulted in the write-off of related
unamortized deferred loan costs of $7.1 million, which has been reflected as an extraordinary loss of $4.8 million (net of income
taxes of $2.3 million; $.02 per basic and diluted share). Net earnings were $267.0 million (basic and diluted net earnings per
share of $1.36 and $1.32, respectively) compared with $221.0 million (basic and diluted net earnings per share of $1.13 and
$1.10, respectively) in 2000.
35. 30 31
2000 Compared with 1999
Stryker Corporation’s net sales increased 9% in 2000 to $2,289.4 million from $2,103.7 million in 1999. Net sales grew by
9% as a result of increased unit volume and changes in product mix; 1% related to higher selling prices; and 1% as a result of
acquired businesses. These increases were partially offset by a 2% decline due to changes in foreign currency exchange rates.
The Company’s domestic sales increased 15% in 2000 compared with 1999. The domestic sales gain is a result of higher
shipments of Orthopaedic Implants, MedSurg Equipment and higher revenue from Physical Therapy Services. International
sales increased 1% for the year as a result of higher shipments of Orthopaedic Implants and MedSurg Equipment. The impact
of foreign currency comparisons on the dollar value of international sales was unfavorable by $43.0 million for the year. Sales
of discontinued products in 1999 were $7.7 million. Excluding the impact of foreign currency and discontinued products,
international sales increased 7% in 2000.
Worldwide sales of Orthopaedic Implants were $1,313.0 million for 2000, representing an increase of 5% as a result of
higher shipments of reconstructive (hip, knee and shoulder), trauma and spinal implants. Excluding the impact of foreign
currency, sales of Orthopaedic Implants increased 8% in 2000. Worldwide sales of MedSurg Equipment were $829.1 million
for 2000, representing an increase of 13% based on higher shipments of powered surgical instruments, endoscopic systems,
hospital beds and stretchers and Leibinger craniomaxillofacial implants and image-guided surgical systems. Excluding the
impact of foreign currency and discontinued products, sales of MedSurg Equipment increased 14% in 2000. Physical Therapy
Services revenues were $147.3 million for 2000, representing an increase of 21% as a result of new physical therapy centers
and higher revenues from existing centers.
Cost of sales represented 35.6% of sales compared with 47.0% in 1999. The higher cost of sales percentage in 1999 resulted
from $198.2 million of additional nonrecurring cost of sales for inventory sold in 1999 that was stepped-up to fair value in
connection with the acquisition of Howmedica, compared with no inventory step-up included in 2000 cost of sales. Excluding
the nonrecurring cost of sales charges for inventory step-up, cost of sales would have declined from 37.6% of sales in 1999 to
35.6% in 2000. The decline is primarily the result of the realization of cost savings from cost reduction plans implemented at
former Howmedica manufacturing plants and of slightly higher selling prices in 2000.
Research, development and engineering expenses increased 16% in 2000 and represented 5.3% of sales compared with 5.0%
in 1999. The increase in research, development and engineering spending in 2000 resulted from continued Company-wide
focus on new product development. New product introductions in 2000 included Crossfire Highly Crosslinked Polyethylene
for Howmedica implants, the Scorpio TS Revision Knee System, Stryker Instruments’ TPS U2 drill, the Steri-Shield T4
Personal Protection System, the Stryker Navigation System, the Antigrade/Retrograde intramedullary nail, the OPUS spinal
system, resorbable craniomaxillofacial plates and screws and, in certain international markets, Simplex P bone cement with
Tobramycin.
Selling, general and administrative expenses increased 10% in 2000 and represented 38.7% of sales compared with 38.4%
in 1999. Selling, general and administrative expenses as a percentage of sales were comparable in both years after considering
the inclusion of $7.1 million in 2000 and $0.6 million in 1999 of discount expense related to the accounts receivable securi-
tization program established in November 1999.
The Company recognized nonrecurring credits of $1.0 million in continuing operations relating to various acquisition-
related and restructuring events in the fourth quarter of 2000 and recognized nonrecurring acquisition-related charges of $18.9
million in 1999. The 2000 acquisition-related and restructuring credits include the reversal of prior year restructuring accruals
totaling $7.0 million, partially offset by charges totaling $6.0 million. The $7.0 million in credits includes $1.2 million related
to the reorganization of Stryker’s distribution channels associated with the acquisition of Howmedica and $2.7
million to reverse reserves for a distributor reorganization that was charged to operations in 1996. The credits also include
$2.7 million related to a reduction in the expected costs to complete headcount reductions in Japan and $0.4 million to reverse
a portion of loss reserves established for discontinued ophthalmology inventories sold on a contingent basis. Both of these
credits represent the reversal of charges originally taken in connection with the 1999 reorganization of the Company’s
Japanese distribution operation and the discontinuance of distribution of ophthalmology products in Japan. The $6.0 million
36. in 2000 restructuring charges includes a $4.0 million charge to cover severance costs for 95 employees, primarily in Europe.
Approximately 10% of the planned workforce reductions were completed in December 2000, with the remaining reductions
substantially completed in 2001.The 2000 restructuring charges also include $1.4 million for asset write-offs, primarily for good-
will and inventory, and lease commitments associated with certain operations, principally in Europe, that were closed in the
fourth quarter of 2000. The 2000 restructuring charges also include $0.6 million to terminate two small European distributors.
In 1999, the Company recognized nonrecurring acquisition-related charges of $18.9 million, consisting of $14.2 million to
reorganize Stryker’s Japanese distribution operation and to discontinue the distribution of ophthalmology products in Japan and
$4.7 million to complete the reorganization of Stryker’s distribution channels to accommodate the Howmedica integration.
Interest expense declined to $96.6 million in 2000 from $122.6 million in 1999, primarily as a result of lower outstanding
debt balances. The increase in intangibles amortization to $34.7 million in 2000 from $33.9 million in 1999 relates primarily
to business acquisitions during 2000. Other income declined from $4.8 million in 1999 to other expense of $1.2 million in
2000 primarily as a result of foreign currency transaction losses. The effective income tax rate for 2000 was 34.0% compared
with a 34.9% effective income tax rate in 1999. The decrease in the rate from 1999 to 2000 is attributable to the mix of oper-
ating results among the tax jurisdictions.
Net earnings were $221.0 million (basic and diluted net earnings per share of $1.13 and $1.10, respectively) compared
with $19.4 million (basic and diluted net earnings per share of $.10) in 1999. Excluding nonrecurring items in both years, net
earnings in 2000 increased 37% to $220.3 million from $160.5 million in 1999; basic net earnings per share increased 36% to
$1.13 in 2000 from $.83 in 1999; and diluted net earnings per share increased 36% to $1.10 in 2000 from $.81 in 1999.
Liquidity and Capital Resources
The Company’s working capital at December 31, 2001 increased $80.1 million to $459.7 million from $379.6 million at
December 31, 2000. The working capital increase is due primarily to the reduction in current maturities of long-term debt of
$134.3 million, partially offset by increases in income tax liabilities and accrued expenses. The reduction in current maturities
of long-term debt is due to the establishment of a new revolving credit facility (as described in more detail below) in
December 2001, which does not require principal repayments in 2002. Accounts receivable days sales outstanding, excluding
the effect of the securitization program, decreased 10 days to 59 days at the end of 2001 from 69 days at December 31, 2000.
The lower days sales outstanding at December 31, 2001 is the result of improved collection efforts as well as an increase in
the allowance for bad debts to provide for potential exposures in Latin America and Europe. Days sales in inventory decreased
to 138 days at December 31, 2001 from 166 days at December 31, 2000. The lower days sales in inventory at December 31,
2001 is primarily the result of improved inventory management.
The Company generated cash of $468.3 million from operations in 2001 compared with $331.8 million in 2000.The gener-
ation of cash in 2001 is the result of strong cash earnings (net earnings plus noncash adjustments) and increases in accrued
expenses, income tax liabilities and accounts payable. These increases were partially offset by increases in accounts receivable,
inventories and deferred charges and payments of $11.2 million attributable to acquisition-related and restructuring charges
and acquisition purchase liabilities. In 2001, the Company used cash of $161.9 million for capital expenditures, $43.0
million for business acquisitions and $15.7 million for the payment of dividends. Capital expenditures included $87.8 million
to terminate a synthetic lease and purchase the Company’s Mahwah, New Jersey, manufacturing and distribution facility.
Business acquisitions include $27.2 million paid to Pfizer Inc., for final settlement of a working capital adjustment relating
to the Howmedica purchase price.
In December 2001, the Company established $1,000.0 million in Unsecured Credit Facilities. These Facilities replaced the
$1,650.0 million Senior Secured Credit Facilities that were established in 1998 in conjunction with the acquisition of
Howmedica. The Unsecured Credit Facilities include a $250.0 million 364-day revolving credit agreement and a $750.0 million
five-year, nonamortizing, revolving credit agreement. A total of $730.5 million was drawn under the new Credit Facilities, of
which $642.7 million prepaid the debt outstanding under the 1998 Facilities and $87.8 million was used to terminate the
37. 32 33
Company’s synthetic lease and purchase its Mahwah, New Jersey, manufacturing and distribution facility. In addition to the
refinancing, the Company borrowed $205.3 million under credit facilities to fund cash flow needs at various times during 2001
and made repayments of $568.7 million against credit facilities during 2001.Total debt declined by $289.9 million during 2001.
In November 1999, the Company established a securitization facility under which certain domestic accounts receivable
are sold on an ongoing basis to a special-purpose subsidiary that in turn may sell up to a $130.0 million interest in such receiv-
ables to a third party. The accounts receivable securitization facility was established to reduce the Company’s overall cost of
borrowing. The accounts receivable securitization facility provided $2.7 million of proceeds during 2001, with the program-
to-date proceeds totaling $130.0 million as of December 31, 2001. The proceeds have been used to reduce the Company’s
long-term debt.
The Company had $50.1 million in cash and cash equivalents at December 31, 2001. The Company also had outstanding
borrowings totaling $722.6 million at that date. Current maturities of long-term debt at December 31, 2001 are $1.7 million
and will decrease to $0.2 million in 2003 and $0.1 million in 2004. The Company’s $250.0 million 364-day revolving credit
agreement expires in December 2002 and is renewable at the Company’s and the lenders’ discretion. The Company’s $750.0
million five-year, nonamortizing, revolving credit agreement expires in December 2006.The Company believes its cash on hand
as well as anticipated cash flows from operations will be sufficient to fund future operating and capital requirements and required
debt repayments. Should additional funds be required, the Company had $346.2 million of additional borrowing capacity
available under all of its existing credit facilities at December 31, 2001.
Other Matters
The Company finalized its plan to integrate Howmedica and Stryker in 1999. As the integration plan evolved and was imple-
mented during 1999, the Company made certain adjustments to the purchase liabilities recorded in the preliminary purchase
price allocation. The additional purchase liabilities recorded in connection with the acquisition of Howmedica totaled $126.5
million. At December 31, 2001, there were $4.1 million in additional purchase liabilities remaining to be paid out. Certain
obligations, such as those related to lease commitments for facility closures, will result in payments extending to 2008.
The Company distributes its products throughout the world. As a result, the Company’s financial results could be signifi-
cantly affected by factors such as changes in foreign currency exchange rates or weak economic conditions in foreign markets.
The Company’s operating results are exposed to changes in exchange rates between the U.S. dollar and the Japanese yen and
European currencies, in particular the euro and the British pound. When the U.S. dollar strengthens against foreign currencies,
the dollar value of foreign currency sales declines. When the U.S. dollar weakens, the opposite situation occurs. The Company
manufactures its products in the United States, France, Germany, Ireland, Switzerland, Canada and Puerto Rico and incurs
the costs to manufacture in the applicable local currencies. This worldwide deployment of factories serves to partially mitigate
the impact of currency exchange rate changes on the Company’s cost of sales.
The Company enters into forward currency exchange contracts to mitigate the impact of currency fluctuations on trans-
actions denominated in nonfunctional currencies, thereby limiting risk to the Company that would otherwise result from changes
in exchange rates.These nonfunctional currency exposures principally relate to intercompany payables arising from intercompany
purchases of manufactured products. The periods of the forward currency exchange contracts correspond to the periods
of the exposed transactions, with realized gains and losses included in the measurement and recording of transactions denom-
inated in the nonfunctional currencies.
At December 31, 2001, the Company had outstanding forward currency exchange contracts to purchase $97.4 million and
sell $72.1 million of various currencies (principally U.S. dollars and euros) with maturities principally ranging from 30 to 180
days. At December 31, 2000, the Company had outstanding forward currency exchange contracts to purchase $82.7 million and
sell $33.8 million of various currencies (principally U.S. dollars and euros) with maturities ranging from 30 to 180 days. The
estimated fair value of forward currency exchange contracts represents the measurement of the contracts at month-end spot
rates as adjusted for amortized forward points. A hypothetical 10% change in exchange rates for these currencies would change
the 2001 fair value by approximately $1.4 million and would have changed the 2000 fair value by approximately $1.6 million.