SlideShare uma empresa Scribd logo
1 de 9
Baixar para ler offline
MONSANTO COMPANY
                                                                                                800 NORTH LINDBERGH BLVD
                                                                                                ST. LOUIS, MISSOURI 63167


          Immediately
RELEASE


          Media: Lee Quarles (314-694-2330)
CONTACT
          Analysts: Scarlett Lee Foster (314-694-8148)


          GROWTH IN U.S. CORN SEED AND TRAITS BUSINESS, ROUNDUP BUSINESS DRIVE
          FIRST-QUARTER SALES FOR MONSANTO COMPANY
          First-Quarter Earnings Per Share Benefits from Lower Tax Rate, Company Reiterates Full-Year
          Free Cash Flow and EPS Guidance
          Company Sets New Time for Conference Call, Call Scheduled for 9:30 a.m. (ET)/8:30 a.m. (CT)

          St. Louis – Jan. 4, 2007

                                                                              First Quarter   First Quarter
               ($ in millions)
                                                                                  2007            2006
               Net Sales By Segment
                   Corn seed and traits                                             $ 360            $ 267
                   Soybean seed and traits                                            170              173
                   Vegetable and fruit seed                                           100              125
                   All other crops seeds and traits                                    50               91
               TOTAL Seeds and Genomics                                             $ 680            $ 656

                  Roundup and other glyphosate-based herbicides                     $ 649            $ 549
                  All other agricultural productivity products                        210              200
               TOTAL Agricultural Productivity                                      $ 859            $ 749

                                                                                    $1,539           $1,405
               TOTAL Net Sales

                                                                                    $ 680            $ 634
               Gross Profit

                                                                                    $ 566            $ 518
               Operating Expenses

               Interest Expense – Net                                               $     3          $    18
               Other Expense – Net                                                  $    14          $     4

                                                                                    $    90          $    59
               Net Income

                                                                                    $ 0.16           $ 0.11
               Diluted Earnings per Share (See note 1.)
               Items Affecting Comparability – EPS Impact
                    None                                                                  –                 –
               Diluted Earnings per Share from Ongoing Business (For the
                                                                                    $ 0.16           $ 0.11
               definition of ongoing EPS, see note 2.)

                                                                                        10%              37%
               Effective Tax Rate


                                                           - more -
-2-


                                                                          First Quarter    First Quarter
                                                                              2007             2006
     Comparison as a Percent of Net Sales:
        Gross profit                                                               44%              45%
        Selling, general and administrative expenses (SG&A)                        25%              25%
         Research and development expenses                                         12%              12%
        Income before income taxes and minority interest                            6%               7%
        Net income                                                                  6%               4%

Comment from Monsanto Chairman, President and Chief Executive Officer Hugh Grant:
“We remain focused on delivering the next generation of innovation to the farm by offering our farmer
customers meaningful seed and trait technologies. Our results in the first quarter are testament to this
commitment and the value our products are providing farmers. Backed by the solid performance of our
seeds and traits business including strong early demand for our triple-trait corn technology in the United
States, we believe our business is on track for another strong year.”

Market Conditions
The winter months in the Northern Hemisphere agricultural markets provide farmers with an opportunity
to review their input costs for the 2007 season – including new seed, trait and chemistry offerings. Strong
early-season order patterns in the United States for the company’s corn business are reinforcing growth
trends in the company’s branded seed business and adoption of trait technologies, particularly its triple-
trait corn technology. Monsanto currently expects that total soybean acres under production may
decrease slightly during this growing season as farmers increase the number of acres planted to corn in
the United States. However, the company noted that final planted acres will be based on a number of
factors leading up to planting, including commodity prices and weather.

The planting season is well under way in the Southern Hemisphere. In Australia, drought conditions have
strained the productivity of cotton farmers within the country and reduced the number of acres devoted to
cotton production by half. In Brazil, recent estimates suggest that total soybean production in the country
could be in the range of 50 million acres.

Operations Update
The company reported net sales for the first quarter of fiscal year 2007, which were 10 percent higher
than those in the first quarter of fiscal year 2006. Key drivers for the quarter were stronger adoption of the
company’s corn seed and trait technologies in the United States, and greater volumes of Roundup
herbicides in the United States and Brazil.

For the first quarter of fiscal year 2007, Monsanto recorded net income of $90 million compared with net
income of $59 million for the same period last year. Earnings per share (EPS) for the quarter, both on an
as-reported and ongoing basis, were 16 cents a share. The company’s first quarter results reflected a
lower tax rate in the quarter primarily stemming from the conclusion of an ex-U.S. audit. Monsanto
believes that the company’s full-year tax rate will be in the 30 percent range.

Cash Flow
For first-quarter fiscal year 2007, net cash provided by operating activities was $600 million, compared
with $773 million in the first-quarter of fiscal year 2006. Net cash required by investing activities was
$67 million for the first-quarter of fiscal year 2007, compared to net cash required of $135 million for the
same fiscal year 2006 quarter. As a result, free cash flow was $533 million for the first-quarter fiscal year
2007, compared with $638 million for the same quarter in fiscal year 2006. (For a reconciliation of free
cash flow, see note 2.) The decrease in the quarter related primarily to changes in inventories and
accrued liabilities which affected operating cash during the quarter. Net cash required by financing
activities was $156 million for the first quarter of fiscal year 2007, compared with net cash required of
$157 million for the same period in fiscal year 2006.


                                                    -more-
-3-


Outlook
The second and third quarters of fiscal year 2007 are expected to be the primary drivers for the
company’s fiscal year 2007 EPS results. These quarters reflect both the relative size of the company’s
U.S. business and the importance of its seeds-and-traits business to Monsanto’s earnings.

Monsanto now expects that its full-year 2007 EPS guidance could be toward the upper end of its
previously announced range of $1.50 to $1.57, both on a reported and ongoing basis. The company
continues to expect free cash flow for fiscal year 2007 to be in the range of $875 million to $950 million.
The company expects net cash provided by operating activities to be in the range of $1.375 billion to
$1.450 billion, and net cash required by investing activities to be approximately $500 million for fiscal year
2007. (For a reconciliation of free cash flow, see note 2.)


                                    Seeds and Genomics Segment Detail

              ($ in millions)                              Net Sales                   Gross Profit

                                                      First           First        First        First
              Seeds and Genomics                     Quarter         Quarter      Quarter      Quarter
                                                      2007            2006         2007         2006
                                                       $360           $267           $223       $153
              Corn seed and traits
                                                       170            173             122          114
              Soybean seed and traits
                                                       100            125             51           63
              Vegetable and fruit seed

                                                        50             91             18           56
              All other crops seeds and traits

              TOTAL Seeds and Genomics                 $680           $656           $414       $386


                                                                                Earnings Before
                  ($ in millions)
                                                                            Interest & Taxes (EBIT)
                                                                                First       First
                  Seeds and Genomics                                          Quarter     Quarter
                                                                                2007        2006
                  EBIT (For a reconciliation of EBIT, see note 2.)              $1           $19
                                                                               None         None
                  Unusual Items Affecting EBIT

The Seeds and Genomics segment consists of the company’s global seeds and traits business, and
genetic technology platforms.

Sales for Monsanto’s Seeds and Genomics segment were $680 million for the first quarter of fiscal year
2007, or higher than the same period last year.

Results in the quarter benefited from increased sales of the company’s corn seed and traits business,
which were 35 percent higher when compared with sales in the same period last year. During the quarter,
Monsanto’s U.S. corn business realized strong early orders for the company’s corn products – including
its higher margin triple-trait technology which offers farmers both above-the-ground and below-the-ground
insect protection, as well as weed control flexibility. Monsanto reiterated that the company’s DEKALB and
Asgrow national corn brands could have more than 35 percent of all of its seed sold in a triple stack
during the 2007 growing season.

Sales in the quarter were partially offset by lower volume of the company’s cotton traits in Australia as
drought conditions there halved the total cotton production area. Results in the quarter were also partially
offset by lower revenues from the Seminis vegetable and fruit seed business, primarily a function of the
timing of seed sales in 2007 when compared with 2006 sales.


                                                      -more-
-4-


                                Agricultural Productivity Segment Detail

              ($ in millions)                              Net Sales               Gross Profit

                                                      First        First        First       First
              Agricultural Productivity              Quarter      Quarter      Quarter     Quarter
                                                      2007         2006         2007        2006
              Roundup and other glyphosate-
                                                       $649           $549       $194       $182
              based herbicides
              All other agricultural
                                                        210           200         72          66
              productivity products
              TOTAL Agricultural Productivity          $859           $749       $266       $248


                                                                            Earnings Before
                   ($ in millions)
                                                                        Interest & Taxes (EBIT)
                                                                           First       First
                   Agricultural Productivity                             Quarter      Quarter
                                                                           2007        2006
                   EBIT (For a reconciliation of EBIT, see note 2.)        $103         $93
                                                                           None        None
                   Unusual Items Affecting EBIT

The Agricultural Productivity segment consists primarily of crop protection products, residential lawn-and-
garden herbicide products, and the company’s animal agricultural businesses.

Sales for Monsanto’s Agricultural Productivity segment were $859 million for the first quarter of fiscal year
2007, or 15 percent higher compared with sales in the same period last year. The primary contributor to
the segment’s growth in the quarter was stronger volumes of Roundup herbicides in the United States
and Brazil.

Gross profit for the segment in the first quarter was slightly higher when compared with gross profit in the
same period last year. As a percent of sales, gross profit for the segment was slightly less, as the
company experienced higher raw material and energy costs for production of Roundup and other
glyphosate-based herbicides.

Webcast Information
In conjunction with this announcement, Monsanto will hold a conference call at 8:30 a.m. central time
(9:30 a.m. eastern time) today. The call will focus on these results, future expectations and an update of
projects within the company’s R&D pipeline. The call may also include a discussion of Monsanto’s
strategic initiatives, product performance and other matters related to the company’s business.

Presentation slides and a simultaneous audio webcast of the conference call may be accessed by visiting
the company’s web site at www.monsanto.com and clicking on “Investor Information.” Visitors may need
to download Windows Media Player™ prior to listening to the webcast. Following the live broadcast, a
replay of the webcast will be available on the Monsanto Web site for three weeks.

About Monsanto Company
Monsanto Company is a leading global provider of technology-based solutions and agricultural products
that improve farm productivity and food quality. For more information on Monsanto, see
www.monsanto.com.


                                                      -oOo-


                                                      -more-
-5-


Cautionary Statements Regarding Forward-Looking Information:
Certain statements contained in this release are quot;forward-looking statements,quot; such as statements
concerning the company's anticipated financial results, current and future product performance,
regulatory approvals, business and financial plans and other non-historical facts. These statements are
based on current expectations and currently available information. However, since these statements are
based on factors that involve risks and uncertainties, the company's actual performance and results may
differ materially from those described or implied by such forward-looking statements. Factors that could
cause or contribute to such differences include, among others: continued competition in seeds, traits and
agricultural chemicals; the company's exposure to various contingencies, including those related to
intellectual property protection, regulatory compliance and the speed with which approvals are received,
and public acceptance of biotechnology products; the success of the company's research and
development activities; the outcomes of major lawsuits, including proceedings related to Solutia Inc.;
developments related to foreign currencies and economies; successful completion and operation of
recent and proposed acquisitions, including Delta and Pine Land Company; fluctuations in commodity
prices; compliance with regulations affecting our manufacturing; the accuracy of the company's estimates
related to distribution inventory levels; the company's ability to fund its short-term financing needs and to
obtain payment for the products that it sells; the effect of weather conditions, natural disasters and
accidents on the agriculture business or the company's facilities; and other risks and factors detailed in
the company's most recent periodic report to the SEC. Undue reliance should not be placed on these
forward-looking statements, which are current only as of the date of this release. The company disclaims
any current intention or obligation to update any forward-looking statements or any of the factors that may
affect actual results.

Notes to editors: DEKALB, Asgrow and Roundup are trademarks of Monsanto Company and its wholly
owned subsidiaries.

References to Roundup herbicides in this release mean Roundup branded herbicides, excluding lawn-
and-garden herbicide products.


                                                   -more-
-6-


                                         Monsanto Company
                                    Selected Financial Information
                            (Dollars in millions, except per share amounts)
                                                Unaudited

Statements of Consolidated Operations                                         Three Months Ended
                                                                                    Nov. 30,
                                                                              2006         2005
Net Sales                                                                      $1,539        $1,405
Cost of Goods Sold                                                                859           771
Gross Profit                                                                      680           634
Operating Expenses:
    Selling, General and Administrative Expenses                                 384          350
    Research and Development Expenses                                            182          168
Total Operating Expenses                                                         566          518
Income From Operations                                                           114          116
Interest Expense                                                                   33           32
Interest Income                                                                   (30)         (14)
Solutia-Related Expenses                                                           10            6
Other Expense (Income) – Net                                                        4           (2)
Income Before Income Taxes and Minority Interest                                   97           94
Income Tax Provision                                                               10          35
Minority Interest Income                                                           (3)          —
Net Income                                                                     $ 90         $ 59

EBIT (see note 2)                                                              $ 104        $ 112

Basic Earnings per Share (see note 1)                                          $ 0.17       $ 0.11

Diluted Earnings per Share (see note 1)                                        $ 0.16       $ 0.11

Weighted Average Shares Outstanding (see note 1):
  Basic                                                                         543.1        536.8
  Diluted                                                                       553.6        547.3


                                                -more-
-7-


                                          Monsanto Company
                                      Selected Financial Information
                                           (Dollars in millions)
                                                Unaudited

Condensed Statements of Consolidated Financial Position                   As of           As of
                                                                       Nov. 30, 2006   Aug. 31, 2006
Assets

Current Assets:
  Cash and Cash Equivalents                                                 $ 1,842        $ 1,460
  Short-Term Investments                                                         —              22
  Trade Receivables – Net of Allowances of $305 and $298,
       Respectively                                                            1,306           1,455
  Miscellaneous Receivables                                                      383             344
  Deferred Tax Assets                                                            395             390
  Inventories                                                                  1,954           1,688
  Assets of Discontinued Operations                                                6               6
  Other Current Assets                                                            67              96
Total Current Assets                                                           5,953           5,461

Property, Plant and Equipment – Net                                           2,397           2,418
Goodwill                                                                      1,527           1,522
Other Intangible Assets – Net                                                 1,195           1,229
Noncurrent Deferred Tax Assets                                                  606             625
Other Assets                                                                    462             473
Total Assets                                                                $12,140         $11,728

Liabilities and Shareowners’ Equity

Current Liabilities:
  Short-Term Debt, Including Current Portion of Long-Term Debt             $      42       $      28
  Accounts Payable                                                               477             514
  Income Taxes Payable                                                           188             234
  Accrued Compensation and Benefits                                              178             295
  Accrued Marketing Programs                                                     343             494
  Deferred Revenues                                                              709             120
  Grower Accruals                                                                185              26
  Liabilities of Discontinued Operations                                           2               2
  Miscellaneous Short-Term Accruals                                              557             566
Total Current Liabilities                                                      2,681           2,279

                                                                              1,580           1,639
Long-Term Debt
                                                                                555             600
Postretirement Liabilities
                                                                                150             155
Long-Term Portion of Solutia-Related Reserve
                                                                                513             530
Other Liabilities
                                                                              6,661           6,525
Shareowners’ Equity
Total Liabilities and Shareowners’ Equity                                   $12,140         $11,728

                                                                                20%             20%
Debt to Capital Ratio:


                                                 -more-
-8-


                                           Monsanto Company
                                       Selected Financial Information
                                            (Dollars in millions)
                                                 Unaudited

Statements of Consolidated Cash Flows                                        Three Months Ended
                                                                                   Nov. 30,
                                                                           2006             2005
Operating Activities:
  Net Income                                                                 $    90         $       59
  Adjustments to Reconcile Cash Provided by Operating Activities:
  Items That Did Not Require (Provide) Cash:
     Depreciation and Amortization Expense                                       128               133
     Bad-Debt Expense                                                              9                14
     Stock-Based Compensation Expense                                             18                13
     Excess Tax Benefits from Stock-Based Compensation                           (12)              (10)
     Deferred Income Taxes                                                        (4)               38
     Equity Affiliate Expense – Net                                               10                 7
     Other Items                                                                   3                (7)
  Changes in Assets and Liabilities That Provided (Required) Cash, Net o
Acquisitions:
     Trade Receivables                                                            251               215
     Inventories                                                                 (256)             (221)
     Deferred Revenues                                                            592               610
     Accounts Payable and Other Accrued Liabilities                              (158)             (127)
     PCB Litigation Settlement Proceeds                                             5                  5
     Solutia-Related Payments                                                      (6)                (9)
     Other Items                                                                  (70)               53
Net Cash Provided by Operating Activities                                         600               773

Cash Flows Provided (Required) by Investing Activities:
  Purchases of Short-Term Investments                                              —                (18)
  Maturities of Short-Term Investments                                             22                —
  Capital Expenditures                                                            (92)              (56)
  Acquisitions of Businesses, Net of Cash Acquired                                 —                (53)
  Technology and Other Investments                                                (10)              (10)
  Other Investments and Property Disposal Proceeds                                 13                 2
Net Cash Required by Investing Activities                                         (67)             (135)

Cash Flows Provided (Required) by Financing Activities:
  Net Change in Financing With Less Than 90-Day Maturities                       (1)            (122)
  Short-Term Debt Proceeds                                                        2                 4
  Short-Term Debt Reductions                                                     (8)               (6)
  Long-Term Debt Proceeds                                                         3                 3
  Long-Term Debt Reductions                                                     (69)             (26)
  Payments on Other Financing                                                    (2)               (1)
  Treasury Stock Purchases                                                      (56)              —
  Stock Option Exercises                                                         17               27
  Excess Tax Benefits From Stock-Based Compensation                              12               10
  Dividend Payments                                                             (54)             (46)
Net Cash Required by Financing Activities                                      (156)            (157)
Effect of Exchange Rate Changes on Cash and Cash Equivalents                      5               —
Net Increase in Cash and Cash Equivalents                                       382              481
Cash and Cash Equivalents at Beginning of Period                              1,460              525
Cash and Cash Equivalents at End of Period                                   $1,842           $1,006


                                                  -more-
-9-


                                           Monsanto Company
                                       Selected Financial Information
                                            (Dollars in millions)
                                                 Unaudited

1.   All earnings per share figures have been adjusted to reflect the company’s two-for-one stock split which was
     paid on July 28, 2006, in the form of a 100 percent stock dividend.

2.   EBIT, Ongoing EPS and Free Cash Flow: The presentations of EBIT, ongoing EPS and free cash flow are
     not intended to replace net income (loss), cash flows, financial position or comprehensive income (loss), and
     they are not measures of financial performance as determined in accordance with generally accepted
     accounting principles (GAAP) in the United States. The following tables reconcile EBIT, ongoing EPS and
     free cash flow to the respective most directly comparable financial measure calculated in accordance with
     GAAP.

     Reconciliation of EBIT to Net Income (Loss): EBIT is defined as earnings (loss) before interest and taxes.
     Earnings (loss) is intended to mean net income (loss) as presented in the Statements of Consolidated
     Operations under GAAP. The following table reconciles EBIT to the most directly comparable financial
     measure, which is net income (loss).

                                                                                          Three Months Ended
                                                                                                Nov. 30,
                                                                                           2006        2005
 EBIT – Seeds and Genomics Segment                                                            $1         $ 19
 EBIT – Agricultural Productivity Segment                                                      103          93
 EBIT– Total                                                                                   104        112
 Interest Expense – Net                                                                          3          18
 Income Tax Provision(A)                                                                        11          35
 Net Income                                                                                    $ 90            $ 59

      (A)
              Includes the income tax provision on minority interest income.

     Reconciliation of EPS to Ongoing EPS: Ongoing EPS is calculated excluding certain after-tax items
     which Monsanto does not consider part of ongoing operations. The reconciliation of EPS to ongoing EPS for
     the three months ended Nov. 30, 2006 and 2005, is included on page 1 of this release.

     Reconciliation of Free Cash Flow: Free cash flow represents the total of cash flows from operating
     activities and investing activities, as reflected in the Statements of Consolidated Cash Flows presented in
     this release. With respect to the fiscal year 2007 free cash flow target, Monsanto does not include any
     estimates or projections of Net Cash Provided (Required) by Financing Activities because in order to prepare
     any such estimate or projection, Monsanto would need to rely on market factors and conditions that are
     outside of its control.

                                                                 Fiscal Year       Three Months Ended
                                                                    2007                 Nov. 30,
                                                                   Target           2006        2005
 Net Cash Provided by Operating Activities                    $1,375 – $1,450        $ 600        $ 773
 Net Cash Required by Investing Activities                         (500)                (67)        (135)
 Free Cash Flow                                               $ 875 – $ 950             533          638
 Net Cash Required by Financing Activities                          N/A                (156)        (157)
 Effect of Exchange Rate Changes on Cash and Cash
     Equivalents                                                     N/A                   5              —
 Net Increase in Cash and Cash Equivalents                           N/A                 382             481
 Cash and Cash Equivalents at Beginning of Period                    N/A                                 525
                                                                                       1,460
 Cash and Cash Equivalents at End of Period                          N/A                              $1,006
                                                                                      $1,842


                                                   -oOo-

Mais conteúdo relacionado

Mais procurados

Monsanto Q3 2007 Financial Results
Monsanto Q3 2007 Financial ResultsMonsanto Q3 2007 Financial Results
Monsanto Q3 2007 Financial Resultsearningsreport
 
.progressive mreport-04/06
.progressive mreport-04/06.progressive mreport-04/06
.progressive mreport-04/06finance18
 
celanese q2_2006_pm_e
celanese q2_2006_pm_ecelanese q2_2006_pm_e
celanese q2_2006_pm_efinance44
 
Credit Suisse 16th Annual Chemical Conference
	Credit Suisse 16th Annual Chemical Conference 	Credit Suisse 16th Annual Chemical Conference
Credit Suisse 16th Annual Chemical Conference finance10
 
Monsanto Q2 2008 Financial Results
Monsanto Q2 2008 Financial ResultsMonsanto Q2 2008 Financial Results
Monsanto Q2 2008 Financial Resultsearningsreport
 
Raytheon Reports 2006 Fourth Quarter Results
Raytheon Reports 2006 Fourth Quarter ResultsRaytheon Reports 2006 Fourth Quarter Results
Raytheon Reports 2006 Fourth Quarter Resultsfinance12
 
raytheon Q4 Earnings Presentation
raytheon Q4 Earnings Presentationraytheon Q4 Earnings Presentation
raytheon Q4 Earnings Presentationfinance12
 
raytheon Q4 Earnings Presentation
raytheon Q4 Earnings Presentationraytheon Q4 Earnings Presentation
raytheon Q4 Earnings Presentationfinance12
 
ConAgra QAFY06Q3
ConAgra QAFY06Q3ConAgra QAFY06Q3
ConAgra QAFY06Q3finance21
 
ConAgra QAFY07Q1
ConAgra QAFY07Q1ConAgra QAFY07Q1
ConAgra QAFY07Q1finance21
 
goodrich 4Q07Slides
goodrich  4Q07Slidesgoodrich  4Q07Slides
goodrich 4Q07Slidesfinance44
 

Mais procurados (11)

Monsanto Q3 2007 Financial Results
Monsanto Q3 2007 Financial ResultsMonsanto Q3 2007 Financial Results
Monsanto Q3 2007 Financial Results
 
.progressive mreport-04/06
.progressive mreport-04/06.progressive mreport-04/06
.progressive mreport-04/06
 
celanese q2_2006_pm_e
celanese q2_2006_pm_ecelanese q2_2006_pm_e
celanese q2_2006_pm_e
 
Credit Suisse 16th Annual Chemical Conference
	Credit Suisse 16th Annual Chemical Conference 	Credit Suisse 16th Annual Chemical Conference
Credit Suisse 16th Annual Chemical Conference
 
Monsanto Q2 2008 Financial Results
Monsanto Q2 2008 Financial ResultsMonsanto Q2 2008 Financial Results
Monsanto Q2 2008 Financial Results
 
Raytheon Reports 2006 Fourth Quarter Results
Raytheon Reports 2006 Fourth Quarter ResultsRaytheon Reports 2006 Fourth Quarter Results
Raytheon Reports 2006 Fourth Quarter Results
 
raytheon Q4 Earnings Presentation
raytheon Q4 Earnings Presentationraytheon Q4 Earnings Presentation
raytheon Q4 Earnings Presentation
 
raytheon Q4 Earnings Presentation
raytheon Q4 Earnings Presentationraytheon Q4 Earnings Presentation
raytheon Q4 Earnings Presentation
 
ConAgra QAFY06Q3
ConAgra QAFY06Q3ConAgra QAFY06Q3
ConAgra QAFY06Q3
 
ConAgra QAFY07Q1
ConAgra QAFY07Q1ConAgra QAFY07Q1
ConAgra QAFY07Q1
 
goodrich 4Q07Slides
goodrich  4Q07Slidesgoodrich  4Q07Slides
goodrich 4Q07Slides
 

Destaque

cit B6ECBCC8-387D-47CD-8386-D05A207C86FB_34562pr11clean
cit B6ECBCC8-387D-47CD-8386-D05A207C86FB_34562pr11cleancit B6ECBCC8-387D-47CD-8386-D05A207C86FB_34562pr11clean
cit B6ECBCC8-387D-47CD-8386-D05A207C86FB_34562pr11cleanfinance28
 
CIT AR 06_full
CIT AR 06_fullCIT AR 06_full
CIT AR 06_fullfinance28
 
.monsanto Q3 2006Earning Release
.monsanto Q3 2006Earning Release.monsanto Q3 2006Earning Release
.monsanto Q3 2006Earning Releasefinance28
 
CIT%20Q3%202008%20Earnings%20Results
CIT%20Q3%202008%20Earnings%20ResultsCIT%20Q3%202008%20Earnings%20Results
CIT%20Q3%202008%20Earnings%20Resultsfinance28
 
monsanto 11-10-05e
monsanto 11-10-05emonsanto 11-10-05e
monsanto 11-10-05efinance28
 
monsanto 11-10-05a
monsanto 11-10-05amonsanto 11-10-05a
monsanto 11-10-05afinance28
 
.monsanto 06-28-07
.monsanto 06-28-07.monsanto 06-28-07
.monsanto 06-28-07finance28
 
monsanto 01-04-06a
monsanto 01-04-06amonsanto 01-04-06a
monsanto 01-04-06afinance28
 
monsanto 02-14-06b
monsanto 02-14-06bmonsanto 02-14-06b
monsanto 02-14-06bfinance28
 
monsanto 09-21-05
monsanto 09-21-05monsanto 09-21-05
monsanto 09-21-05finance28
 
.monsanto 04-02-08
.monsanto 04-02-08.monsanto 04-02-08
.monsanto 04-02-08finance28
 
.monsanto 01-04-06b
.monsanto 01-04-06b.monsanto 01-04-06b
.monsanto 01-04-06bfinance28
 
monsanto 09-20-06
monsanto 09-20-06monsanto 09-20-06
monsanto 09-20-06finance28
 
monsanto 03-30-06
monsanto 03-30-06monsanto 03-30-06
monsanto 03-30-06finance28
 
monsanto 08-01-05
monsanto 08-01-05monsanto 08-01-05
monsanto 08-01-05finance28
 
monsanto 05-31-06
monsanto 05-31-06monsanto 05-31-06
monsanto 05-31-06finance28
 
monsanto EU_HughGrant_1110006
monsanto EU_HughGrant_1110006monsanto EU_HughGrant_1110006
monsanto EU_HughGrant_1110006finance28
 
monsanto 07-12-06a
monsanto 07-12-06amonsanto 07-12-06a
monsanto 07-12-06afinance28
 
monsanto 08-23-05
monsanto 08-23-05monsanto 08-23-05
monsanto 08-23-05finance28
 
Cameroun cv eliane paule meubeukui_ana24
Cameroun  cv  eliane paule meubeukui_ana24Cameroun  cv  eliane paule meubeukui_ana24
Cameroun cv eliane paule meubeukui_ana24MEUBEUKUI Eliane Paule
 

Destaque (20)

cit B6ECBCC8-387D-47CD-8386-D05A207C86FB_34562pr11clean
cit B6ECBCC8-387D-47CD-8386-D05A207C86FB_34562pr11cleancit B6ECBCC8-387D-47CD-8386-D05A207C86FB_34562pr11clean
cit B6ECBCC8-387D-47CD-8386-D05A207C86FB_34562pr11clean
 
CIT AR 06_full
CIT AR 06_fullCIT AR 06_full
CIT AR 06_full
 
.monsanto Q3 2006Earning Release
.monsanto Q3 2006Earning Release.monsanto Q3 2006Earning Release
.monsanto Q3 2006Earning Release
 
CIT%20Q3%202008%20Earnings%20Results
CIT%20Q3%202008%20Earnings%20ResultsCIT%20Q3%202008%20Earnings%20Results
CIT%20Q3%202008%20Earnings%20Results
 
monsanto 11-10-05e
monsanto 11-10-05emonsanto 11-10-05e
monsanto 11-10-05e
 
monsanto 11-10-05a
monsanto 11-10-05amonsanto 11-10-05a
monsanto 11-10-05a
 
.monsanto 06-28-07
.monsanto 06-28-07.monsanto 06-28-07
.monsanto 06-28-07
 
monsanto 01-04-06a
monsanto 01-04-06amonsanto 01-04-06a
monsanto 01-04-06a
 
monsanto 02-14-06b
monsanto 02-14-06bmonsanto 02-14-06b
monsanto 02-14-06b
 
monsanto 09-21-05
monsanto 09-21-05monsanto 09-21-05
monsanto 09-21-05
 
.monsanto 04-02-08
.monsanto 04-02-08.monsanto 04-02-08
.monsanto 04-02-08
 
.monsanto 01-04-06b
.monsanto 01-04-06b.monsanto 01-04-06b
.monsanto 01-04-06b
 
monsanto 09-20-06
monsanto 09-20-06monsanto 09-20-06
monsanto 09-20-06
 
monsanto 03-30-06
monsanto 03-30-06monsanto 03-30-06
monsanto 03-30-06
 
monsanto 08-01-05
monsanto 08-01-05monsanto 08-01-05
monsanto 08-01-05
 
monsanto 05-31-06
monsanto 05-31-06monsanto 05-31-06
monsanto 05-31-06
 
monsanto EU_HughGrant_1110006
monsanto EU_HughGrant_1110006monsanto EU_HughGrant_1110006
monsanto EU_HughGrant_1110006
 
monsanto 07-12-06a
monsanto 07-12-06amonsanto 07-12-06a
monsanto 07-12-06a
 
monsanto 08-23-05
monsanto 08-23-05monsanto 08-23-05
monsanto 08-23-05
 
Cameroun cv eliane paule meubeukui_ana24
Cameroun  cv  eliane paule meubeukui_ana24Cameroun  cv  eliane paule meubeukui_ana24
Cameroun cv eliane paule meubeukui_ana24
 

Semelhante a .monsanto Q1 2007 Earnings Release

.monsanto Q42006EarningsRelease
.monsanto Q42006EarningsRelease.monsanto Q42006EarningsRelease
.monsanto Q42006EarningsReleasefinance28
 
monsanto 04-02-08
monsanto 04-02-08monsanto 04-02-08
monsanto 04-02-08finance28
 
monsanto 04-02-08
monsanto 04-02-08monsanto 04-02-08
monsanto 04-02-08finance28
 
.monsanto 10-10-07
.monsanto 10-10-07.monsanto 10-10-07
.monsanto 10-10-07finance28
 
Monsanto Q4 2007 Financial Results
Monsanto Q4 2007 Financial ResultsMonsanto Q4 2007 Financial Results
Monsanto Q4 2007 Financial Resultsearningsreport
 
monsanto 10-10-07
monsanto 10-10-07monsanto 10-10-07
monsanto 10-10-07finance28
 
progressive mreport-01/07
progressive mreport-01/07progressive mreport-01/07
progressive mreport-01/07finance18
 
progressive mreport-01/07
progressive mreport-01/07progressive mreport-01/07
progressive mreport-01/07finance18
 
CONAGRA 2008 AR
CONAGRA 2008 ARCONAGRA 2008 AR
CONAGRA 2008 ARfinance21
 
progressive mreport-03/07
progressive mreport-03/07progressive mreport-03/07
progressive mreport-03/07finance18
 
progressive mreport-03/07
progressive mreport-03/07progressive mreport-03/07
progressive mreport-03/07finance18
 
monsanto 01-08-08
monsanto 01-08-08monsanto 01-08-08
monsanto 01-08-08finance28
 
monsanto 01-08-08
monsanto 01-08-08monsanto 01-08-08
monsanto 01-08-08finance28
 
monsanto 01-08-08
monsanto 01-08-08monsanto 01-08-08
monsanto 01-08-08finance28
 
.progressive mreport-01/06
.progressive mreport-01/06.progressive mreport-01/06
.progressive mreport-01/06finance18
 
.progressive mreport-01/06
.progressive mreport-01/06.progressive mreport-01/06
.progressive mreport-01/06finance18
 
progressive mreport-04/07
progressive mreport-04/07progressive mreport-04/07
progressive mreport-04/07finance18
 
progressive mreport-04/07
progressive mreport-04/07progressive mreport-04/07
progressive mreport-04/07finance18
 
monsanto supplemental_toolkit
monsanto supplemental_toolkitmonsanto supplemental_toolkit
monsanto supplemental_toolkitfinance28
 
supplemental_toolkit
supplemental_toolkitsupplemental_toolkit
supplemental_toolkitfinance28
 

Semelhante a .monsanto Q1 2007 Earnings Release (20)

.monsanto Q42006EarningsRelease
.monsanto Q42006EarningsRelease.monsanto Q42006EarningsRelease
.monsanto Q42006EarningsRelease
 
monsanto 04-02-08
monsanto 04-02-08monsanto 04-02-08
monsanto 04-02-08
 
monsanto 04-02-08
monsanto 04-02-08monsanto 04-02-08
monsanto 04-02-08
 
.monsanto 10-10-07
.monsanto 10-10-07.monsanto 10-10-07
.monsanto 10-10-07
 
Monsanto Q4 2007 Financial Results
Monsanto Q4 2007 Financial ResultsMonsanto Q4 2007 Financial Results
Monsanto Q4 2007 Financial Results
 
monsanto 10-10-07
monsanto 10-10-07monsanto 10-10-07
monsanto 10-10-07
 
progressive mreport-01/07
progressive mreport-01/07progressive mreport-01/07
progressive mreport-01/07
 
progressive mreport-01/07
progressive mreport-01/07progressive mreport-01/07
progressive mreport-01/07
 
CONAGRA 2008 AR
CONAGRA 2008 ARCONAGRA 2008 AR
CONAGRA 2008 AR
 
progressive mreport-03/07
progressive mreport-03/07progressive mreport-03/07
progressive mreport-03/07
 
progressive mreport-03/07
progressive mreport-03/07progressive mreport-03/07
progressive mreport-03/07
 
monsanto 01-08-08
monsanto 01-08-08monsanto 01-08-08
monsanto 01-08-08
 
monsanto 01-08-08
monsanto 01-08-08monsanto 01-08-08
monsanto 01-08-08
 
monsanto 01-08-08
monsanto 01-08-08monsanto 01-08-08
monsanto 01-08-08
 
.progressive mreport-01/06
.progressive mreport-01/06.progressive mreport-01/06
.progressive mreport-01/06
 
.progressive mreport-01/06
.progressive mreport-01/06.progressive mreport-01/06
.progressive mreport-01/06
 
progressive mreport-04/07
progressive mreport-04/07progressive mreport-04/07
progressive mreport-04/07
 
progressive mreport-04/07
progressive mreport-04/07progressive mreport-04/07
progressive mreport-04/07
 
monsanto supplemental_toolkit
monsanto supplemental_toolkitmonsanto supplemental_toolkit
monsanto supplemental_toolkit
 
supplemental_toolkit
supplemental_toolkitsupplemental_toolkit
supplemental_toolkit
 

Mais de finance28

virgin media.FINAL_Q4_06_Presentation_VMED
virgin media.FINAL_Q4_06_Presentation_VMEDvirgin media.FINAL_Q4_06_Presentation_VMED
virgin media.FINAL_Q4_06_Presentation_VMEDfinance28
 
virgin media.FINAL_Q4_06_Presentation_VMED
virgin media.FINAL_Q4_06_Presentation_VMEDvirgin media.FINAL_Q4_06_Presentation_VMED
virgin media.FINAL_Q4_06_Presentation_VMEDfinance28
 
virgin media.Q1_07_Analyst_presentation_FINAL
virgin media.Q1_07_Analyst_presentation_FINALvirgin media.Q1_07_Analyst_presentation_FINAL
virgin media.Q1_07_Analyst_presentation_FINALfinance28
 
virgin media.Q1_07_Analyst_presentation_FINAL
virgin media.Q1_07_Analyst_presentation_FINALvirgin media.Q1_07_Analyst_presentation_FINAL
virgin media.Q1_07_Analyst_presentation_FINALfinance28
 
virgin media.Q2-07_Analyst_presentation
virgin media.Q2-07_Analyst_presentationvirgin media.Q2-07_Analyst_presentation
virgin media.Q2-07_Analyst_presentationfinance28
 
virgin media.Q2-07_Analyst_presentation
virgin media.Q2-07_Analyst_presentationvirgin media.Q2-07_Analyst_presentation
virgin media.Q2-07_Analyst_presentationfinance28
 
virgin media.Q3_07_AnalystPresentation
virgin media.Q3_07_AnalystPresentationvirgin media.Q3_07_AnalystPresentation
virgin media.Q3_07_AnalystPresentationfinance28
 
virgin media.Q3_07_AnalystPresentation
virgin media.Q3_07_AnalystPresentationvirgin media.Q3_07_AnalystPresentation
virgin media.Q3_07_AnalystPresentationfinance28
 
virgin media.UBS_vmed_December07_FINAL
virgin media.UBS_vmed_December07_FINALvirgin media.UBS_vmed_December07_FINAL
virgin media.UBS_vmed_December07_FINALfinance28
 
virgin media.UBS_vmed_December07_FINAL
virgin media.UBS_vmed_December07_FINALvirgin media.UBS_vmed_December07_FINAL
virgin media.UBS_vmed_December07_FINALfinance28
 
virgin media._Q12008_presentation
virgin media._Q12008_presentationvirgin media._Q12008_presentation
virgin media._Q12008_presentationfinance28
 
virgin media.VMED_Q12008_presentation
virgin media.VMED_Q12008_presentationvirgin media.VMED_Q12008_presentation
virgin media.VMED_Q12008_presentationfinance28
 
virgin media.FINAL_Q208_Presentation
virgin media.FINAL_Q208_Presentationvirgin media.FINAL_Q208_Presentation
virgin media.FINAL_Q208_Presentationfinance28
 
virgin media.FINAL_Q208_Presentation
virgin media.FINAL_Q208_Presentationvirgin media.FINAL_Q208_Presentation
virgin media.FINAL_Q208_Presentationfinance28
 
virgin media.Q3_08_Presentation
virgin media.Q3_08_Presentationvirgin media.Q3_08_Presentation
virgin media.Q3_08_Presentationfinance28
 
virgin media.Q3_08_Presentation
virgin media.Q3_08_Presentationvirgin media.Q3_08_Presentation
virgin media.Q3_08_Presentationfinance28
 
virgin media.Analyst_day_november112008
virgin media.Analyst_day_november112008virgin media.Analyst_day_november112008
virgin media.Analyst_day_november112008finance28
 
virgin media.Analyst_day_november112008
virgin media.Analyst_day_november112008virgin media.Analyst_day_november112008
virgin media.Analyst_day_november112008finance28
 
virgin media.london_nov132008
virgin media.london_nov132008virgin media.london_nov132008
virgin media.london_nov132008finance28
 
virgin media.london_nov132008
virgin media.london_nov132008virgin media.london_nov132008
virgin media.london_nov132008finance28
 

Mais de finance28 (20)

virgin media.FINAL_Q4_06_Presentation_VMED
virgin media.FINAL_Q4_06_Presentation_VMEDvirgin media.FINAL_Q4_06_Presentation_VMED
virgin media.FINAL_Q4_06_Presentation_VMED
 
virgin media.FINAL_Q4_06_Presentation_VMED
virgin media.FINAL_Q4_06_Presentation_VMEDvirgin media.FINAL_Q4_06_Presentation_VMED
virgin media.FINAL_Q4_06_Presentation_VMED
 
virgin media.Q1_07_Analyst_presentation_FINAL
virgin media.Q1_07_Analyst_presentation_FINALvirgin media.Q1_07_Analyst_presentation_FINAL
virgin media.Q1_07_Analyst_presentation_FINAL
 
virgin media.Q1_07_Analyst_presentation_FINAL
virgin media.Q1_07_Analyst_presentation_FINALvirgin media.Q1_07_Analyst_presentation_FINAL
virgin media.Q1_07_Analyst_presentation_FINAL
 
virgin media.Q2-07_Analyst_presentation
virgin media.Q2-07_Analyst_presentationvirgin media.Q2-07_Analyst_presentation
virgin media.Q2-07_Analyst_presentation
 
virgin media.Q2-07_Analyst_presentation
virgin media.Q2-07_Analyst_presentationvirgin media.Q2-07_Analyst_presentation
virgin media.Q2-07_Analyst_presentation
 
virgin media.Q3_07_AnalystPresentation
virgin media.Q3_07_AnalystPresentationvirgin media.Q3_07_AnalystPresentation
virgin media.Q3_07_AnalystPresentation
 
virgin media.Q3_07_AnalystPresentation
virgin media.Q3_07_AnalystPresentationvirgin media.Q3_07_AnalystPresentation
virgin media.Q3_07_AnalystPresentation
 
virgin media.UBS_vmed_December07_FINAL
virgin media.UBS_vmed_December07_FINALvirgin media.UBS_vmed_December07_FINAL
virgin media.UBS_vmed_December07_FINAL
 
virgin media.UBS_vmed_December07_FINAL
virgin media.UBS_vmed_December07_FINALvirgin media.UBS_vmed_December07_FINAL
virgin media.UBS_vmed_December07_FINAL
 
virgin media._Q12008_presentation
virgin media._Q12008_presentationvirgin media._Q12008_presentation
virgin media._Q12008_presentation
 
virgin media.VMED_Q12008_presentation
virgin media.VMED_Q12008_presentationvirgin media.VMED_Q12008_presentation
virgin media.VMED_Q12008_presentation
 
virgin media.FINAL_Q208_Presentation
virgin media.FINAL_Q208_Presentationvirgin media.FINAL_Q208_Presentation
virgin media.FINAL_Q208_Presentation
 
virgin media.FINAL_Q208_Presentation
virgin media.FINAL_Q208_Presentationvirgin media.FINAL_Q208_Presentation
virgin media.FINAL_Q208_Presentation
 
virgin media.Q3_08_Presentation
virgin media.Q3_08_Presentationvirgin media.Q3_08_Presentation
virgin media.Q3_08_Presentation
 
virgin media.Q3_08_Presentation
virgin media.Q3_08_Presentationvirgin media.Q3_08_Presentation
virgin media.Q3_08_Presentation
 
virgin media.Analyst_day_november112008
virgin media.Analyst_day_november112008virgin media.Analyst_day_november112008
virgin media.Analyst_day_november112008
 
virgin media.Analyst_day_november112008
virgin media.Analyst_day_november112008virgin media.Analyst_day_november112008
virgin media.Analyst_day_november112008
 
virgin media.london_nov132008
virgin media.london_nov132008virgin media.london_nov132008
virgin media.london_nov132008
 
virgin media.london_nov132008
virgin media.london_nov132008virgin media.london_nov132008
virgin media.london_nov132008
 

Último

Financial analysis on Risk and Return.ppt
Financial analysis on Risk and Return.pptFinancial analysis on Risk and Return.ppt
Financial analysis on Risk and Return.ppttadegebreyesus
 
PMFBY , Pradhan Mantri Fasal bima yojna
PMFBY , Pradhan Mantri  Fasal bima yojnaPMFBY , Pradhan Mantri  Fasal bima yojna
PMFBY , Pradhan Mantri Fasal bima yojnaDharmendra Kumar
 
(中央兰开夏大学毕业证学位证成绩单-案例)
(中央兰开夏大学毕业证学位证成绩单-案例)(中央兰开夏大学毕业证学位证成绩单-案例)
(中央兰开夏大学毕业证学位证成绩单-案例)twfkn8xj
 
BPPG response - Options for Defined Benefit schemes - 19Apr24.pdf
BPPG response - Options for Defined Benefit schemes - 19Apr24.pdfBPPG response - Options for Defined Benefit schemes - 19Apr24.pdf
BPPG response - Options for Defined Benefit schemes - 19Apr24.pdfHenry Tapper
 
『澳洲文凭』买科廷大学毕业证书成绩单办理澳洲Curtin文凭学位证书
『澳洲文凭』买科廷大学毕业证书成绩单办理澳洲Curtin文凭学位证书『澳洲文凭』买科廷大学毕业证书成绩单办理澳洲Curtin文凭学位证书
『澳洲文凭』买科廷大学毕业证书成绩单办理澳洲Curtin文凭学位证书rnrncn29
 
(办理原版一样)QUT毕业证昆士兰科技大学毕业证学位证留信学历认证成绩单补办
(办理原版一样)QUT毕业证昆士兰科技大学毕业证学位证留信学历认证成绩单补办(办理原版一样)QUT毕业证昆士兰科技大学毕业证学位证留信学历认证成绩单补办
(办理原版一样)QUT毕业证昆士兰科技大学毕业证学位证留信学历认证成绩单补办fqiuho152
 
SBP-Market-Operations and market managment
SBP-Market-Operations and market managmentSBP-Market-Operations and market managment
SBP-Market-Operations and market managmentfactical
 
原版1:1复刻堪萨斯大学毕业证KU毕业证留信学历认证
原版1:1复刻堪萨斯大学毕业证KU毕业证留信学历认证原版1:1复刻堪萨斯大学毕业证KU毕业证留信学历认证
原版1:1复刻堪萨斯大学毕业证KU毕业证留信学历认证jdkhjh
 
House of Commons ; CDC schemes overview document
House of Commons ; CDC schemes overview documentHouse of Commons ; CDC schemes overview document
House of Commons ; CDC schemes overview documentHenry Tapper
 
Economic Risk Factor Update: April 2024 [SlideShare]
Economic Risk Factor Update: April 2024 [SlideShare]Economic Risk Factor Update: April 2024 [SlideShare]
Economic Risk Factor Update: April 2024 [SlideShare]Commonwealth
 
Amil Baba In Pakistan amil baba in Lahore amil baba in Islamabad amil baba in...
Amil Baba In Pakistan amil baba in Lahore amil baba in Islamabad amil baba in...Amil Baba In Pakistan amil baba in Lahore amil baba in Islamabad amil baba in...
Amil Baba In Pakistan amil baba in Lahore amil baba in Islamabad amil baba in...amilabibi1
 
NO1 Certified Best Amil In Rawalpindi Bangali Baba In Rawalpindi jadu tona ka...
NO1 Certified Best Amil In Rawalpindi Bangali Baba In Rawalpindi jadu tona ka...NO1 Certified Best Amil In Rawalpindi Bangali Baba In Rawalpindi jadu tona ka...
NO1 Certified Best Amil In Rawalpindi Bangali Baba In Rawalpindi jadu tona ka...Amil baba
 
Managing Finances in a Small Business (yes).pdf
Managing Finances  in a Small Business (yes).pdfManaging Finances  in a Small Business (yes).pdf
Managing Finances in a Small Business (yes).pdfmar yame
 
The Triple Threat | Article on Global Resession | Harsh Kumar
The Triple Threat | Article on Global Resession | Harsh KumarThe Triple Threat | Article on Global Resession | Harsh Kumar
The Triple Threat | Article on Global Resession | Harsh KumarHarsh Kumar
 
Stock Market Brief Deck FOR 4/17 video.pdf
Stock Market Brief Deck FOR 4/17 video.pdfStock Market Brief Deck FOR 4/17 video.pdf
Stock Market Brief Deck FOR 4/17 video.pdfMichael Silva
 
Role of Information and technology in banking and finance .pptx
Role of Information and technology in banking and finance .pptxRole of Information and technology in banking and finance .pptx
Role of Information and technology in banking and finance .pptxNarayaniTripathi2
 
Financial Preparation for Millennia.pptx
Financial Preparation for Millennia.pptxFinancial Preparation for Millennia.pptx
Financial Preparation for Millennia.pptxsimon978302
 
The Core Functions of the Bangko Sentral ng Pilipinas
The Core Functions of the Bangko Sentral ng PilipinasThe Core Functions of the Bangko Sentral ng Pilipinas
The Core Functions of the Bangko Sentral ng PilipinasCherylouCamus
 
《加拿大本地办假证-寻找办理Dalhousie毕业证和达尔豪斯大学毕业证书的中介代理》
《加拿大本地办假证-寻找办理Dalhousie毕业证和达尔豪斯大学毕业证书的中介代理》《加拿大本地办假证-寻找办理Dalhousie毕业证和达尔豪斯大学毕业证书的中介代理》
《加拿大本地办假证-寻找办理Dalhousie毕业证和达尔豪斯大学毕业证书的中介代理》rnrncn29
 
NO1 Certified Amil Baba In Lahore Kala Jadu In Lahore Best Amil In Lahore Ami...
NO1 Certified Amil Baba In Lahore Kala Jadu In Lahore Best Amil In Lahore Ami...NO1 Certified Amil Baba In Lahore Kala Jadu In Lahore Best Amil In Lahore Ami...
NO1 Certified Amil Baba In Lahore Kala Jadu In Lahore Best Amil In Lahore Ami...Amil baba
 

Último (20)

Financial analysis on Risk and Return.ppt
Financial analysis on Risk and Return.pptFinancial analysis on Risk and Return.ppt
Financial analysis on Risk and Return.ppt
 
PMFBY , Pradhan Mantri Fasal bima yojna
PMFBY , Pradhan Mantri  Fasal bima yojnaPMFBY , Pradhan Mantri  Fasal bima yojna
PMFBY , Pradhan Mantri Fasal bima yojna
 
(中央兰开夏大学毕业证学位证成绩单-案例)
(中央兰开夏大学毕业证学位证成绩单-案例)(中央兰开夏大学毕业证学位证成绩单-案例)
(中央兰开夏大学毕业证学位证成绩单-案例)
 
BPPG response - Options for Defined Benefit schemes - 19Apr24.pdf
BPPG response - Options for Defined Benefit schemes - 19Apr24.pdfBPPG response - Options for Defined Benefit schemes - 19Apr24.pdf
BPPG response - Options for Defined Benefit schemes - 19Apr24.pdf
 
『澳洲文凭』买科廷大学毕业证书成绩单办理澳洲Curtin文凭学位证书
『澳洲文凭』买科廷大学毕业证书成绩单办理澳洲Curtin文凭学位证书『澳洲文凭』买科廷大学毕业证书成绩单办理澳洲Curtin文凭学位证书
『澳洲文凭』买科廷大学毕业证书成绩单办理澳洲Curtin文凭学位证书
 
(办理原版一样)QUT毕业证昆士兰科技大学毕业证学位证留信学历认证成绩单补办
(办理原版一样)QUT毕业证昆士兰科技大学毕业证学位证留信学历认证成绩单补办(办理原版一样)QUT毕业证昆士兰科技大学毕业证学位证留信学历认证成绩单补办
(办理原版一样)QUT毕业证昆士兰科技大学毕业证学位证留信学历认证成绩单补办
 
SBP-Market-Operations and market managment
SBP-Market-Operations and market managmentSBP-Market-Operations and market managment
SBP-Market-Operations and market managment
 
原版1:1复刻堪萨斯大学毕业证KU毕业证留信学历认证
原版1:1复刻堪萨斯大学毕业证KU毕业证留信学历认证原版1:1复刻堪萨斯大学毕业证KU毕业证留信学历认证
原版1:1复刻堪萨斯大学毕业证KU毕业证留信学历认证
 
House of Commons ; CDC schemes overview document
House of Commons ; CDC schemes overview documentHouse of Commons ; CDC schemes overview document
House of Commons ; CDC schemes overview document
 
Economic Risk Factor Update: April 2024 [SlideShare]
Economic Risk Factor Update: April 2024 [SlideShare]Economic Risk Factor Update: April 2024 [SlideShare]
Economic Risk Factor Update: April 2024 [SlideShare]
 
Amil Baba In Pakistan amil baba in Lahore amil baba in Islamabad amil baba in...
Amil Baba In Pakistan amil baba in Lahore amil baba in Islamabad amil baba in...Amil Baba In Pakistan amil baba in Lahore amil baba in Islamabad amil baba in...
Amil Baba In Pakistan amil baba in Lahore amil baba in Islamabad amil baba in...
 
NO1 Certified Best Amil In Rawalpindi Bangali Baba In Rawalpindi jadu tona ka...
NO1 Certified Best Amil In Rawalpindi Bangali Baba In Rawalpindi jadu tona ka...NO1 Certified Best Amil In Rawalpindi Bangali Baba In Rawalpindi jadu tona ka...
NO1 Certified Best Amil In Rawalpindi Bangali Baba In Rawalpindi jadu tona ka...
 
Managing Finances in a Small Business (yes).pdf
Managing Finances  in a Small Business (yes).pdfManaging Finances  in a Small Business (yes).pdf
Managing Finances in a Small Business (yes).pdf
 
The Triple Threat | Article on Global Resession | Harsh Kumar
The Triple Threat | Article on Global Resession | Harsh KumarThe Triple Threat | Article on Global Resession | Harsh Kumar
The Triple Threat | Article on Global Resession | Harsh Kumar
 
Stock Market Brief Deck FOR 4/17 video.pdf
Stock Market Brief Deck FOR 4/17 video.pdfStock Market Brief Deck FOR 4/17 video.pdf
Stock Market Brief Deck FOR 4/17 video.pdf
 
Role of Information and technology in banking and finance .pptx
Role of Information and technology in banking and finance .pptxRole of Information and technology in banking and finance .pptx
Role of Information and technology in banking and finance .pptx
 
Financial Preparation for Millennia.pptx
Financial Preparation for Millennia.pptxFinancial Preparation for Millennia.pptx
Financial Preparation for Millennia.pptx
 
The Core Functions of the Bangko Sentral ng Pilipinas
The Core Functions of the Bangko Sentral ng PilipinasThe Core Functions of the Bangko Sentral ng Pilipinas
The Core Functions of the Bangko Sentral ng Pilipinas
 
《加拿大本地办假证-寻找办理Dalhousie毕业证和达尔豪斯大学毕业证书的中介代理》
《加拿大本地办假证-寻找办理Dalhousie毕业证和达尔豪斯大学毕业证书的中介代理》《加拿大本地办假证-寻找办理Dalhousie毕业证和达尔豪斯大学毕业证书的中介代理》
《加拿大本地办假证-寻找办理Dalhousie毕业证和达尔豪斯大学毕业证书的中介代理》
 
NO1 Certified Amil Baba In Lahore Kala Jadu In Lahore Best Amil In Lahore Ami...
NO1 Certified Amil Baba In Lahore Kala Jadu In Lahore Best Amil In Lahore Ami...NO1 Certified Amil Baba In Lahore Kala Jadu In Lahore Best Amil In Lahore Ami...
NO1 Certified Amil Baba In Lahore Kala Jadu In Lahore Best Amil In Lahore Ami...
 

.monsanto Q1 2007 Earnings Release

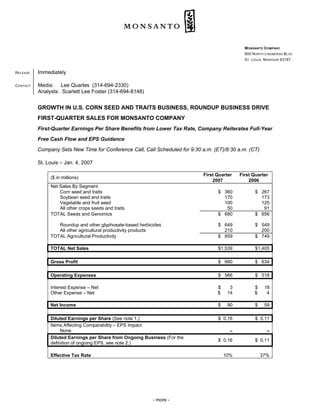
  • 1. MONSANTO COMPANY 800 NORTH LINDBERGH BLVD ST. LOUIS, MISSOURI 63167 Immediately RELEASE Media: Lee Quarles (314-694-2330) CONTACT Analysts: Scarlett Lee Foster (314-694-8148) GROWTH IN U.S. CORN SEED AND TRAITS BUSINESS, ROUNDUP BUSINESS DRIVE FIRST-QUARTER SALES FOR MONSANTO COMPANY First-Quarter Earnings Per Share Benefits from Lower Tax Rate, Company Reiterates Full-Year Free Cash Flow and EPS Guidance Company Sets New Time for Conference Call, Call Scheduled for 9:30 a.m. (ET)/8:30 a.m. (CT) St. Louis – Jan. 4, 2007 First Quarter First Quarter ($ in millions) 2007 2006 Net Sales By Segment Corn seed and traits $ 360 $ 267 Soybean seed and traits 170 173 Vegetable and fruit seed 100 125 All other crops seeds and traits 50 91 TOTAL Seeds and Genomics $ 680 $ 656 Roundup and other glyphosate-based herbicides $ 649 $ 549 All other agricultural productivity products 210 200 TOTAL Agricultural Productivity $ 859 $ 749 $1,539 $1,405 TOTAL Net Sales $ 680 $ 634 Gross Profit $ 566 $ 518 Operating Expenses Interest Expense – Net $ 3 $ 18 Other Expense – Net $ 14 $ 4 $ 90 $ 59 Net Income $ 0.16 $ 0.11 Diluted Earnings per Share (See note 1.) Items Affecting Comparability – EPS Impact None – – Diluted Earnings per Share from Ongoing Business (For the $ 0.16 $ 0.11 definition of ongoing EPS, see note 2.) 10% 37% Effective Tax Rate - more -
  • 2. -2- First Quarter First Quarter 2007 2006 Comparison as a Percent of Net Sales: Gross profit 44% 45% Selling, general and administrative expenses (SG&A) 25% 25% Research and development expenses 12% 12% Income before income taxes and minority interest 6% 7% Net income 6% 4% Comment from Monsanto Chairman, President and Chief Executive Officer Hugh Grant: “We remain focused on delivering the next generation of innovation to the farm by offering our farmer customers meaningful seed and trait technologies. Our results in the first quarter are testament to this commitment and the value our products are providing farmers. Backed by the solid performance of our seeds and traits business including strong early demand for our triple-trait corn technology in the United States, we believe our business is on track for another strong year.” Market Conditions The winter months in the Northern Hemisphere agricultural markets provide farmers with an opportunity to review their input costs for the 2007 season – including new seed, trait and chemistry offerings. Strong early-season order patterns in the United States for the company’s corn business are reinforcing growth trends in the company’s branded seed business and adoption of trait technologies, particularly its triple- trait corn technology. Monsanto currently expects that total soybean acres under production may decrease slightly during this growing season as farmers increase the number of acres planted to corn in the United States. However, the company noted that final planted acres will be based on a number of factors leading up to planting, including commodity prices and weather. The planting season is well under way in the Southern Hemisphere. In Australia, drought conditions have strained the productivity of cotton farmers within the country and reduced the number of acres devoted to cotton production by half. In Brazil, recent estimates suggest that total soybean production in the country could be in the range of 50 million acres. Operations Update The company reported net sales for the first quarter of fiscal year 2007, which were 10 percent higher than those in the first quarter of fiscal year 2006. Key drivers for the quarter were stronger adoption of the company’s corn seed and trait technologies in the United States, and greater volumes of Roundup herbicides in the United States and Brazil. For the first quarter of fiscal year 2007, Monsanto recorded net income of $90 million compared with net income of $59 million for the same period last year. Earnings per share (EPS) for the quarter, both on an as-reported and ongoing basis, were 16 cents a share. The company’s first quarter results reflected a lower tax rate in the quarter primarily stemming from the conclusion of an ex-U.S. audit. Monsanto believes that the company’s full-year tax rate will be in the 30 percent range. Cash Flow For first-quarter fiscal year 2007, net cash provided by operating activities was $600 million, compared with $773 million in the first-quarter of fiscal year 2006. Net cash required by investing activities was $67 million for the first-quarter of fiscal year 2007, compared to net cash required of $135 million for the same fiscal year 2006 quarter. As a result, free cash flow was $533 million for the first-quarter fiscal year 2007, compared with $638 million for the same quarter in fiscal year 2006. (For a reconciliation of free cash flow, see note 2.) The decrease in the quarter related primarily to changes in inventories and accrued liabilities which affected operating cash during the quarter. Net cash required by financing activities was $156 million for the first quarter of fiscal year 2007, compared with net cash required of $157 million for the same period in fiscal year 2006. -more-
  • 3. -3- Outlook The second and third quarters of fiscal year 2007 are expected to be the primary drivers for the company’s fiscal year 2007 EPS results. These quarters reflect both the relative size of the company’s U.S. business and the importance of its seeds-and-traits business to Monsanto’s earnings. Monsanto now expects that its full-year 2007 EPS guidance could be toward the upper end of its previously announced range of $1.50 to $1.57, both on a reported and ongoing basis. The company continues to expect free cash flow for fiscal year 2007 to be in the range of $875 million to $950 million. The company expects net cash provided by operating activities to be in the range of $1.375 billion to $1.450 billion, and net cash required by investing activities to be approximately $500 million for fiscal year 2007. (For a reconciliation of free cash flow, see note 2.) Seeds and Genomics Segment Detail ($ in millions) Net Sales Gross Profit First First First First Seeds and Genomics Quarter Quarter Quarter Quarter 2007 2006 2007 2006 $360 $267 $223 $153 Corn seed and traits 170 173 122 114 Soybean seed and traits 100 125 51 63 Vegetable and fruit seed 50 91 18 56 All other crops seeds and traits TOTAL Seeds and Genomics $680 $656 $414 $386 Earnings Before ($ in millions) Interest & Taxes (EBIT) First First Seeds and Genomics Quarter Quarter 2007 2006 EBIT (For a reconciliation of EBIT, see note 2.) $1 $19 None None Unusual Items Affecting EBIT The Seeds and Genomics segment consists of the company’s global seeds and traits business, and genetic technology platforms. Sales for Monsanto’s Seeds and Genomics segment were $680 million for the first quarter of fiscal year 2007, or higher than the same period last year. Results in the quarter benefited from increased sales of the company’s corn seed and traits business, which were 35 percent higher when compared with sales in the same period last year. During the quarter, Monsanto’s U.S. corn business realized strong early orders for the company’s corn products – including its higher margin triple-trait technology which offers farmers both above-the-ground and below-the-ground insect protection, as well as weed control flexibility. Monsanto reiterated that the company’s DEKALB and Asgrow national corn brands could have more than 35 percent of all of its seed sold in a triple stack during the 2007 growing season. Sales in the quarter were partially offset by lower volume of the company’s cotton traits in Australia as drought conditions there halved the total cotton production area. Results in the quarter were also partially offset by lower revenues from the Seminis vegetable and fruit seed business, primarily a function of the timing of seed sales in 2007 when compared with 2006 sales. -more-
  • 4. -4- Agricultural Productivity Segment Detail ($ in millions) Net Sales Gross Profit First First First First Agricultural Productivity Quarter Quarter Quarter Quarter 2007 2006 2007 2006 Roundup and other glyphosate- $649 $549 $194 $182 based herbicides All other agricultural 210 200 72 66 productivity products TOTAL Agricultural Productivity $859 $749 $266 $248 Earnings Before ($ in millions) Interest & Taxes (EBIT) First First Agricultural Productivity Quarter Quarter 2007 2006 EBIT (For a reconciliation of EBIT, see note 2.) $103 $93 None None Unusual Items Affecting EBIT The Agricultural Productivity segment consists primarily of crop protection products, residential lawn-and- garden herbicide products, and the company’s animal agricultural businesses. Sales for Monsanto’s Agricultural Productivity segment were $859 million for the first quarter of fiscal year 2007, or 15 percent higher compared with sales in the same period last year. The primary contributor to the segment’s growth in the quarter was stronger volumes of Roundup herbicides in the United States and Brazil. Gross profit for the segment in the first quarter was slightly higher when compared with gross profit in the same period last year. As a percent of sales, gross profit for the segment was slightly less, as the company experienced higher raw material and energy costs for production of Roundup and other glyphosate-based herbicides. Webcast Information In conjunction with this announcement, Monsanto will hold a conference call at 8:30 a.m. central time (9:30 a.m. eastern time) today. The call will focus on these results, future expectations and an update of projects within the company’s R&D pipeline. The call may also include a discussion of Monsanto’s strategic initiatives, product performance and other matters related to the company’s business. Presentation slides and a simultaneous audio webcast of the conference call may be accessed by visiting the company’s web site at www.monsanto.com and clicking on “Investor Information.” Visitors may need to download Windows Media Player™ prior to listening to the webcast. Following the live broadcast, a replay of the webcast will be available on the Monsanto Web site for three weeks. About Monsanto Company Monsanto Company is a leading global provider of technology-based solutions and agricultural products that improve farm productivity and food quality. For more information on Monsanto, see www.monsanto.com. -oOo- -more-
  • 5. -5- Cautionary Statements Regarding Forward-Looking Information: Certain statements contained in this release are quot;forward-looking statements,quot; such as statements concerning the company's anticipated financial results, current and future product performance, regulatory approvals, business and financial plans and other non-historical facts. These statements are based on current expectations and currently available information. However, since these statements are based on factors that involve risks and uncertainties, the company's actual performance and results may differ materially from those described or implied by such forward-looking statements. Factors that could cause or contribute to such differences include, among others: continued competition in seeds, traits and agricultural chemicals; the company's exposure to various contingencies, including those related to intellectual property protection, regulatory compliance and the speed with which approvals are received, and public acceptance of biotechnology products; the success of the company's research and development activities; the outcomes of major lawsuits, including proceedings related to Solutia Inc.; developments related to foreign currencies and economies; successful completion and operation of recent and proposed acquisitions, including Delta and Pine Land Company; fluctuations in commodity prices; compliance with regulations affecting our manufacturing; the accuracy of the company's estimates related to distribution inventory levels; the company's ability to fund its short-term financing needs and to obtain payment for the products that it sells; the effect of weather conditions, natural disasters and accidents on the agriculture business or the company's facilities; and other risks and factors detailed in the company's most recent periodic report to the SEC. Undue reliance should not be placed on these forward-looking statements, which are current only as of the date of this release. The company disclaims any current intention or obligation to update any forward-looking statements or any of the factors that may affect actual results. Notes to editors: DEKALB, Asgrow and Roundup are trademarks of Monsanto Company and its wholly owned subsidiaries. References to Roundup herbicides in this release mean Roundup branded herbicides, excluding lawn- and-garden herbicide products. -more-
  • 6. -6- Monsanto Company Selected Financial Information (Dollars in millions, except per share amounts) Unaudited Statements of Consolidated Operations Three Months Ended Nov. 30, 2006 2005 Net Sales $1,539 $1,405 Cost of Goods Sold 859 771 Gross Profit 680 634 Operating Expenses: Selling, General and Administrative Expenses 384 350 Research and Development Expenses 182 168 Total Operating Expenses 566 518 Income From Operations 114 116 Interest Expense 33 32 Interest Income (30) (14) Solutia-Related Expenses 10 6 Other Expense (Income) – Net 4 (2) Income Before Income Taxes and Minority Interest 97 94 Income Tax Provision 10 35 Minority Interest Income (3) — Net Income $ 90 $ 59 EBIT (see note 2) $ 104 $ 112 Basic Earnings per Share (see note 1) $ 0.17 $ 0.11 Diluted Earnings per Share (see note 1) $ 0.16 $ 0.11 Weighted Average Shares Outstanding (see note 1): Basic 543.1 536.8 Diluted 553.6 547.3 -more-
  • 7. -7- Monsanto Company Selected Financial Information (Dollars in millions) Unaudited Condensed Statements of Consolidated Financial Position As of As of Nov. 30, 2006 Aug. 31, 2006 Assets Current Assets: Cash and Cash Equivalents $ 1,842 $ 1,460 Short-Term Investments — 22 Trade Receivables – Net of Allowances of $305 and $298, Respectively 1,306 1,455 Miscellaneous Receivables 383 344 Deferred Tax Assets 395 390 Inventories 1,954 1,688 Assets of Discontinued Operations 6 6 Other Current Assets 67 96 Total Current Assets 5,953 5,461 Property, Plant and Equipment – Net 2,397 2,418 Goodwill 1,527 1,522 Other Intangible Assets – Net 1,195 1,229 Noncurrent Deferred Tax Assets 606 625 Other Assets 462 473 Total Assets $12,140 $11,728 Liabilities and Shareowners’ Equity Current Liabilities: Short-Term Debt, Including Current Portion of Long-Term Debt $ 42 $ 28 Accounts Payable 477 514 Income Taxes Payable 188 234 Accrued Compensation and Benefits 178 295 Accrued Marketing Programs 343 494 Deferred Revenues 709 120 Grower Accruals 185 26 Liabilities of Discontinued Operations 2 2 Miscellaneous Short-Term Accruals 557 566 Total Current Liabilities 2,681 2,279 1,580 1,639 Long-Term Debt 555 600 Postretirement Liabilities 150 155 Long-Term Portion of Solutia-Related Reserve 513 530 Other Liabilities 6,661 6,525 Shareowners’ Equity Total Liabilities and Shareowners’ Equity $12,140 $11,728 20% 20% Debt to Capital Ratio: -more-
  • 8. -8- Monsanto Company Selected Financial Information (Dollars in millions) Unaudited Statements of Consolidated Cash Flows Three Months Ended Nov. 30, 2006 2005 Operating Activities: Net Income $ 90 $ 59 Adjustments to Reconcile Cash Provided by Operating Activities: Items That Did Not Require (Provide) Cash: Depreciation and Amortization Expense 128 133 Bad-Debt Expense 9 14 Stock-Based Compensation Expense 18 13 Excess Tax Benefits from Stock-Based Compensation (12) (10) Deferred Income Taxes (4) 38 Equity Affiliate Expense – Net 10 7 Other Items 3 (7) Changes in Assets and Liabilities That Provided (Required) Cash, Net o Acquisitions: Trade Receivables 251 215 Inventories (256) (221) Deferred Revenues 592 610 Accounts Payable and Other Accrued Liabilities (158) (127) PCB Litigation Settlement Proceeds 5 5 Solutia-Related Payments (6) (9) Other Items (70) 53 Net Cash Provided by Operating Activities 600 773 Cash Flows Provided (Required) by Investing Activities: Purchases of Short-Term Investments — (18) Maturities of Short-Term Investments 22 — Capital Expenditures (92) (56) Acquisitions of Businesses, Net of Cash Acquired — (53) Technology and Other Investments (10) (10) Other Investments and Property Disposal Proceeds 13 2 Net Cash Required by Investing Activities (67) (135) Cash Flows Provided (Required) by Financing Activities: Net Change in Financing With Less Than 90-Day Maturities (1) (122) Short-Term Debt Proceeds 2 4 Short-Term Debt Reductions (8) (6) Long-Term Debt Proceeds 3 3 Long-Term Debt Reductions (69) (26) Payments on Other Financing (2) (1) Treasury Stock Purchases (56) — Stock Option Exercises 17 27 Excess Tax Benefits From Stock-Based Compensation 12 10 Dividend Payments (54) (46) Net Cash Required by Financing Activities (156) (157) Effect of Exchange Rate Changes on Cash and Cash Equivalents 5 — Net Increase in Cash and Cash Equivalents 382 481 Cash and Cash Equivalents at Beginning of Period 1,460 525 Cash and Cash Equivalents at End of Period $1,842 $1,006 -more-
  • 9. -9- Monsanto Company Selected Financial Information (Dollars in millions) Unaudited 1. All earnings per share figures have been adjusted to reflect the company’s two-for-one stock split which was paid on July 28, 2006, in the form of a 100 percent stock dividend. 2. EBIT, Ongoing EPS and Free Cash Flow: The presentations of EBIT, ongoing EPS and free cash flow are not intended to replace net income (loss), cash flows, financial position or comprehensive income (loss), and they are not measures of financial performance as determined in accordance with generally accepted accounting principles (GAAP) in the United States. The following tables reconcile EBIT, ongoing EPS and free cash flow to the respective most directly comparable financial measure calculated in accordance with GAAP. Reconciliation of EBIT to Net Income (Loss): EBIT is defined as earnings (loss) before interest and taxes. Earnings (loss) is intended to mean net income (loss) as presented in the Statements of Consolidated Operations under GAAP. The following table reconciles EBIT to the most directly comparable financial measure, which is net income (loss). Three Months Ended Nov. 30, 2006 2005 EBIT – Seeds and Genomics Segment $1 $ 19 EBIT – Agricultural Productivity Segment 103 93 EBIT– Total 104 112 Interest Expense – Net 3 18 Income Tax Provision(A) 11 35 Net Income $ 90 $ 59 (A) Includes the income tax provision on minority interest income. Reconciliation of EPS to Ongoing EPS: Ongoing EPS is calculated excluding certain after-tax items which Monsanto does not consider part of ongoing operations. The reconciliation of EPS to ongoing EPS for the three months ended Nov. 30, 2006 and 2005, is included on page 1 of this release. Reconciliation of Free Cash Flow: Free cash flow represents the total of cash flows from operating activities and investing activities, as reflected in the Statements of Consolidated Cash Flows presented in this release. With respect to the fiscal year 2007 free cash flow target, Monsanto does not include any estimates or projections of Net Cash Provided (Required) by Financing Activities because in order to prepare any such estimate or projection, Monsanto would need to rely on market factors and conditions that are outside of its control. Fiscal Year Three Months Ended 2007 Nov. 30, Target 2006 2005 Net Cash Provided by Operating Activities $1,375 – $1,450 $ 600 $ 773 Net Cash Required by Investing Activities (500) (67) (135) Free Cash Flow $ 875 – $ 950 533 638 Net Cash Required by Financing Activities N/A (156) (157) Effect of Exchange Rate Changes on Cash and Cash Equivalents N/A 5 — Net Increase in Cash and Cash Equivalents N/A 382 481 Cash and Cash Equivalents at Beginning of Period N/A 525 1,460 Cash and Cash Equivalents at End of Period N/A $1,006 $1,842 -oOo-