
Recomendados
Mais conteúdo relacionado
Mais procurados
Destaque
Semelhante a first energy 4Q 06 Consolidated Report to the Financial_Community
Semelhante a first energy 4Q 06 Consolidated Report to the Financial_Community (20)
Mais de finance21
Mais de finance21 (20)
Último
Último (20)
first energy 4Q 06 Consolidated Report to the Financial_Community
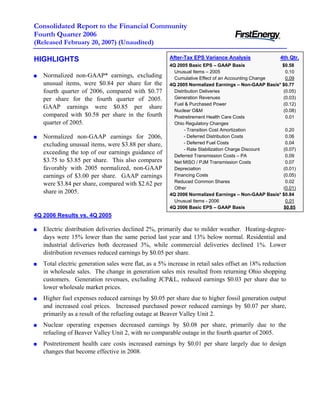
- 1. Consolidated Report to the Financial Community Fourth Quarter 2006 (Released February 20, 2007) (Unaudited) After-Tax EPS Variance Analysis 4th Qtr. HIGHLIGHTS 4Q 2005 Basic EPS – GAAP Basis $0.58 Unusual Items – 2005 0.10 Normalized non-GAAP* earnings, excluding Cumulative Effect of an Accounting Change 0.09 unusual items, were $0.84 per share for the 4Q 2005 Normalized Earnings – Non-GAAP Basis* $0.77 fourth quarter of 2006, compared with $0.77 Distribution Deliveries (0.05) Generation Revenues (0.03) per share for the fourth quarter of 2005. Fuel & Purchased Power (0.12) GAAP earnings were $0.85 per share Nuclear O&M (0.08) compared with $0.58 per share in the fourth Postretirement Health Care Costs 0.01 quarter of 2005. Ohio Regulatory Changes - Transition Cost Amortization 0.20 Normalized non-GAAP earnings for 2006, - Deferred Distribution Costs 0.06 - Deferred Fuel Costs 0.04 excluding unusual items, were $3.88 per share, - Rate Stabilization Charge Discount (0.07) exceeding the top of our earnings guidance of Deferred Transmission Costs – PA 0.09 $3.75 to $3.85 per share. This also compares Net MISO / PJM Transmission Costs 0.07 favorably with 2005 normalized, non-GAAP Depreciation (0.01) Financing Costs (0.05) earnings of $3.00 per share. GAAP earnings Reduced Common Shares 0.02 were $3.84 per share, compared with $2.62 per Other (0.01) share in 2005. 4Q 2006 Normalized Earnings – Non-GAAP Basis* $0.84 Unusual Items - 2006 0.01 4Q 2006 Basic EPS – GAAP Basis $0.85 4Q 2006 Results vs. 4Q 2005 Electric distribution deliveries declined 2%, primarily due to milder weather. Heating-degree- days were 15% lower than the same period last year and 13% below normal. Residential and industrial deliveries both decreased 3%, while commercial deliveries declined 1%. Lower distribution revenues reduced earnings by $0.05 per share. Total electric generation sales were flat, as a 5% increase in retail sales offset an 18% reduction in wholesale sales. The change in generation sales mix resulted from returning Ohio shopping customers. Generation revenues, excluding JCP&L, reduced earnings $0.03 per share due to lower wholesale market prices. Higher fuel expenses reduced earnings by $0.05 per share due to higher fossil generation output and increased coal prices. Increased purchased power reduced earnings by $0.07 per share, primarily as a result of the refueling outage at Beaver Valley Unit 2. Nuclear operating expenses decreased earnings by $0.08 per share, primarily due to the refueling of Beaver Valley Unit 2, with no comparable outage in the fourth quarter of 2005. Postretirement health care costs increased earnings by $0.01 per share largely due to design changes that become effective in 2008.
- 2. The impact of several elements of the Ohio rate plans that became effective in 2006 increased earnings by $0.23 per share. The major driver of this improvement was a $0.20 per share reduction in transition cost amortization. Other changes included the deferral of $0.06 per share of costs related to distribution reliability spending and the deferral of $0.04 per share of incremental fuel expense, partially offset by a $0.07 per share earnings reduction related to the Rate Stabilization Charge discount provided to shopping customers. The deferral of incremental transmission charges for Metropolitan Edison and Pennsylvania Electric increased earnings by $0.09 per share. In January 2007, the Pennsylvania Public Utility Commission authorized recovery of the 2006 deferred charges over a ten-year period and established a Transmission Service Charge Rider to begin collecting the incremental transmission charges on a going-forward basis. Net MISO/PJM transmission costs increased earnings by $0.07 per share, primarily due to lower MISO expenses and lower congestion costs in the PJM market. Total financing costs increased by $0.05 per share, primarily attributable to an $11 million pre- tax loss on reacquired debt, a $5 million after-tax charge related to the optional redemption of $80 million of subsidiaries' preferred stock, and a higher level of outstanding short-term borrowings related to funding our accelerated share repurchase program. The reduction in shares outstanding, resulting from the accelerated share repurchase of 10.6 million shares in August 2006, enhanced earnings per share by $0.02 compared with the fourth quarter of 2005. During the quarter, we recognized a net benefit of $0.01 per share from the gain on the sale of non-core assets, partially offset by the impairment of securities held in trust for future nuclear decommissioning activities. 2007 Earnings Guidance Normalized non-GAAP earnings guidance for 2007, excluding unusual items, is $4.05 to $4.25 per share. Our estimate for the quarterly pattern of our 2007 earnings guidance is: 1st Quarter: 20% 2nd Quarter: 25% 3rd Quarter: 32% 4th Quarter: 23% * The 2006 and 2007 GAAP to non-GAAP reconciliation statements can be found on pages 10 and 11 of this report and all GAAP to non-GAAP reconciliation statements are available on the Investor Information section of FirstEnergy Corp.'s website at www.firstenergycorp.com/ir. For additional information, please contact: Ronald E. Seeholzer Kurt E. Turosky Rey Y. Jimenez Vice President, Investor Relations Director, Investor Relations Principal, Investor Relations (330) 384-5783 (330) 384-5500 (330) 761-4239 Consolidated Report to the Financial Community – 4th Quarter 2006 2
- 3. FirstEnergy Corp. Consolidated Statements of Income (Unaudited) (In millions, except for per share amounts) Three Months Ended December 31, Twelve Months Ended December 31, 2006 2005 Change 2006 2005 Change Revenues (1) Electric sales $ 2,492 $ 2,514 $ (22) $ 10,671 $ 10,546 $ 125 (2) FE Facilities - 21 (21) 48 77 (29) (3) Other 188 186 2 782 735 47 (4) Total Revenues 2,680 2,721 (41) 11,501 11,358 143 Expenses (5) Fuel 283 269 14 1,212 1,118 94 (6) Purchased power 664 627 37 3,041 2,893 148 (7) Other operating expenses 735 790 (55) 2,924 3,028 (104) (8) FE Facilities - 20 (20) 41 75 (34) (9) Provision for depreciation 151 143 8 596 588 8 (10) Amortization of regulatory assets 197 299 (102) 861 1,281 (420) (11) Deferral of new regulatory assets (121) (100) (21) (500) (405) (95) (12) General taxes 167 172 (5) 720 713 7 (13) Total Expenses 2,076 2,220 (144) 8,895 9,291 (396) (14) Operating Income 604 501 103 2,606 2,067 539 Other Income (Expense) (15) Investment income 29 46 (17) 149 217 (68) (16) Interest expense (193) (172) (21) (721) (660) (61) (17) Capitalized interest 5 7 (2) 26 19 7 (18) Subsidiaries' preferred stock dividends (1) (3) 2 (7) (15) 8 (19) (160) (122) (38) (553) (439) (114) Total Other Income (Expense) (20) Income From Continuing Operations 444 379 65 2,053 1,628 425 Before Income Taxes (21) Income taxes 170 153 17 795 749 46 (22) Income From Continuing Operations 274 226 48 1,258 879 379 (23) Discontinued operations - (6) 6 (4) 12 (16) (24) Cumulative effect of a change in accounting principle - (30) 30 - (30) 30 (25) Net Income $ 274 $ 190 $ 84 $ 1,254 $ 861 $ 393 Basic Earnings Per Common Share: (26) Income from continuing operations $ 0.85 $ 0.69 $ 0.16 $ 3.85 $ 2.68 $ 1.17 (27) Discontinued operations - (0.02) 0.02 (0.01) 0.03 (0.04) (28) Cumulative effect of a change in accounting principle - (0.09) 0.09 - (0.09) 0.09 (29) Basic Earnings Per Common Share $ 0.85 $ 0.58 $ 0.27 $ 3.84 $ 2.62 $ 1.22 (30) Weighted Average Number of 318 328 (10) 324 328 (4) Basic Shares Outstanding Diluted Earnings Per Common Share: (31) Income from continuing operations $ 0.84 $ 0.69 $ 0.15 $ 3.82 $ 2.67 $ 1.15 (32) Discontinued operations - (0.02) 0.02 (0.01) 0.03 (0.04) (33) Cumulative effect of a change in accounting principle - (0.09) 0.09 - (0.09) 0.09 (34) Diluted Earnings Per Common Share $ 0.84 $ 0.58 $ 0.26 $ 3.81 $ 2.61 $ 1.20 (35) Weighted Average Number of 321 330 (9) 327 330 (3) Diluted Shares Outstanding ______________________________________________________________________________________________________ Consolidated Report to the Financial Community – 4th Quarter 2006 3
- 4. FirstEnergy Corp. Consolidated Income Segments (Unaudited) (In millions) Three Months Ended December 31, 2006 Power Supply Reconciling Regulated Management Services Adjustments (b) Services Other (a) Consolidated Revenues (1) Electric sales $ 878 $ 1,614 $ - $ - $ 2,492 (2) FE Facilities - - - - - (3) Other 145 52 13 (22) 188 (4) Internal revenues - - - - - (5) 1,023 1,666 13 (22) 2,680 Total Revenues Expenses (6) Fuel - 283 - - 283 (7) Purchased power - 664 - - 664 (8) Other operating expenses 283 451 - 1 735 (9) FE Facilities - - - - - (10) Provision for depreciation 96 47 1 7 151 (11) Amortization of regulatory assets 192 5 - - 197 (12) Deferral of new regulatory assets (53) (68) - - (121) (13) General taxes 123 44 (3) 3 167 (14) Total Expenses 641 1,426 (2) 11 2,076 (15) Operating Income 382 240 15 (33) 604 Other Income (Expense) (16) Investment income 66 - - (37) 29 (17) Interest expense (115) (59) (1) (18) (193) (18) Capitalized interest 2 3 - - 5 (19) Subsidiaries' preferred stock dividends (6) - - 5 (1) (20) (53) (56) (1) (50) (160) Total Other Income (Expense) (21) Income From Continuing Operations 329 184 14 (83) 444 Before Income Taxes (22) Income taxes 133 73 (3) (33) 170 (23) Income From Continuing Operations 196 111 17 (50) 274 (24) Discontinued operations - - - - - (25) Cumulative effect of a change in - - - - - accounting principle (26) Net Income $ 196 $ 111 $ 17 $ (50) $ 274 (a) Primarily consists of telecommunications services. (b) Reconciling adjustments to segment operating results from internal management reporting to consolidated external financial reporting primarily consists of interest expense related to holding company debt, corporate support services revenues and expenses, fuel marketing revenues which are reflected as reductions to expenses for internal management reporting purposes and elimination of intersegment transactions. ______________________________________________________________________________________________________ Consolidated Report to the Financial Community – 4th Quarter 2006 4
- 5. FirstEnergy Corp. Consolidated Income Segments (Unaudited) (In millions) Three Months Ended December 31, 2005 Power Supply Reconciling Regulated Management Services Adjustments (b) Services Other (a) Consolidated Revenues (1) Electric sales $ 1,073 $ 1,441 $ - $ - 2,514 (2) FE Facilities - - 21 - 21 (3) Other 128 39 14 5 186 (4) Internal revenues 33 - - (33) - (5) 1,234 1,480 35 (28) 2,721 Total Revenues Expenses (6) Fuel - 269 - - 269 (7) Purchased power - 627 - - 627 (8) Other operating expenses 257 510 12 11 790 (9) FE Facilities - - 20 - 20 (10) Provision for depreciation 118 19 - 6 143 (11) Amortization of regulatory assets 299 - - - 299 (12) Deferral of new regulatory assets (61) (39) - - (100) (13) General taxes 138 31 - 3 172 (14) Total Expenses 751 1,417 32 20 2,220 (15) Operating Income 483 63 3 (48) 501 Other Income (Expense) (16) Investment income 46 - - - 46 (17) Interest expense (107) (26) (2) (37) (172) (18) Capitalized interest 5 2 - - 7 (19) Subsidiaries' preferred stock dividends (3) - - - (3) (20) (59) (24) (2) (37) (122) Total Other Income (Expense) (21) Income From Continuing Operations 424 39 1 (85) 379 Before Income Taxes (22) Income taxes 170 16 (2) (31) 153 (23) Income From Continuing Operations 254 23 3 (54) 226 (24) Discontinued operations - - (6) - (6) (25) Cumulative effect of a change in (21) (9) - 0 (30) accounting principle (26) Net Income $ 233 $ 14 $ (3) $ (54) $ 190 (a) Other consists of telecommunications services and non-core businesses whose divestitures were completed in 2006 (FE Facilities and MYR). (b) Reconciling adjustments to segment operating results from internal management reporting to consolidated external financial reporting primarily consists of interest expense related to holding company debt, corporate support services revenues and expenses, fuel marketing revenues which are reflected as reductions to expenses for internal management reporting purposes and elimination of intersegment transactions. ______________________________________________________________________________________________________ Consolidated Report to the Financial Community – 4th Quarter 2006 5
- 6. FirstEnergy Corp. Consolidated Income Segments (Unaudited) (In millions) Three Months Ended December 31, 2006 vs. Three Months Ended December 31, 2005 Power Supply Reconciling Regulated Management Services Adjustments (b) Services Other (a) Consolidated Revenues (1) Electric sales $ (195) $ 173 $ - $ - $ (22) (2) FE Facilities - - (21) - (21) (3) Other 17 13 (1) (27) 2 (4) Internal revenues (33) - - 33 - (5) (211) 186 (22) 6 (41) Total Revenues Expenses (6) Fuel - 14 - - 14 (7) Purchased power - 37 - - 37 (8) Other operating expenses 26 (59) (12) (10) (55) (9) FE Facilities - - (20) - (20) (10) Provision for depreciation (22) 28 1 1 8 (11) Amortization of regulatory assets (107) 5 - - (102) (12) Deferral of new regulatory assets 8 (29) - - (21) (13) General taxes (15) 13 (3) - (5) (14) Total Expenses (110) 9 (34) (9) (144) (15) Operating Income (101) 177 12 15 103 Other Income (Expense) (16) Investment income 20 - - (37) (17) (17) Interest expense (8) (33) 1 19 (21) (18) Capitalized interest (3) 1 - - (2) (19) Subsidiaries' preferred stock dividends (3) - - 5 2 (20) 6 (32) 1 (13) (38) Total Other Income (Expense) (21) Income From Continuing Operations (95) 145 13 2 65 Before Income Taxes (22) Income taxes (37) 57 (1) (2) 17 (23) Income From Continuing Operations (58) 88 14 4 48 (24) Discontinued operations - - 6 - 6 (25) Cumulative effect of a change in 21 9 - (0) 30 accounting principle (26) Net Income $ (37) $ 97 $ 20 $ 4 $ 84 (a) Other consists of telecommunications services and non-core businesses whose divestitures were completed in 2006 (FE Facilities and MYR). (b) Reconciling adjustments to segment operating results from internal management reporting to consolidated external financial reporting primarily consists of interest expense related to holding company debt, corporate support services revenues and expenses, fuel marketing revenues which are reflected as reductions to expenses for internal management reporting purposes and elimination of intersegment transactions. ______________________________________________________________________________________________________ Consolidated Report to the Financial Community – 4th Quarter 2006 6
- 7. FirstEnergy Corp. Financial Statements (Unaudited) (In millions) Condensed Consolidated Balance Sheet As of As of Dec. 31, Dec. 31, 2006 2005 Assets Current Assets: Cash and cash equivalents $ 90 $ 64 Receivables 1,267 1,498 Other 726 755 Total Current Assets 2,083 2,317 Property, Plant and Equipment 14,667 13,998 Investments 3,534 3,351 Deferred Charges and Other Assets 10,912 12,175 Total Assets $ 31,196 $ 31,841 Liabilities and Capitalization Current Liabilities: Currently payable long-term debt $ 1,867 $ 2,043 Short-term borrowings 1,108 731 Accounts payable 726 727 Other 1,554 1,952 Total Current Liabilities 5,255 5,453 Capitalization: Common stockholders' equity 8,977 9,188 Preferred stock - 184 Long-term debt and other long-term obligations 8,535 8,155 Total Capitalization 17,512 17,527 Noncurrent Liabilities 8,429 8,861 Total Liabilities and Capitalization $ 31,196 $ 31,841 Adjusted Capitalization (Including Off-Balance Sheet Items) - Rating Agency View As of December 31, 2006 % Total 2005 % Total Total common equity $ 8,977 42% $ 9,188 43% Preferred stock - 0% 184 1% Long-term debt* 9,973 47% 9,934 47% Short-term debt 1,108 5% 731 3% Off-balance sheet debt equivalents: Sale-leaseback net debt equivalents 1,231 6% 1,295 6% Total $ 21,289 100% $ 21,332 100% GENERAL INFORMATION Three Months Ended Dec.31, Twelve Months Ended Dec.31, 2006 2005 2006 2005 Debt and equity securities redemptions $ (1,629) $ (572) $ (3,329) $ (1,594) New long-term debt issues $ 1,504 $ 387 $ 2,739 $ 721 Short-term debt increase (decrease) $ (96) $ 484 $ 386 $ 561 Capital expenditures $ 325 $ 452 $ 1,315 $ 1,208 * Includes amounts due to be paid within one year and excludes JCP&L securitization debt of $429 million and $264 million in 2006 and 2005, respectively. ______________________________________________________________________________________________________ Consolidated Report to the Financial Community – 4th Quarter 2006 7
- 8. FirstEnergy Corp. Financial Statements (Unaudited) (In millions, except per share amounts) Condensed Consolidated Statements of Cash Flows Three Months Ended Dec. 31, Twelve Months Ended Dec. 31, 2006 2005 2006 2005 Cash flows from operating activities: Net income $ 274 $ 190 $ 1,254 $ 861 Adjustments to reconcile net income to net cash from operating activities: Depreciation, amortization, and deferral of regulatory assets 227 342 957 1,464 Deferred purchased power and other costs (122) (126) (445) (384) Deferred income taxes and investment tax credits 123 130 159 154 Deferred rents and lease market valuation liability (59) (33) (113) (104) Electric service prepayment programs (19) (10) (64) 208 Cash collateral, net 21 147 (77) 196 Pension trust contribution - (500) - (500) Change in working capital and other 251 164 268 325 Cash flows provided from operating activities 696 304 1,939 2,220 Cash flows provided from (used for) financing activities (360) 173 (804) (876) Cash flows used for investing activities (287) (553) (1,109) (1,333) Net increase (decrease) in cash and cash equivalents $ 49 $ (76) $ 26 $ 11 Three Months Ended December 31, Twelve Months Ended December 31, 2006 2005 Change 2006 2005 Change Ohio Regulatory Assets $ 1,857 $ 2,044 $ 1,924 $ 2,426 Beginning balance Deferral of shopping incentives - 44 $ (44) 3 225 $ (222) Interest on shopping incentives 10 13 (3) 42 47 (5) Deferral of MISO costs and interest 4 39 (35) 15 91 (76) Deferral of RCP distribution reliability costs 35 - 35 155 - 155 Deferral of RCP fuel costs 19 - 19 113 - 113 Deferral of other regulatory assets 7 1 6 15 10 5 $ 75 $ 97 $ (22) $ 343 $ 373 $ (30) Current period deferrals Ohio transition costs amortization $ (59) $ (194) $ 135 $ (270) $ (835) $ 565 Shopping incentives amortization (28) - (28) (121) - (121) MISO costs amortization (5) - (5) (20) - (20) Other 4 (23) 27 (12) (40) 28 $ (88) $ (217) $ 129 $ (423) $ (875) $ 452 Current period amortization $ 1,844 $ 1,924 $ 1,844 $ 1,924 Ending Balance Deferred PJM Costs - Pennsylvania Beginning balance $ 111 $ - $ - $ - Deferral of PJM transmission costs 46 - $ 46 157 - $ 157 $ 157 $ - $ 157 $ - Ending Balance Deferred Energy Costs - New Jersey Beginning balance $ 340 $ 508 $ 541 $ 446 Deferral (recovery) of energy costs 29 33 $ (4) (172) 95 $ (267) $ 369 $ 541 $ 369 $ 541 Ending Balance UNUSUAL ITEMS Three Months Ended December 31, Twelve Months Ended December 31, 2006 2005 Change 2006 2005 Change Gain on Non-Core Asset Sales of: Amounts included in discontinued operations (a)(b) $ - $ - $ - $ - $ 7 $ (7) All Other, net (c)(d) 11 - 11 12 9 3 Total Gain on Non-Core Asset Sales 11 - 11 12 16 (4) Trust securities impairment (c) (13) - (13) (13) - (13) Marbel property tax liability adjustment (l) 3 - 3 3 - 3 PPUC NUG cost reserve for prior year (e) - - - (10) - (10) FE Facilities sales/impairment (f)(g) - (2) 2 (13) (2) (11) MYR goodwill impairment (h)(i) - (9) 9 - (9) 9 Other non-core asset impairments (c) - (4) 4 - (4) 4 EPA settlement (c) - - - - (19) 19 Davis-Besse DOJ penalty and NRC fine (c) (i) - (28) 28 - (31) 31 JCP&L Rate Settlement (j) - - - - 28 (28) JCP&L Arbitration Decision (c) - - - - (16) 16 1 (43) 44 (21) (37) 16 Total-Pretax Items Ohio Tax Write-off and New Jersey audit adjustment (k) - 7 (7) - (63) 63 EPS Effect $ 0.01 $ (0.10) $ 0.11 $ (0.04) $ (0.29) $ 0.25 (a) Primarily FE Facilities subs and retail gas operations (e) Included in quot;Purchased power expensesquot; (i) Non-tax deductible (b) Before income tax benefit of $12.2 million (f) Included in quot;FE Facilities expensesquot; (j) Included in quot;Deferral of New Regulatory Assetsquot; (c) Included in quot;Investment incomequot; (g) Before 3rd qtr 2006 tax benefit of $1.6 million (k) Included in quot;Income taxesquot; (d) Before 2006 tax benefits (1Qtr-$2.5 M and 4Qtr-$1.6 M) (h) Included in quot;Discontinued operationsquot; (l) Included in quot;General taxesquot; ______________________________________________________________________________________________________ Consolidated Report to the Financial Community – 4th Quarter 2006 8
- 9. FirstEnergy Corp. Statistical Summary (Unaudited) ELECTRIC SALES STATISTICS Three Months Ended December 31, Twelve Months Ended December 31, (in millions of kWhs) 2006 2005 Change 2006 2005 Change Electric Generation Sales Retail - Regulated 23,247 21,679 7.2% 96,125 86,856 10.7% Retail - Competitive 2,833 3,204 -11.6% 11,734 14,192 -17.3% Total Retail 26,080 24,883 4.8% 107,859 101,048 6.7% Wholesale 5,804 7,036 -17.5% 23,083 28,521 -19.1% Total Electric Generation Sales 31,884 31,919 -0.1% 130,942 129,569 1.1% Electric Distribution Deliveries Ohio - Residential 4,095 4,237 -3.4% 16,762 17,479 -4.1% - Commercial 3,521 3,651 -3.6% 14,667 15,127 -3.0% - Industrial 5,651 5,794 -2.5% 23,323 23,544 -0.9% - Other 93 94 -1.1% 374 383 -2.3% Total Ohio 13,360 13,776 -3.0% 55,126 56,533 -2.5% Pennsylvania - Residential 2,834 2,864 -1.0% 11,278 11,520 -2.1% - Commercial 2,643 2,631 0.5% 10,825 10,867 -0.4% - Industrial 2,537 2,559 -0.9% 10,382 10,441 -0.6% - Other 21 21 0.0% 82 83 -1.2% Total Pennsylvania 8,035 8,075 -0.5% 32,568 32,911 -1.0% New Jersey - Residential 2,101 2,225 -5.6% 9,548 10,107 -5.5% - Commercial 2,247 2,236 0.5% 9,450 9,432 0.2% - Industrial 689 758 -9.1% 2,831 3,074 -7.9% - Other 21 21 2.1% 86 87 -0.9% Total New Jersey 5,058 5,240 -3.5% 21,915 22,700 -3.5% Total Residential 9,030 9,326 -3.2% 37,587 39,106 -3.9% Total Commercial 8,411 8,518 -1.3% 34,943 35,426 -1.4% Total Industrial 8,877 9,112 -2.6% 36,537 37,060 -1.4% Total Other 136 136 0.0% 542 553 -2.0% Total Distribution Deliveries 26,454 27,092 -2.4% 109,609 112,145 -2.3% Electric Sales Shopped Ohio - Residential 519 1,482 -65.0% 2,289 7,457 -69.3% - Commercial 878 1,595 -45.0% 3,787 7,228 -47.6% - Industrial 673 1,149 -41.4% 2,874 4,865 -40.9% Total Ohio 2,070 4,226 -51.0% 8,950 19,550 -54.2% Pennsylvania - Residential - 5 -100.0% - 21 -100.0% - Commercial 2 7 -71.4% 4 72 -94.4% - Industrial 132 175 -24.6% 501 1,338 -62.6% Total Pennsylvania 134 187 -28.3% 505 1,431 -64.7% New Jersey - Residential - 1 -100.0% - 4 -100.0% - Commercial 478 427 11.9% 1,926 1,985 -3.0% - Industrial 525 572 -8.2% 2,103 2,319 -9.3% Total New Jersey 1,003 1,000 0.3% 4,029 4,308 -6.5% Total Electric Sales Shopped 3,207 5,413 -40.8% 13,484 25,289 -46.7% Three Months Ended Twelve Months Ended Operating Statistics December 31, December 31, 2006 2005 2006 2005 Capacity Factors: Fossil - Baseload 83% 78% 89% 87% Fossil - Load Following 69% 70% 69% 67% Peaking 0% 2% 1% 3% Nuclear 85% 100% 87% 87% Generation Output: Fossil - Baseload 41% 37% 42% 41% Fossil - Load Following 23% 22% 22% 22% Peaking 0% 0% 0% 1% Nuclear 36% 41% 36% 36% Three Months Ended December 31, Twelve Months Ended December 31, WEATHER 2006 2005 Normal 2006 2005 Normal Composite Heating-Degree-Days 1,715 2,017 1,974 4,900 5,703 5,545 Composite Cooling-Degree-Days 5 22 12 892 1,140 920 ______________________________________________________________________________________________________ Consolidated Report to the Financial Community – 4th Quarter 2006 9
- 10. FirstEnergy Corp. 2006 EPS and Cash Flow (Unaudited) 2006 Earnings Per Share (EPS) (Reconciliation of GAAP to Non-GAAP) Three Months Twelve Months Ended Dec. 31 Ended Dec. 31 Basic EPS (GAAP basis) $0.85 $3.84 Excluding Unusual Items: Non-Core Asset Sales/Impairments (0.03) - Trust securities impairment 0.02 0.02 PPUC NUG cost reserve for prior year - 0.02 Basic EPS (Non-GAAP basis) $0.84 $3.88 Reconciliation of 2006 Cash from Operating Activities (GAAP) to Free Cash Flow (Non-GAAP) and Cash Generation (Non-GAAP) (in millions) Net Cash from Operating Activities: Net Income $ 1,254 Adjustments: Depreciation 596 Amortization of regulatory assets 861 Deferral of new regulatory assets (500) Deferred purchased power costs (445) Deferred income taxes and ITC, net 159 Deferred rents and lease market valuation liability (113) BGS collateral 60 Other collateral (137) Other, including changes in working capital 204 Net Cash from Operating Activities (GAAP) $ 1,939 Other Items: Capital expenditures (1,153) Nuclear fuel fabrication (162) Common stock dividends (586) Other, net 12 Free Cash Flow (Non-GAAP) $ 50 Proceeds from asset sales 139 JCP&L Securitization 180 Cash Generation (Non-GAAP)* $ 369 * 2006 cash generation was $506 million, excluding non-BGS collateral outflow of $137 million that was not included in 2006 cash generation guidance. ______________________________________________________________________________________________________ Consolidated Report to the Financial Community – 4th Quarter 2006 10
- 11. FirstEnergy Corp. 2007 EPS Guidance (Unaudited) Non-GAAP 2007 Basic Earnings Per Share Guidance (Reconciliation of GAAP to Non-GAAP) 2007 EPS $4.10 - $4.30 Basic EPS (GAAP basis) Excluding Unusual Item: Benefit from New Regulatory Asset Authorized by PPUC (0.05) $4.05 - $4.25 Basic EPS (Non-GAAP basis) ______________________________________________________________________________________________________ Consolidated Report to the Financial Community – 4th Quarter 2006 11
- 12. RECENT DEVELOPMENTS Share Repurchase Program On January 30, 2007, FirstEnergy's Board of Directors authorized a new share repurchase program for up to 16 million shares, or 5% of outstanding common stock. At management’s discretion, shares may be acquired on the open market or through privately negotiated transactions, subject to market conditions and other factors. The Board’s authorization of the repurchase program does not require the company to purchase any additional shares and the program may be terminated at any time. The new program supersedes the prior repurchase program approved in June 2006. When combined with the approximately 10.6 million shares repurchased in August 2006 under the prior program, this new program provides FirstEnergy the opportunity to repurchase approximately 8% of its total shares outstanding as of July 2006. Common Stock Dividend Increase On December 19, 2006, FirstEnergy’s Board of Directors declared a quarterly dividend of $0.50 per share on outstanding common stock, an 11% increase, to be payable March 1, 2007. The new indicated annual dividend will be $2.00 per share. This action brings FirstEnergy’s total dividend increase over the past 2 years to 33%, and is consistent with our policy, which targets sustainable annual dividend growth and a payout that is appropriate for our level of earnings. Record Generation Output FirstEnergy set a new annual generation output record of 82.0 million megawatt-hours, which represented a 2.2% increase over the prior record established in 2005. The increase in generation output was primarily driven by the performance of FirstEnergy’s fossil units, which set a new annual output record of 53.0 million megawatt-hours. Power Uprates Beaver Valley Unit 2 and Bruce Mansfield Unit 2 experienced power uprates of 10 MW and 50 MW, respectively, during the fourth quarter of 2006 after returning to service following outages for refueling or other maintenance. These uprates were achieved in support of FirstEnergy’s operating strategy to maximize the full potential of its existing generation assets. This brings the total amount of generating capacity added through power uprates during 2006 to 99 MW. Voluntary Pension Plan Contribution On January 2, 2007, following the enactment of the Pension Protection Act of 2006, FirstEnergy made a voluntary $300 million contribution to its pension plan. The net after-tax cash outlay was approximately $193 million. This funding is expected to be accretive to annual earnings by approximately $0.05 per share beginning in 2007, and increases the plan’s Projected Benefit Obligation funded status to approximately 105%. Since 2004, the company has made voluntary contributions totaling $1.3 billion. Transfer of Pollution Control Revenue Bonds In December 2006, FirstEnergy transferred approximately $878 million of pollution control revenue bonds (PCRB) from Ohio Edison (OE), The Cleveland Electric Illuminating Company (CEI), The Toledo Edison Company (TE), and Pennsylvania Power Company (PP) to FirstEnergy Generation Corp. and FirstEnergy Nuclear Generation Corp. This transaction brings the total amount of debt transferred from the utilities to the generating companies to approximately $1.4 billion, with approximately $700 million remaining to be transferred. These PCRB transfers support the intra-system generation asset transfer that was completed in 2005, where the fossil and nuclear generating assets, excluding those that are subject to sale and leaseback arrangements with non-affiliates, were transferred from the utilities to the generation companies FirstEnergy Corp. Senior Note Redemption On November 15, 2006, FirstEnergy paid at maturity the remaining $600 million of its $1.0 billion, 5.5% Senior Notes, Series A. This retirement was primarily funded with short-term debt and the proceeds of share repurchases by subsidiaries TE and CEI enabled by their new Senior Note issuances. The initial $400 million of principal was redeemed via a make-whole call provision in July 2006. Consolidated Report to the Financial Community – 4th Quarter 2006 12
- 13. Rating Agency Update On February 2, 2007, Fitch Ratings upgraded the Issuer Default Rating of FirstEnergy and its subsidiaries Jersey Central Power & Light (JCP&L), CEI, and TE. At the same time, Fitch affirmed the ratings of OE and its subsidiary PP. The rating outlook is positive for CEI and TE, and stable for FirstEnergy and the other rated subsidiaries. Fitch indicated that the rating changes reflect the improved operating performance of the generating fleet, balance sheet de-leveraging, and relatively constructive regulatory environments. Sale and Leaseback of Bruce Mansfield Unit 1 On January 31, 2007, FirstEnergy announced its intention to pursue a sale and leaseback transaction for its owned 776 MW portion of Bruce Mansfield Unit 1. If consummated as currently contemplated, FirstEnergy expects the after-tax proceeds of this transaction to be approximately $1.2 billion, which are anticipated to be used to fund the recently authorized share repurchase program and the repayment of short-term debt, including amounts incurred in connection with the recent pension contribution. The Company is currently targeting a close in the second quarter of 2007. JCP&L Non-Utility Generation Clause (NGC) Settlement On December 6, 2006, the New Jersey Board of Public Utilities approved a stipulation of settlement in an NGC rate proceeding allowing JCP&L to recover $165 million of deferred costs over an 18-month period. The costs were incurred by JCP&L during the period August 1, 2003, through December 31, 2005 to meet a portion of customers’ generation needs with mandated non-utility generation (NUG) supply contracts. The approved stipulation increases JCP&L’s cash flow, but is earnings neutral. Met-Ed and Penelec Rate Transition Plan Update On January 11, 2007, the PPUC issued its order in the Metropolitan Edison (Met-Ed) and Pennsylvania Electric Company (Penelec) Rate Transition Plan cases, approving overall rate increases for Met-Ed of 5% ($59 million) and Penelec of 4.5% ($50 million). As a result of the failure to obtain adequate rate relief, Met-Ed recorded a goodwill impairment charge of $358 million in the fourth quarter of 2006. The goodwill at Met-Ed resulted from the November 2001 merger between FirstEnergy and GPU, Inc., Met-Ed's former parent company. No adjustment to the consolidated goodwill of Met-Ed's parent, FirstEnergy, will be made since the fair value of its regulated segment (which represents FirstEnergy's reporting unit to evaluate goodwill) continues to exceed the carrying value of its investment in the segment. Several parties to the proceeding, including Met-Ed and Penelec, filed Petitions for Reconsideration of the Order with the Pennsylvania Public Utility Commission (PPUC). Parties have until 30 days after the PPUC rules on the Petitions to file appeals with the Commonwealth Court. 2007 Non-GAAP Earnings Guidance On January 31, 2007, FirstEnergy issued 2007 non-GAAP earnings guidance of $4.05 to $4.25 per share. On a GAAP basis, 2007 earnings are expected to be $4.10 to $4.30 per share, which includes a $0.05 per share benefit for new regulatory assets authorized by the PPUC in January 2007 that apply to prior years. Consolidated Report to the Financial Community – 4th Quarter 2006 13
- 14. Forward-looking Statements. This Consolidated Report to the Financial Community includes forward-looking statements based on information currently available to management. Such statements are subject to certain risks and uncertainties. These statements typically contain, but are not limited to, the terms “anticipate,” “potential,” “expect,” “believe,” “estimate” and similar words. Actual results may differ materially due to the speed and nature of increased competition and deregulation in the electric utility industry, economic or weather conditions affecting future sales and margins, changes in markets for energy services, changing energy and commodity market prices, replacement power costs being higher than anticipated or inadequately hedged, the continued ability of our regulated utilities to collect transition and other charges or to recover increased transmission costs, maintenance costs being higher than anticipated, legislative and regulatory changes (including revised environmental requirements), and the legal and regulatory changes resulting from the implementation of the Energy Policy Act of 2005 (including, but not limited to, the repeal of the Public Utility Holding Company Act of 1935), the uncertainty of the timing and amounts of the capital expenditures needed to, among other things, implement the Air Quality Compliance Plan (including that such amounts could be higher than anticipated) or levels of emission reductions related to the Consent Decree resolving the New Source Review litigation, adverse regulatory or legal decisions and outcomes (including, but not limited to, the revocation of necessary licenses or operating permits, fines or other enforcement actions and remedies) of governmental investigations and oversight, including by the Securities and Exchange Commission, the Nuclear Regulatory Commission and the various state public utility commissions as disclosed in our Securities and Exchange Commission filings, generally, and heightened scrutiny at the Perry Nuclear Power Plant in particular, the timing and outcome of various proceedings before the Public Utilities Commission of Ohio (PUCO) (including, but not limited to, the successful resolution of the issues remanded to the PUCO by the Ohio Supreme Court regarding the Rate Stabilization Plan) and the PPUC, including the transition rate plan filings for Met-Ed and Penelec, the continuing availability and operation of generating units, the ability of generating units to continue to operate at, or near full capacity, the inability to accomplish or realize anticipated benefits from strategic goals (including employee workforce initiatives), the anticipated benefits from voluntary pension plan contributions, the ability to improve electric commodity margins and to experience growth in the distribution business, the ability to access the public securities and other capital markets and the cost of such capital, the outcome, cost and other effects of present and potential legal and administrative proceedings and claims related to the August 14, 2003 regional power outage, the successful structuring and completion of a potential sale and leaseback transaction for Bruce Mansfield Unit 1 currently under consideration by management, the successful implementation of the newly- approved share repurchase program announced on January 31, 2007, the risks and other factors discussed from time to time in our Securities and Exchange Commission filings, including our annual report on Form 10-K for the year ended December 31, 2005, and other similar factors. Dividends declared from time to time during any annual period may in aggregate vary from the indicated amounts due to circumstances considered by the Board at the time of the actual declarations. We expressly disclaim any current intention to update any forward-looking statements contained herein as a result of new information, future events, or otherwise. Consolidated Report to the Financial Community – 4th Quarter 2006 14