
Recomendados
Recomendados
Mais conteúdo relacionado
Mais procurados
Mais procurados (14)
Destaque
Destaque (20)
Semelhante a marriott international Second Quarter 2007
Semelhante a marriott international Second Quarter 2007 (20)
Mais de finance20
Mais de finance20 (20)
Último
Último (20)
marriott international Second Quarter 2007
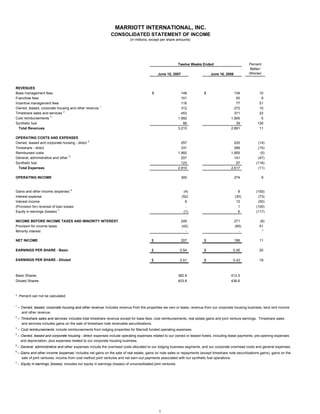
- 1. MARRIOTT INTERNATIONAL, INC. CONSOLIDATED STATEMENT OF INCOME (in millions, except per share amounts) Percent Twelve Weeks Ended Better/ (Worse) June 15, 2007 June 16, 2006 REVENUES Base management fees $ 148 $ 134 10 Franchise fees 101 93 9 Incentive management fees 116 77 51 1 Owned, leased, corporate housing and other revenue 312 272 15 Timeshare sales and services 2 453 371 22 Cost reimbursements 3 1,992 1,905 5 Synthetic fuel 88 39 126 Total Revenues 3,210 2,891 11 OPERATING COSTS AND EXPENSES 4 Owned, leased and corporate housing - direct 257 225 (14) Timeshare - direct 331 289 (15) Reimbursed costs 1,992 1,905 (5) 5 General, administrative and other 207 141 (47) Synthetic fuel 123 57 (116) Total Expenses 2,910 2,617 (11) OPERATING INCOME 300 274 9 6 Gains and other income (expense) (4) 8 (150) Interest expense (52) (30) (73) Interest income 6 12 (50) (Provision for) reversal of loan losses - 1 (100) 7 Equity in earnings (losses) (1) 6 (117) INCOME BEFORE INCOME TAXES AND MINORITY INTEREST 249 271 (8) Provision for income taxes (42) (85) 51 Minority interest - - * NET INCOME $ 207 $ 186 11 EARNINGS PER SHARE - Basic $ 0.54 $ 0.45 20 EARNINGS PER SHARE - Diluted $ 0.51 $ 0.43 19 Basic Shares 382.9 412.5 Diluted Shares 403.8 436.6 * Percent can not be calculated. 1 – Owned, leased, corporate housing and other revenue includes revenue from the properties we own or lease, revenue from our corporate housing business, land rent income and other revenue. 2 – Timeshare sales and services includes total timeshare revenue except for base fees, cost reimbursements, real estate gains and joint venture earnings. Timeshare sales and services includes gains on the sale of timeshare note receivable securitizations. 3 – Cost reimbursements include reimbursements from lodging properties for Marriott funded operating expenses. 4 – Owned, leased and corporate housing - direct expenses include operating expenses related to our owned or leased hotels, including lease payments, pre-opening expenses and depreciation, plus expenses related to our corporate housing business. 5 – General, administrative and other expenses include the overhead costs allocated to our lodging business segments, and our corporate overhead costs and general expenses. 6 – Gains and other income (expense) includes net gains on the sale of real estate, gains on note sales or repayments (except timeshare note securitizations gains), gains on the sale of joint ventures, income from cost method joint ventures and net earn-out payments associated with our synthetic fuel operations. 7 Equity in earnings (losses) includes our equity in earnings (losses) of unconsolidated joint ventures. – 1
- 2. MARRIOTT INTERNATIONAL, INC. CONSOLIDATED STATEMENT OF INCOME (in millions, except per share amounts) Twenty-Four Weeks Ended Percent Better/ June 15, 2007 June 16, 2006 (Worse) REVENUES Base management fees $ 282 $ 261 8 Franchise fees 192 175 10 Incentive management fees 187 136 38 Owned, leased, corporate housing and other revenue 1 562 526 7 Timeshare sales and services 2 822 677 21 Cost reimbursements 3 3,913 3,725 5 Synthetic fuel 156 96 63 Total Revenues 6,114 5,596 9 OPERATING COSTS AND EXPENSES Owned, leased and corporate housing - direct 4 476 433 (10) Timeshare - direct 643 529 (22) Reimbursed costs 3,913 3,725 (5) General, administrative and other 5 354 291 (22) Synthetic fuel 227 141 (61) Total Expenses 5,613 5,119 (10) OPERATING INCOME 501 477 5 Gains and other income (expense) 6 19 42 (55) Interest expense (85) (57) (49) Interest income 9 23 (61) (Provision for) reversal of loan losses - 3 (100) Equity in earnings (losses) 7 1 3 (67) INCOME FROM CONTINUING OPERATIONS BEFORE INCOME TAXES AND MINORITY INTEREST 445 491 (9) Provision for income taxes (56) (141) 60 Minority interest - 6 (100) INCOME FROM CONTINUING OPERATIONS 389 356 9 Cumulative effect of change in accounting principle, net of tax 8 - (109) 100 NET INCOME $ 389 $ 247 57 EARNINGS PER SHARE - Basic Earnings from continuing operations $ 1.01 $ 0.86 17 Losses from cumulative effect of change in accounting principle - (0.26) 100 Earnings per share $ 1.01 $ 0.60 68 EARNINGS PER SHARE - Diluted Earnings from continuing operations $ 0.95 $ 0.81 17 Losses from cumulative effect of change in accounting principle - (0.25) 100 Earnings per share $ 0.95 $ 0.56 70 Basic Shares 385.5 412.1 Diluted Shares 407.9 438.9 1 – Owned, leased, corporate housing and other revenue includes revenue from the properties we own or lease, revenue from our corporate housing business, land rent income and other revenue. 2 – Timeshare sales and services includes total timeshare revenue except for base fees, cost reimbursements, real estate gains and joint venture earnings. Timeshare sales and services includes gains on the sale of timeshare note receivable securitizations. 3 – Cost reimbursements include reimbursements from lodging properties for Marriott funded operating expenses. 4 – Owned, leased and corporate housing - direct expenses include operating expenses related to our owned or leased hotels, including lease payments, pre-opening expenses and depreciation, plus expenses related to our corporate housing business. 5 – General, administrative and other expenses include the overhead costs allocated to our lodging business segments and our corporate overhead costs and general expenses. 6 – Gains and other income (expense) includes gains and losses on the sale of real estate, gains on note sales or repayments (except timeshare note securitizations gains), gains and losses on the sale of joint ventures, income from cost method joint ventures and net earn-out payments associated with our synthetic fuel operations. 7 Equity in earnings (losses) includes our equity in earnings (losses) of unconsolidated equity method joint ventures. – 8 – Cumulative effect of change in accounting principle, net of tax is associated with the adoption, in the 2006 first quarter, of Statement of Position 04-2, quot;Accounting for Real Estate Time-sharing Transactionsquot; which was issued by the American Institute of Certified Public Accountants. 2
- 3. Marriott International, Inc. Business Segments ($ in millions) Twelve Weeks Ended Percent Better/ June 15, 2007 June 16, 2006 (Worse) REVENUES North American Full-Service $ 1,282 $ 1,267 1 North American Limited-Service 538 490 10 International 382 326 17 Luxury 370 329 12 Timeshare 532 427 25 Total lodging 1 3,104 2,839 9 Synthetic Fuel 88 39 126 Other unallocated corporate 18 13 38 Total $ 3,210 $ 2,891 11 NET INCOME North American Full-Service $ 132 $ 105 26 North American Limited-Service 131 106 24 International 59 62 (5) Luxury 18 16 13 Timeshare 107 68 57 Total lodging financial results 1 447 357 25 Synthetic Fuel (after-tax) 32 4 700 Other unallocated corporate (101) (54) (87) Interest income, provision for loan losses and interest expense (excluding Synthetic Fuel) (43) (19) (126) Income taxes (excluding Synthetic Fuel) (128) (102) (25) Total $ 207 $ 186 11 1 We consider lodging revenues and lodging financial results to be meaningful indicators of our performance because they measure our growth in profitability as a lodging company and enable investors to compare the sales and results of our lodging operations to those of other lodging companies. 3
- 4. Marriott International, Inc. Business Segments ($ in millions) Twenty-Four Weeks Ended Percent Better/ June 15, 2007 June 16, 2006 (Worse) REVENUES North American Full-Service $ 2,526 $ 2,486 2 North American Limited-Service 1,001 942 6 International 713 601 19 Luxury 709 660 7 Timeshare 975 783 25 Total lodging 1 5,924 5,472 8 Synthetic Fuel 156 96 63 Other unallocated corporate 34 28 21 Total $ 6,114 $ 5,596 9 INCOME FROM CONTINUING OPERATIONS North American Full-Service $ 246 $ 242 2 North American Limited-Service 218 178 22 International 109 105 4 Luxury 29 34 (15) Timeshare 151 119 27 Total lodging financial results 1 753 678 11 Synthetic Fuel (after-tax) 50 7 614 Other unallocated corporate (133) (109) (22) Interest income, provision for loan losses and interest expense (excluding Synthetic Fuel) (67) (33) (103) Income taxes (excluding Synthetic Fuel) (214) (187) (14) Total $ 389 $ 356 9 1 We consider lodging revenues and lodging financial results to be meaningful indicators of our performance because they measure our growth in profitability as a lodging company and enable investors to compare the sales and results of our lodging operations to those of other lodging companies. 4
- 5. MARRIOTT INTERNATIONAL, INC. Total Lodging Products 1 Number of Properties Number of Rooms/Suites Brand June 15, 2007 June 16, 2006 vs. June 16, 2006 June 15, 2007 June 16, 2006 vs. June 16, 2006 Domestic Full-Service Marriott Hotels & Resorts 341 340 1 135,800 135,463 337 Renaissance Hotels & Resorts 69 67 2 25,369 25,571 (202) Domestic Limited-Service Courtyard 668 634 34 93,328 89,078 4,250 Fairfield Inn 513 516 (3) 45,592 46,746 (1,154) SpringHill Suites 162 144 18 18,898 16,829 2,069 Residence Inn 508 483 25 60,462 57,810 2,652 TownePlace Suites 128 123 5 12,857 12,389 468 International Marriott Hotels & Resorts 180 177 3 51,967 50,796 1,171 Renaissance Hotels & Resorts 72 69 3 23,423 22,617 806 Courtyard 72 77 (5) 13,620 13,324 296 Fairfield Inn 7 5 2 756 559 197 SpringHill Suites 1 1 - 124 124 - Residence Inn 18 17 1 2,563 2,240 323 Marriott Executive Apartments 18 17 1 3,005 2,804 201 Ramada 2 2 - 332 332 - Luxury The Ritz-Carlton - Domestic 34 35 (1) 11,343 11,616 (273) The Ritz-Carlton - International 29 25 4 8,487 7,766 721 Bulgari Hotels & Resorts 2 1 1 117 58 59 The Ritz-Carlton Residential 15 - 15 1,425 - 1,425 Timeshare 2 Marriott Vacation Club 46 44 2 10,682 9,876 806 The Ritz-Carlton Club - Fractional 7 7 - 388 491 (103) The Ritz-Carlton Club - Residential 2 - 2 82 - 82 Grand Residences by Marriott - Fractional 2 3 (1) 248 313 (65) Horizons by Marriott Vacation Club 2 2 - 372 328 44 Sub Total Timeshare 59 56 3 11,772 11,008 764 Total 2,898 2,789 109 521,240 507,130 14,110 Number of Timeshare Interval, Fractional and Whole Ownership Resorts2 In Active Total3 Sales 100% Company-Developed Marriott Vacation Club 45 24 The Ritz-Carlton Club 5 3 Grand Residences by Marriott 2 2 Horizons by Marriott Vacation Club 2 2 Joint Ventures Marriott Vacation Club 1 1 The Ritz-Carlton Club 4 4 Total 59 36 1 Total Lodging Products excludes the 2,054 and 2,005 corporate housing rental units as of June 15, 2007 and June 16, 2006, respectively. 2 Includes products in active sales which may not be ready for occupancy. 3 Includes resorts that are in active sales and those that are sold out. Residential properties are captured once they possess a certificate of occupancy. 5
- 6. Marriott International, Inc. Key Lodging Statistics 1 Comparable Company-Operated International Properties Three Months Ended May 31, 2007 and May 31, 2006 REVPAR Occupancy Average Daily Rate 2007 vs. 2006 2007 vs. 2006 2007 vs. 2006 Region $136.75 11.2% 78.4% 0.7% pts. $174.44 10.2% Caribbean & Latin America $129.68 9.0% 75.8% 1.1% pts. $171.08 7.3% Continental Europe $146.83 5.2% 76.7% 1.3% pts. $191.32 3.5% United Kingdom $110.31 16.5% 76.8% 3.5% pts. $143.60 11.2% Middle East & Africa Asia Pacific2 $117.31 8.6% 75.3% -1.8% pts. $155.79 11.1% Regional Composite3 $129.16 9.0% 76.5% 0.5% pts. $168.76 8.3% International Luxury4 $236.74 12.2% 76.0% 4.0% pts. $311.43 6.2% Total International5 $139.99 9.6% 76.5% 0.9% pts. $183.03 8.4% Worldwide6 $129.42 6.9% 76.5% 0.2% pts. $169.08 6.7% Comparable Systemwide International Properties 1 Three Months Ended May 31, 2007 and May 31, 2006 REVPAR Occupancy Average Daily Rate 2007 vs. 2006 2007 vs. 2006 2007 vs. 2006 Region $128.46 8.5% 77.3% 2.0% pts. $166.28 5.6% Caribbean & Latin America $125.61 8.3% 72.6% 0.2% pts. $173.05 8.1% Continental Europe $144.20 5.1% 76.2% 1.4% pts. $189.28 3.1% United Kingdom $106.87 16.5% 75.4% 3.5% pts. $141.75 11.0% Middle East & Africa Asia Pacific2 $116.04 8.9% 75.8% -0.6% pts. $153.08 9.7% Regional Composite3 $125.41 8.6% 75.3% 0.7% pts. $166.51 7.6% International Luxury4 $236.74 12.2% 76.0% 4.0% pts. $311.43 6.2% Total International5 $134.72 9.2% 75.4% 1.0% pts. $178.73 7.7% Worldwide6 $109.13 6.4% 76.0% 0.1% pts. $143.51 6.3% 1 International financial results are reported on a period basis, while International statistics are reported on a monthly basis. Statistics are in constant dollars for March through May. Excludes North America (except for Worldwide). 2 Does not include Hawaii. 3 Regional information includes the Marriott Hotels & Resorts, Renaissance Hotels & Resorts and Courtyard brands. Includes Hawaii. 4 International Luxury includes The Ritz-Carlton properties outside of North America and Bulgari Hotels & Resorts. 5 Includes Regional Composite, The Ritz-Carlton International and Bulgari Hotels & Resorts brands. 6 Includes international statistics for the three calendar months ended May 31, 2007 and May 31, 2006, and North American statistics for the twelve weeks ended June 15, 2007 and June 16, 2006. Includes the Marriott Hotels & Resorts, The Ritz-Carlton, Bulgari Hotels & Resorts, Renaissance Hotels & Resorts, Residence Inn, Courtyard, TownePlace Suites, Fairfield Inn and SpringHill Suites brands. 6
- 7. Marriott International, Inc. Key Lodging Statistics 1 Comparable Company-Operated International Properties Five Months Ended May 31, 2007 and May 31, 2006 REVPAR Occupancy Average Daily Rate 2007 vs. 2006 2007 vs. 2006 2007 vs. 2006 Region $138.10 11.4% 77.8% 1.0% pts. $177.56 10.0% Caribbean & Latin America $116.77 9.4% 70.7% 1.5% pts. $165.22 7.1% Continental Europe $141.45 5.6% 74.6% 1.7% pts. $189.69 3.1% United Kingdom $106.49 18.3% 74.1% 4.4% pts. $143.78 11.3% Middle East & Africa Asia Pacific2 $113.27 9.3% 74.0% -1.6% pts. $152.97 11.6% Regional Composite3 $123.17 9.4% 73.9% 0.7% pts. $166.61 8.3% International Luxury4 $222.55 12.0% 73.2% 4.0% pts. $303.90 6.0% Total International5 $133.17 9.9% 73.9% 1.1% pts. $180.30 8.3% Worldwide6 $120.81 6.7% 72.9% -0.2% pts. $165.67 7.0% Comparable Systemwide International Properties 1 Five Months Ended May 31, 2007 and May 31, 2006 REVPAR Occupancy Average Daily Rate 2007 vs. 2006 2007 vs. 2006 2007 vs. 2006 Region $127.55 11.7% 75.5% 2.2% pts. $168.89 8.4% Caribbean & Latin America $112.80 9.1% 67.6% 0.6% pts. $166.79 8.2% Continental Europe $138.99 5.5% 74.0% 1.9% pts. $187.93 2.9% United Kingdom $102.89 18.0% 72.4% 4.2% pts. $142.10 11.2% Middle East & Africa Asia Pacific2 $112.08 9.2% 74.3% -0.5% pts. $150.86 10.0% Regional Composite3 $119.06 9.4% 72.5% 0.9% pts. $164.26 8.1% International Luxury4 $222.55 12.0% 73.2% 4.0% pts. $303.90 6.0% Total International5 $127.67 9.8% 72.5% 1.1% pts. $175.98 8.1% Worldwide6 $102.12 6.2% 72.3% -0.5% pts. $141.15 6.9% 1 International financial results are reported on a period basis, while International statistics are reported on a monthly basis. Statistics are in constant dollars for January through May. Excludes North America (except for Worldwide). 2 Does not include Hawaii. 3 Regional information includes the Marriott Hotels & Resorts, Renaissance Hotels & Resorts and Courtyard brands. Includes Hawaii. 4 International Luxury includes The Ritz-Carlton properties outside of North America and Bulgari Hotels & Resorts. 5 Includes Regional Composite, The Ritz-Carlton International and Bulgari Hotels & Resorts brands. 6 Includes international statistics for the five calendar months ended May 31, 2007 and May 31, 2006, and North American statistics for the twenty-four weeks ended June 15, 2007 and June 16, 2006. Includes the Marriott Hotels & Resorts, The Ritz-Carlton, Bulgari Hotels & Resorts, Renaissance Hotels & Resorts, Residence Inn, Courtyard, TownePlace Suites, Fairfield Inn and SpringHill Suites brands. 7
- 8. Marriott International, Inc. Key Lodging Statistics Comparable Company-Operated North American Properties Twelve Weeks Ended June 15, 2007 and June 16, 2006 REVPAR Occupancy Average Daily Rate 2007 vs. 2006 2007 vs. 2006 2007 vs. 2006 Brand Marriott Hotels & Resorts $136.32 6.7% 76.6% 0.9% pts. $177.97 5.5% Renaissance Hotels & Resorts $134.78 3.2% 76.7% -1.1% pts. $175.72 4.7% Composite North American Full-Service1 $136.09 6.2% 76.6% 0.6% pts. $177.63 5.4% The Ritz-Carlton2 $269.10 7.1% 76.2% -0.1% pts. $352.95 7.3% Composite North American Full-Service & Luxury3 $150.27 6.4% 76.6% 0.5% pts. $196.24 5.7% Residence Inn $100.22 3.4% 80.9% -1.0% pts. $123.93 4.6% Courtyard $95.28 4.5% 74.3% -0.9% pts. $128.24 5.8% TownePlace Suites $66.67 7.6% 78.3% -1.2% pts. $85.20 9.2% SpringHill Suites $84.02 3.1% 77.6% -0.3% pts. $108.22 3.5% Composite North American Limited-Service4 $94.22 4.3% 76.6% -0.9% pts. $123.08 5.6% Composite - All 5 $124.88 5.6% 76.6% -0.1% pts. $163.11 5.9% Comparable Systemwide North American Properties Twelve Weeks Ended June 15, 2007 and June 16, 2006 REVPAR Occupancy Average Daily Rate 2007 vs. 2006 2007 vs. 2006 2007 vs. 2006 Brand Marriott Hotels & Resorts $119.79 6.1% 74.7% 1.4% pts. $160.33 4.2% Renaissance Hotels & Resorts $119.16 3.4% 74.7% -1.2% pts. $159.44 5.1% Composite North American Full-Service1 $119.69 5.7% 74.7% 1.0% pts. $160.20 4.4% The Ritz-Carlton2 $269.10 7.1% 76.2% -0.1% pts. $352.95 7.3% Composite North American Full-Service & Luxury3 $129.04 5.9% 74.8% 0.9% pts. $172.49 4.6% Residence Inn $98.69 4.7% 80.7% -1.1% pts. $122.25 6.1% Courtyard $94.88 5.3% 75.8% -0.6% pts. $125.15 6.2% Fairfield Inn $65.57 6.9% 74.7% -0.3% pts. $87.82 7.3% TownePlace Suites $66.28 4.3% 76.7% -2.9% pts. $86.38 8.2% SpringHill Suites $83.18 6.1% 77.7% -0.3% pts. $107.11 6.4% Composite North American Limited-Service4 $87.53 5.3% 77.1% -0.8% pts. $113.58 6.4% Composite - All 5 $103.64 5.6% 76.2% -0.1% pts. $136.03 5.8% 1 Includes the Marriott Hotels & Resorts and Renaissance Hotels & Resorts brands. 2 Statistics for The Ritz-Carlton are for March through May. 3 Includes the Marriott Hotels & Resorts, Renaissance Hotels & Resorts and The Ritz-Carlton brands. 4 Includes the Residence Inn, Courtyard, Fairfield Inn, TownePlace Suites and SpringHill Suites brands. 5 Includes the Marriott Hotels & Resorts, Renaissance Hotels & Resorts, The Ritz-Carlton, Residence Inn, Courtyard, Fairfield Inn, TownePlace Suites, and SpringHill Suites brands. 8
- 9. Marriott International, Inc. Key Lodging Statistics Comparable Company-Operated North American Properties Twenty-Four Weeks Ended June 15, 2007 and June 16, 2006 REVPAR Occupancy Average Daily Rate 2007 vs. 2006 2007 vs. 2006 2007 vs. 2006 Brand Marriott Hotels & Resorts $128.00 6.6% 72.5% 0.6% pts. $176.43 5.7% Renaissance Hotels & Resorts $125.40 3.7% 73.6% -1.2% pts. $170.42 5.3% 1 Composite North American Full-Service $127.61 6.2% 72.7% 0.4% pts. $175.53 5.6% 2 The Ritz-Carlton $259.70 7.5% 74.0% -0.5% pts. $350.86 8.2% 3 Composite North American Full-Service & Luxury $139.39 6.4% 72.8% 0.3% pts. $191.42 5.9% Residence Inn $95.46 2.4% 76.9% -2.3% pts. $124.07 5.4% Courtyard $90.12 4.2% 70.2% -1.5% pts. $128.47 6.5% TownePlace Suites $62.93 6.9% 73.5% -2.3% pts. $85.58 10.2% SpringHill Suites $77.95 3.2% 71.6% -1.4% pts. $108.83 5.2% 4 Composite North American Limited-Service $89.20 3.8% 72.3% -1.8% pts. $123.36 6.4% Composite - All 5 $116.42 5.5% 72.6% -0.6% pts. $160.38 6.4% Comparable Systemwide North American Properties Twenty-Four Weeks Ended June 15, 2007 and June 16, 2006 REVPAR Occupancy Average Daily Rate 2007 vs. 2006 2007 vs. 2006 2007 vs. 2006 Brand Marriott Hotels & Resorts $114.21 5.9% 71.0% 0.5% pts. $160.90 5.2% Renaissance Hotels & Resorts $112.74 3.8% 71.8% -1.3% pts. $157.04 5.7% 1 Composite North American Full-Service $114.00 5.6% 71.1% 0.2% pts. $160.32 5.2% 2 The Ritz-Carlton $259.70 7.5% 74.0% -0.5% pts. $350.86 8.2% 3 Composite North American Full-Service & Luxury $121.59 5.8% 71.3% 0.2% pts. $170.64 5.5% Residence Inn $94.42 4.4% 77.5% -1.8% pts. $121.84 6.8% Courtyard $89.25 5.1% 71.7% -1.1% pts. $124.52 6.7% Fairfield Inn $60.45 6.2% 69.6% -0.9% pts. $86.89 7.6% TownePlace Suites $63.32 4.6% 72.8% -3.4% pts. $86.95 9.4% SpringHill Suites $78.25 5.7% 73.3% -0.9% pts. $106.73 7.0% 4 Composite North American Limited-Service $82.57 5.1% 73.0% -1.3% pts. $113.15 7.0% Composite - All 5 $97.57 5.4% 72.3% -0.8% pts. $134.92 6.5% 1 Includes the Marriott Hotels & Resorts and Renaissance Hotels & Resorts brands. 2 Statistics for The Ritz-Carlton are for January through May. 3 Includes the Marriott Hotels & Resorts, Renaissance Hotels & Resorts and The Ritz-Carlton brands. 4 Includes the Residence Inn, Courtyard, Fairfield Inn, TownePlace Suites and SpringHill Suites brands 5 Includes the Marriott Hotels & Resorts, Renaissance Hotels & Resorts, The Ritz-Carlton, Residence Inn, Courtyard, Fairfield Inn, TownePlace Suites, and SpringHill Suites brands. 9
- 10. MARRIOTT INTERNATIONAL, INC. TIMESHARE SEGMENT ($ in millions) Segment Results Second Quarter Second Quarter Percent 2007 2006 Better / (Worse) Base fees revenue $ 10 $ 8 25 Timeshare sales and services revenue, net of direct expense 122 82 49 Joint venture equity income (loss) (1) 2 (150) General, administrative and other expense (24) (24) 0 Segment results $ 107 $ 68 57 Sales and Services Revenue Second Quarter Second Quarter Percent 2007 2006 Better / (Worse) Development $ 303 $ 238 27 Services 72 68 6 Financing 69 62 11 Other revenue 9 3 200 Sales and services revenue $ 453 $ 371 22 Contract Sales Second Quarter Second Quarter Percent 2007 2006 Better / (Worse) Company: Timeshare $ 289 $ 291 (1) Fractional 6 11 (45) Whole-Ownership - 1 (100) Total company 295 303 (3) Joint ventures: Timeshare 8 7 14 Fractional 21 18 17 Whole-Ownership 35 143 (76) Total joint ventures 64 168 (62) Total contract sales, including joint ventures $ 359 $ 471 (24) 10
- 11. MARRIOTT INTERNATIONAL, INC. TIMESHARE SEGMENT ($ in millions) Segment Results YTD YTD Percent 2007 2006 Better / (Worse) Base fees revenue $ 20 $ 16 25 Timeshare sales and services revenue, net of direct expense 179 148 21 Joint venture equity income (loss) (1) 1 (200) General, administrative and other expense (47) (46) (2) Segment results $ 151 $ 119 27 Sales and Services Revenue YTD YTD Percent 2007 2006 Better / (Worse) Development $ 567 $ 453 25 Services 148 137 8 Financing 92 81 14 Other revenue 15 6 150 Sales and services revenue $ 822 $ 677 21 Contract Sales YTD YTD Percent 2007 2006 Better / (Worse) Company: Timeshare $ 564 $ 579 (3) Fractional 15 19 (21) Whole-Ownership - 3 (100) Total company 579 601 (4) Joint ventures: Timeshare 16 13 23 Fractional 39 19 105 Whole-Ownership 51 148 (66) Total joint ventures 106 180 (41) Total contract sales, including joint ventures $ 685 $ 781 (12) 11
- 12. MARRIOTT INTERNATIONAL, INC. Non-GAAP Financial Measures In our press release and schedules, and related conference call, we report certain financial measures that are not prescribed or authorized by United States generally accepted accounting principles (“GAAP”). We discuss management’s reasons for reporting these non-GAAP measures below, and the tables on the following pages reconcile the most directly comparable GAAP measures to the non-GAAP measures (identified by a double asterisk on the following pages) that we refer to in our press release. Although management evaluates and presents these non-GAAP measures for the reasons described below, please be aware that these non-GAAP measures are not alternatives to revenue, operating income, income from continuing operations, net income, earnings per share or any other comparable operating measure prescribed by GAAP. In addition, these non-GAAP financial measures may be calculated and/or presented differently than measures with the same or similar names that are reported by other companies, and as a result, the non-GAAP measures we report may not be comparable to those reported by others. Synthetic Fuel. We do not consider the Synthetic Fuel segment to be related to our core business, which is lodging. In addition, management expects the Synthetic Fuel segment will no longer have a material impact on our business after the end of 2007, when the Internal Revenue Code provision which provides for synthetic fuel tax credits expires. Accordingly, our management evaluates non-GAAP measures which exclude the impact of our Synthetic Fuel segment because those measures allow for period-over-period comparisons of our on-going core lodging operations. In addition, these non-GAAP measures facilitate management’s comparison of our results with the results of other lodging companies. ESOP Settlement Charge. Management evaluates non-GAAP measures that exclude the charge associated with the settlement of issues raised during the IRS’ and Department of Labor’s examination of the employee stock ownership plan (“ESOP”) feature of our Employees’ Profit Sharing, Retirement and Savings Plan and Trust because these measures allow for period-over-period comparisons relative to our on-going operations before material charges. Additionally, these non-GAAP measures facilitate management’s comparison of our results relative to on- going operations before material charges with that of other lodging companies. The settlement resulted in an after tax charge of $54 million reflecting $35 million of excise taxes (impacting General, Administration, and Other Expenses), $13 million of interest expense on those excise taxes and $6 million of income tax expense primarily reflecting additional interest. Earnings Before Interest, Taxes, Depreciation and Amortization (EBITDA) and Adjusted EBITDA. Our management considers earnings before interest, taxes, depreciation and amortization to be an indicator of operating performance because it can be used to measure our ability to service debt, fund capital expenditures, and expand our business. For the reasons noted above in the quot;Synthetic Fuelquot; and quot;ESOPquot; captions, our management also evaluates Adjusted EBITDA which excludes the Synthetic Fuel segment and the second quarter 2007 $35 million charge for excise taxes associated with the ESOP settlement. 12
- 13. MARRIOTT INTERNATIONAL, INC. Non-GAAP Financial Measure Reconciliation Measures that Exclude Synthetic Fuel (in millions, except per share amounts) Percent Second Quarter 2007 Second Quarter 2006 Better/ (Worse) As Synthetic Fuel Excluding As Synthetic Fuel Excluding Excluding Reported Impact Synthetic Fuel** Reported Impact Synthetic Fuel** Synthetic Fuel Operating income (loss) $ 300 $ (35) $ 335 $ 274 $ (18) $ 292 15 Gains and other income (expense) (4) (16) 12 8 3 5 140 Interest income, provision for loan losses and interest expense (46) (3) (43) (17) 2 (19) (126) Equity in earnings (losses) (1) - (1) 6 - 6 (117) Income (losses) before income taxes and minority interest 249 (54) 303 271 (13) 284 7 Tax (provision) benefit (108) 20 (128) (96) 6 (102) (25) Tax credits 66 66 - 11 11 - - Total tax (provision) benefit (42) 86 (128) (85) 17 (102) (25) Minority interest - - - - - - * Net Income $ 207 $ 32 $ 175 $ 186 $ 4 $ 182 (4) Diluted shares 403.8 403.8 403.8 436.6 436.6 436.6 Earnings per share - diluted $ 0.51 $ 0.08 $ 0.43 $ 0.43 $ 0.01 $ 0.42 2 Tax rate 16.9% 42.2% 31.4% 35.9% Percentage not meaningful. * ** Denotes non-GAAP financial measures. 13
- 14. MARRIOTT INTERNATIONAL, INC. Non-GAAP Financial Measure Reconciliation Measures that Exclude Synthetic Fuel (in millions, except per share amounts) Percent Second Quarter YTD 2007 Second Quarter YTD 2006 Better/ (Worse) As Synthetic Fuel Excluding As Synthetic Fuel Excluding Excluding Reported Impact Synthetic Fuel** Reported Impact Synthetic Fuel** Synthetic Fuel Operating income (loss) $ 501 $ (71) $ 572 $ 477 $ (45) $ 522 10 Gains and other income (expense) 19 (28) 47 42 (1) 43 9 Interest income, provision for loan losses and interest expense (76) (9) (67) (31) 2 (33) (103) Equity in earnings (losses) 1 - 1 3 - 3 (67) Income (losses) from continuing operations before income taxes and minority interest 445 (108) 553 491 (44) 535 3 Tax (provision) benefit (175) 39 (214) (173) 14 (187) (14) Tax credits 119 119 - 32 32 - * Total tax (provision) benefit (56) 158 (214) (141) 46 (187) (14) Minority interest - - - 6 5 1 (100) Income from continuing operations $ 389 $ 50 $ 339 $ 356 $ 7 $ 349 (3) Diluted shares 407.9 407.9 407.9 438.9 438.9 438.9 Earnings per share from continuing operations - diluted $ 0.95 $ 0.12 $ 0.83 $ 0.81 $ 0.02 $ 0.79 5 Tax rate 12.6% 38.7% 28.7% 35.0% Percentage not meaningful. * ** Denotes non-GAAP financial measures. 14
- 15. MARRIOTT INTERNATIONAL, INC. Non-GAAP Financial Measure Reconciliation Measures that Exclude Synthetic Fuel and the ESOP Settlement (in millions, except per share amounts) Second Quarter 2007 Excluding Synthetic Fuel and Synthetic Fuel the ESOP As Reported Impact ESOP Settlement Settlement** Operating income (loss) $ 300 $ (35) $ (35) $ 370 Gains and other income (expense) (4) (16) - 12 Interest income, provision for loan losses and interest expense (46) (3) (13) (30) Equity in earnings (losses) (1) - - (1) Income (losses) operations before income taxes and minority interest 249 (54) (48) 351 Tax (provision) benefit (108) 20 (6) (122) Tax credits 66 66 - - Total tax (provision) benefit (42) 86 (6) (122) Minority interest - - - - Net Income $ 207 $ 32 $ (54) $ 229 Diluted shares 403.8 403.8 403.8 403.8 1 Earnings per share - diluted $ 0.51 $ 0.08 $ (0.13) $ 0.57 Tax rate 16.9% 34.8% ** Denotes non-GAAP financial measures. 1 Earnings per share does not crossfoot due to rounding. 15
- 16. MARRIOTT INTERNATIONAL, INC. Non-GAAP Financial Measure EBITDA and Adjusted EBITDA ($ in millions) Fiscal Year 2007 Second First Quarter Quarter Total Net income $ 182 $ 207 $ 389 Interest expense 33 52 85 Tax provision 14 42 56 Depreciation and amortization 46 45 91 Less: Depreciation reimbursed by third-party owners (4) (4) (8) Interest expense from unconsolidated joint ventures 5 5 10 Depreciation and amortization from unconsolidated joint ventures 6 7 13 EBITDA** $ 282 $ 354 $ 636 Synthetic Fuel adjustment 52 52 104 ESOP settlement - Excise Tax - 35 35 Adjusted EBITDA** $ 334 $ 441 $ 775 Increase (Decrease) over 2006 Adjusted EBITDA 3% 21% 13% The following items make up the Synthetic Fuel adjustment: Pre-tax Synthetic Fuel operating losses (income) $ 54 $ 54 $ 108 Pre-tax minority interest - Synthetic Fuel - - - Synthetic Fuel depreciation (2) (2) (4) EBITDA adjustment for Synthetic Fuel $ 52 $ 52 $ 104 Fiscal Year 2006 Second Third Fourth First Quarter Quarter Quarter Quarter Total Net income $ 61 $ 186 $ 141 $ 220 $ 608 Cumulative effect of change in accounting principle 173 - - - 173 Interest expense 27 30 29 38 124 Tax provision (benefit) 56 85 82 63 286 Tax benefit from cumulative effect of change in accounting principle (64) - - - (64) Depreciation and amortization 40 42 44 62 188 Less: Depreciation reimbursed by third-party owners (4) (4) (4) (6) (18) Interest expense from unconsolidated joint ventures 5 6 5 7 23 Depreciation and amortization from unconsolidated joint ventures 6 7 7 9 29 EBITDA** $ 300 $ 352 $ 304 $ 393 $ 1,349 Synthetic Fuel adjustment 24 11 (4) 44 75 Adjusted EBITDA** $ 324 $ 363 $ 300 $ 437 $ 1,424 The following items make up the Synthetic Fuel adjustment: Pre-tax Synthetic Fuel operating losses (income) $ 31 $ 13 $ (2) $ 53 $ 95 Pre-tax minority interest - Synthetic Fuel (5) - - (1) (6) Synthetic Fuel depreciation (2) (2) (2) (8) (14) EBITDA adjustment for Synthetic Fuel $ 24 $ 11 $ (4) $ 44 $ 75 ** Denotes non-GAAP financial measures. 16