
Recomendados
Mais conteúdo relacionado
Mais procurados
Mais procurados (20)
Destaque
Destaque (20)
Semelhante a qwest communications 2Q 08 Earnings Release
Semelhante a qwest communications 2Q 08 Earnings Release (20)
Mais de finance19
Mais de finance19 (20)
Último
Último (20)
qwest communications 2Q 08 Earnings Release
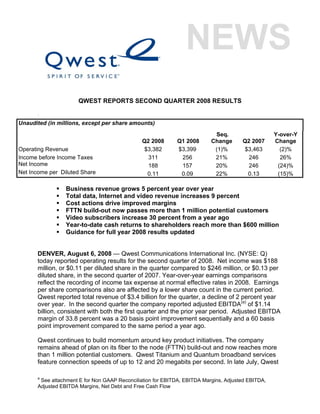
- 1. QWEST REPORTS SECOND QUARTER 2008 RESULTS . Unaudited (in millions, except per share amounts) Seq. Y-over-Y Q2 2008 Q1 2008 Change Q2 2007 Change Operating Revenue $3,382 $3,399 (1)% $3,463 (2)% Income before Income Taxes 311 256 21% 246 26% Net Income 188 157 20% 246 (24)% Net Income per Diluted Share 0.11 0.09 22% 0.13 (15)% Business revenue grows 5 percent year over year Total data, Internet and video revenue increases 9 percent Cost actions drive improved margins FTTN build-out now passes more than 1 million potential customers Video subscribers increase 30 percent from a year ago Year-to-date cash returns to shareholders reach more than $600 million Guidance for full year 2008 results updated DENVER, August 6, 2008 — Qwest Communications International Inc. (NYSE: Q) today reported operating results for the second quarter of 2008. Net income was $188 million, or $0.11 per diluted share in the quarter compared to $246 million, or $0.13 per diluted share, in the second quarter of 2007. Year-over-year earnings comparisons reflect the recording of income tax expense at normal effective rates in 2008. Earnings per share comparisons also are affected by a lower share count in the current period. Qwest reported total revenue of $3.4 billion for the quarter, a decline of 2 percent year over year. In the second quarter the company reported adjusted EBITDA(a) of $1.14 billion, consistent with both the first quarter and the prior year period. Adjusted EBITDA margin of 33.8 percent was a 20 basis point improvement sequentially and a 60 basis point improvement compared to the same period a year ago. Qwest continues to build momentum around key product initiatives. The company remains ahead of plan on its fiber to the node (FTTN) build-out and now reaches more than 1 million potential customers. Qwest Titanium and Quantum broadband services feature connection speeds of up to 12 and 20 megabits per second. In late July, Qwest a See attachment E for Non GAAP Reconciliation for EBITDA, EBITDA Margins, Adjusted EBITDA, Adjusted EBITDA Margins, Net Debt and Free Cash Flow
- 2. began selling Verizon Wireless service to new residential and business customers and the migration of existing Qwest-branded customers is expected to commence later this year. “During the second quarter we continued to make good progress on our strategic imperatives,” said Edward A. Mueller, chairman and CEO for Qwest. “Under more challenging conditions in some of our markets, operating results were mixed. Our Business segment’s performance was solid, particularly within the high-growth strategic product set. This growth was offset by lower revenue contributions from the Mass Markets and Wholesale segments. As we head into the second half of the year, our focus continues on delivering an exceptional customer experience, providing differentiated service offerings, retaining disciplined cost management and generating cash flows to support growth initiatives and provide tangible returns for our shareholders.” CONSOLIDATED FINANCIAL RESULTS Revenue Operating revenue in the quarter reflects strong demand for strategic products, which was offset by continued pressure on voice services. Increasing customer demand for enterprise iQ Networking™ services and equipment contributed to total data, Internet and video services revenue growing 9 percent year over year. Total data, Internet and video services revenue now represents 40 percent of operating revenue. Total voice services revenue of $1.8 billion declined 9 percent year over year as access lines continued to be impacted by increased competition, wireless substitution and deteriorating economic trends. At the end of the second quarter, total access lines were 12.2 million – a decline of 8.2 percent from the end of the second quarter of 2007. Expenses Operating expenses in the second quarter were $2.8 billion, a decrease of 4 percent compared to the same period in 2007. All categories of operating expenses contributed to the year-over-year decline. After normalizing for the first quarter severance charge, total operating expenses were down 1 percent sequentially, reflecting a 4 percent savings in employee-related expenses. These savings were offset by higher equipment costs and network expenses. Results for the second quarter include approximately $5 million of revenue and expense impact related to recent flooding in Iowa. Expenses associated with flood-related restoration work are currently expected to be $15 to $20 million, net of insurance proceeds, through the remainder of the year. Net Income 2
- 3. Net income for the quarter was $188 million compared to $157 million in the first quarter of 2008 and $246 million in the year-ago quarter. The sequential increase in net income is due to the recognition of a severance charge in the first quarter. The year-over-year decline in net income was largely the result of the reversal of the valuation allowance against deferred tax assets in 2007 leading to higher income tax expense year over year. Cash taxes remain immaterial due to historical net operating loss carryforwards (NOLs). Income before income taxes was $311 million for the quarter, an increase of 26 percent compared to the second quarter of 2007. Net income this quarter includes a charge of $40 million to shareholder litigation reserves and a favorable $40 million settlement on property taxes. SEGMENT RESULTS Business Markets Business Markets reported revenue of $1.0 billion in the second quarter, up 5 percent year over year. Data and Internet revenue grew 10 percent compared to the second quarter of 2007, outpacing declines in legacy voice services. Qwest’s strategic product revenue – a combination of hosting, equipment sales and IP-based network services – increased 36 percent compared to the second quarter of 2007. Sequentially, strategic products improved by 13 percent on strong equipment revenue and growth in iQ Networking™, ultra long-haul and contact center solutions. Segment income was $394 million, an increase of 2 percent year over year and 4 percent sequentially. Segment income margin of 38.8 percent compares to 39.9 percent a year ago and 38.1 percent in the first quarter. Mass Markets Mass Markets revenue was $1.5 billion in the quarter, a 3 percent decline compared to the prior year and a 2 percent decline compared to the first quarter. Voice and wireless services revenue declined 8 percent compared to the second quarter of 2007 and 3 percent sequentially due to competition, technology substitution and economic pressures. Data, Internet and video revenue improved 17 percent compared to the second quarter of 2007 primarily on subscriber growth, and grew 2 percent sequentially. Mass Markets access lines were 8.3 million at the end of the quarter, a decline of 8.8 percent from the year-ago period. In the quarter, the revenue impact from access line losses was partially mitigated by an increased ARPU from customers purchasing bundled services. Net broadband subscriber growth for the period was 31,000. During the quarter 19,000 subscribers purchased Qwest Broadband services on the FTTN network with most opting for connection speeds of 7Mbps or higher. In the quarter, Qwest added 32,000 video subscribers, raising the total video subscriber base to 722,000, which is an increase of 30 percent from a year ago. 3
- 4. Mass Markets segment income was flat year over year and up 1 percent sequentially to $725 million. Segment income margin of 49.9 percent improved from 48.5 percent in the year-ago period and 48.4 percent in the first quarter. Wholesale Markets Revenue in Wholesale Markets was $823 million for the quarter, a decline of 8 percent year over year largely due to competitive pricing pressures, industry consolidation and impacts from local access line losses. Sequentially, revenue declined by 2 percent as a result of lower network traffic volumes. Segment income of $472 million declined by 9 percent compared to the second quarter of 2007 and decreased 4 percent from the first quarter of 2008. Segment income margin of 57.4 percent compares to 58.1 percent a year ago and 58.6 percent in the first quarter. CASH FLOW, CAPITAL SPENDING AND INTEREST Adjusted free cash flow for the quarter was $460 million compared to $679 million in the second quarter of 2007. The adjusted free cash flow in the period reflects increased working capital requirements and higher capital spending from the year-ago period. Total capital investment for the quarter was $534 million compared to $426 million in the prior year. Sequentially, capital expenditures were up $118 million mainly due to the planned ramp of FTTN deployment in targeted markets. Interest expense declined 6 percent year over year as a result of retiring higher coupon debt instruments during 2007. BALANCE SHEET Total gross debt remained flat in the quarter at $14.2 billion. Cash and investments were $910 million at the end of the period. Net debt of $13.3 billion declined by approximately $100 million sequentially. RETURNS TO SHAREHOLDERS Since the first of the year, Qwest has returned more than $600 million to shareholders through a combination of quarterly dividends and share repurchases. The company has approximately $300 million remaining under a $2 billion share repurchase authorization and expects to complete these repurchases prior to year end. On July 17, Qwest announced that a dividend of $0.08 per share will be paid on August 29, 2008, to all stockholders of record at the close of business on August 8, 2008. GUIDANCE 4
- 5. Qwest is updating guidance for full year 2008 results. For the full year, total revenue is forecast to decline as much as 2.5 percent. Excluding wireless, revenue could decline by up to 2 percent compared to $13.2 billion in 2007. In the second half of the year, Business Markets revenue is expected to continue to grow in line with first half performance while Mass Markets will continue to be pressured. Wholesale comparisons are expected to modestly improve in the second half. As the result of the migration to the Verizon Wireless agency arrangement and a corresponding change from gross to net revenue accounting, wireless revenue is expected to begin to decline at a rapid pace in the second half. Full year wireless revenue could be down 20 percent. Including flood related charges, adjusted EBITDA is expected to be 1 to 2 percent below the $4.6 billion reported in 2007. Adjusted free cash flow is now expected to be between $1.5 and $1.6 billion. Capital expenditures for the full year are expected to be approximately $1.8 billion. Conference Call Today As previously announced, Qwest will host a conference call for investors and the media today at 9 a.m. EDT. A live webcast, including a simultaneous slide presentation, and replay of the call is available at www.qwest.com/about/investor/events. About Qwest Customers coast to coast turn to Qwest's industry-leading national fiber-optic network and world-class Spirit of Service to meet their communications and entertainment needs. For residential customers, Qwest’s powerful combination of award-winning high- speed Internet, home and wireless voice solutions and digital TV includes a new generation of fiber-optic Internet services. Qwest is also the choice of 95 percent of Fortune 500 companies, offering a full suite of network, data and voice services for small businesses, large businesses and government agencies. Additionally, Qwest participates in Networx, the largest communications services contract in the world, and is recognized as a leader in the network services market by a leading technology industry analyst firm. ### Forward-Looking Statement Note 5
- 6. This release may contain projections and other forward-looking statements that involve risks and uncertainties. These statements may differ materially from actual future events or results. Readers are referred to the documents filed by us with the Securities and Exchange Commission, specifically the most recent reports which identify important risk factors that could cause actual results to differ from those contained in the forward-looking statements, including but not limited to: access line losses due to increased competition, including from technology substitution of our access lines with wireless and cable alternatives, among others; our substantial indebtedness, and our inability to complete any efforts to further de-lever our balance sheet; adverse results of increased review and scrutiny by media and others (including any internal analyses) of financial reporting issues and practices or otherwise; rapid and significant changes in technology and markets; any adverse developments in commercial disputes or legal proceedings; potential fluctuations in quarterly results; volatility of our stock price; intense competition in the markets in which we compete including the effects of consolidation in our industry; changes in demand for our products and services; acceleration of the deployment of advanced new services, such as broadband data, wireless and video services, which could require substantial expenditure of financial and other resources in excess of contemplated levels; higher than anticipated employee levels, capital expenditures and operating expenses; adverse changes in the regulatory or legislative environment affecting our business; changes in the outcome of future events from the assumed outcome included in our significant accounting policies; and our ability to utilize net operating losses in projected amounts. The information contained in this release is a statement of Qwest’s present intention, belief or expectation and is based upon, among other things, the existing regulatory environment, industry conditions, market conditions and prices, the economy in general and Qwest’s assumptions. Qwest may change its intention, belief or expectation, at any time and without notice, based upon any changes in such factors, in Qwest’s assumptions or otherwise. The cautionary statements contained or referred to in this release should be considered in connection with any subsequent written or oral forward-looking statements that Qwest or persons acting on its behalf may issue. This release may include analysts’ estimates and other information prepared by third parties for which Qwest assumes no responsibility. Qwest undertakes no obligation to review or confirm analysts’ expectations or estimates or to release publicly any revisions to any forward-looking statements and other statements to reflect events or circumstances after the date hereof or to reflect the occurrence of unanticipated events. By including any information in this release, Qwest does not necessarily acknowledge that disclosure of such information is required by applicable law or that the information is material. The marks that comprise the Qwest logo are registered trademarks of Qwest Communications International Inc. in the U.S. and certain other countries. Media Contact: Investor Contact: Contacts: Diane Reberger Kurt Fawkes 303-992-1662 800-567-7296 diane.reberger@qwest.com IR@qwest.com 6