SlideShare uma empresa Scribd logo
1 de 43
Baixar para ler offline
DILUTED EARNINGS PER SHARE                                                                                      S E L E C T E D C A S H F L OW DATA
                                 ( C O N T I N U I N G O P E R AT I O N S )


              1.20                                                                                                  1000

              1.00
                                                                                                                           800


                                                                                                  $ MILLIONS
                .80
   DOLLARS


                                                                                                                           600
                .60
                                                                                                                           400
                .40

                                                                                                                           200
                .20

                 0                                                                                                           0
                       99              00            01            02               03                                                    99           00             01          02         03
                                                   (FYE)                                                                                                         (FYE)

                                                                                                                                   N E T C A S H F R O M O P E R AT I N G A C T I V I T I E S
                                                                                                                            P RO P E RT Y A D D I T I O N S         SHARE REPURCHASES


                            C O N S O L I DAT E D S T O R E C O U N T                                                                                 T J X A S S O C I AT E S


              2,000                                                                                                         100


              1,500                                                                                                          75
                                                                                                               THOUSANDS
   STORES


              1,000                                                                                                          50


                500                                                                                                          25


                                                                                                                                 0
                  0
                      84          88               93             98                                                                 89        91       93      95         97     99    01
                                                                                    03                                                                                                            03
                                                  (FYE)                                                                                                              (FYE)


                              A N N UA L N E T S TO R E G ROW T H                                                                LONG-TERM STORE BASE POTENTIAL


                                                                                                                                                                                1,342        1,800
                                FY03          FY04E            FY05E            FY06E
                                                                                                 MARMAXX
             MARMAXX 1,342                          79             75                75                                                                                         146           200
                                                                                                 WINNERS
                                 123                30             30                30
             T. K . M A X X
                                                                                                                                               15                                                 80
                                                                                               HOMESENSE
                                 142                37             40                43
  HOMEGOODS
                                                                                                                                                123                                     300–600
                                  75                25             35                45
  A.J. WRIGHT
                                                                                                T. K . M A X X
                                 146                13             10                10
              WINNERS
                                                                                                                                                                                              650
                                                                                                                                                142
                                                                                               HOMEGOODS
                                  15                    8          10                12
     HOMESENSE
                                                                                                                                          75                                                 1,000+
                                                                                               A.J. WRIGHT
                                            192             200               215
  NEW STORES
                                                                                                                                                             1,843                           4,330
T O TA L S T O R E S 1 , 8 4 3                2,035           2,235             2,450           T J X T O TA L


                                                                                                                                     STORES FYE 03                    G ROW T H P OT E N T I A L


                                                                                          16
T H E T J X C O M PA N I E S , I N C .


Selected Financial Data (Continuing Operations)
Amounts In Thousands                                                                               Fiscal Year Ended January
Except Per Share Amounts                                           2003                     2002                   2001                2000               1999

Income statement and per share data:
  Net sales                          $11,981,207                              $10,708,998               $9,579,006             $8,795,347         $7,949,101
   Income from continuing operations
     before cumulative effect of
     accounting change               $                      578,388           $      540,397            $ 538,066              $ 526,822          $ 433,202
   Weighted average common
    shares for diluted earnings
    per share calculation                                   537,740                  556,268               578,392               635,582              669,296
   Diluted earnings per share
     from continuing operations
     before cumulative effect of
     accounting change                                          $1.08                     $.97                  $.93                  $.83               $.65
   Cash dividends declared per share                            $ .12                     $.09                  $.08                  $.07               $.06
Balance sheet data:
  Cash and cash equivalents                           $     492,330           $     492,776             $ 132,535              $ 371,759          $ 461,244
  Working capital                                           674,195                 800,916                537,185                532,017            663,902
  Total assets                                            3,940,489               3,595,743              2,932,283              2,804,963          2,760,127
  Capital expenditures                                      396,724                 449,444                257,005                238,569            207,742
  Long-term obligations (1)                                 693,764                 702,379                319,372                319,367            220,344
  Shareholders’ equity                                    1,409,147               1,340,698              1,218,712              1,119,228          1,220,656
Other financial data:
  After-tax return on average
    shareholders’ equity                                          42.1%                    42.2%                 46.0%                45.0%              36.3%
  Total debt as a percentage
    of total capitalization (2)                                   33.5%                    34.4%                 22.7%                27.3%              15.3%
Stores in operation at year-end:
  T.J. Maxx                                                       713                      687                   661                  632                 604
  Marshalls                                                       629                      582                   535                  505                 475
  Winners                                                         146                      131                   117                  100                  87
  T.K. Maxx                                                       123                      101                    74                   54                  39
  HomeGoods                                                       142                      112                    81                   51                  35
  A.J. Wright                                                      75                       45                    25                   15                   6
  HomeSense                                                        15                        7                     -                    -                   -
  Total                                                         1,843                    1,665                 1,493                1,357               1,246
(1) Includes long-term debt, exclusive of current installments and obligation under capital lease, less portion due within one year.
(2) Total capitalization includes shareholders’ equity, short-term debt, long-term debt and capital lease obligation, including current maturities.


                                                                                17
T H E T J X C O M PA N I E S , I N C .


Consolidated Statements of Income
                                                                                                                         Fiscal Year Ended
                                                                                                       January 25,              January 26,      January 27,
Amounts In Thousands Except Per Share Amounts                                                                2003                     2002             2001

Net sales                                                                                       $11,981,207          $10,708,998              $9,579,006
Cost of sales, including buying and occupancy costs                                                   9,079,579           8,122,922            7,188,124
Selling, general and administrative expenses                                                          1,938,531           1,686,389            1,503,036
Interest expense, net                                                                                    25,373              25,643               22,904


Income from continuing operations before
  provision for income taxes                                                                           937,724               874,044            864,942
Provision for income taxes                                                                             359,336               333,647            326,876


Income from continuing operations                                                                      578,388               540,397            538,066
(Loss) from discontinued operations, net of income taxes                                                     -               (40,000)                 -


Net income                                                                                      $      578,388       $       500,397          $ 538,066


Basic earnings per share:
  Income from continuing operations                                                                      $1.09                  $.98               $.94
  Net income                                                                                             $1.09                  $.91               $.94
  Weighted average common shares - basic                                                               532,241               550,647            574,881


Diluted earnings per share:
  Income from continuing operations                                                                      $1.08                  $.97               $.93
  Net income                                                                                             $1.08                  $.90               $.93
  Weighted average common shares - diluted                                                             537,740               556,268            578,392


Cash dividends declared per share                                                                         $ .12                    $.09              $.08
The accompanying notes are an integral part of the financial statements.


                                                                              18
T H E T J X C O M PA N I E S , I N C .


Consolidated Balance Sheets
                                                                                                      January 25,       January 26,
In Thousands                                                                                                2003              2002

Assets
  Current assets:
    Cash and cash equivalents                                                                     $ 492,330         $ 492,776
    Accounts receivable                                                                               75,515            69,209
    Merchandise inventories                                                                        1,563,450         1,456,976
    Prepaid expenses and other current assets                                                        100,284            84,962
    Current deferred income taxes, net                                                                 8,961            12,003
       Total current assets                                                                        2,240,540         2,115,926
  Property at cost:
    Land and buildings                                                                              230,810            172,016
    Leasehold costs and improvements                                                                970,981            853,733
    Furniture, fixtures and equipment                                                             1,409,123          1,210,366
                                                                                                  2,610,914          2,236,115
     Less accumulated depreciation and amortization                                               1,232,189          1,076,196
                                                                                                  1,378,725          1,159,919
  Property under capital lease, net of accumulated
    amortization of $3,723 and $1,489, respectively                                                    28,849            31,083
  Other assets                                                                                       113,192            83,139
  Non-current deferred income taxes, net                                                                   -            26,575
  Goodwill and tradename, net of amortization                                                        179,183           179,101
      Total Assets                                                                                $3,940,489        $3,595,743
Liabilities
  Current liabilities:
    Current installments of long-term debt                                                        $  15,000         $        -
    Obligation under capital lease due within one year                                                1,348              1,244
    Accounts payable                                                                                817,633            761,546
    Accrued expenses and other current liabilities                                                  669,732            510,270
    Federal, foreign and state income taxes payable                                                  62,632             41,950
        Total current liabilities                                                                 1,566,345          1,315,010
  Other long-term liabilities                                                                         229,264           237,656
  Non-current deferred income taxes, net                                                               41,969                 -
  Obligation under capital lease, less portion due within one year                                     28,988            30,336
  Long-term debt, exclusive of current installments                                                   664,776           672,043
  Commitments and contingencies                                                                             -                 -
Shareholders’ Equity
  Common stock, authorized 1,200,000,000 shares, par value $1,
    issued and outstanding 520,515,041 and 543,075,306
    (post-split) shares, respectively                                                                520,515           271,538
  Additional paid-in capital                                                                               -                 -
  Accumulated other comprehensive income (loss)                                                       (3,164)           (6,755)
  Unearned stock compensation                                                                         (7,652)           (4,654)
  Retained earnings                                                                                  899,448         1,080,569
    Total shareholders’ equity                                                                     1,409,147         1,340,698
    Total Liabilities and Shareholders’ Equity                                                    $3,940,489        $3,595,743
The accompanying notes are an integral part of the financial statements.


                                                                           19
T H E T J X C O M PA N I E S , I N C .


Consolidated Statements of Cash Flows
                                                                                                                 Fiscal Year Ended
                                                                                                   January 25,       January 26,      January 27,
In Thousands                                                                                             2003              2002             2001

Cash flows from operating activities:
  Net income                                                                                      $578,388       $500,397            $538,066
  Adjustments to reconcile net income to net cash
    provided by operating activities:
       Loss from discontinued operations, net of income taxes                                            -          40,000                  -
       Depreciation and amortization                                                               207,876         204,081            175,781
       Property disposals and impairments                                                            8,699           6,832              4,559
       Tax benefit of employee stock options                                                        11,767          30,644             15,941
       Deferred income tax provision (benefit)                                                      72,138          35,230            (24,235)
    Changes in assets and liabilities:
       (Increase) in accounts receivable                                                            (5,983)         (7,615)            (6,501)
       (Increase) in merchandise inventories                                                       (85,644)        (13,292)          (232,031)
       (Increase) in prepaid expenses and other current assets                                     (22,208)         (1,273)           (12,083)
       Increase in accounts payable                                                                 45,559         120,770             34,158
       Increase in accrued expenses and other liabilities                                          112,781          16,116             69,726
       Increase (decrease) in income taxes payable                                                  20,334             (62)              (592)
    Other, net                                                                                     (35,147)        (19,382)            (6,026)
  Net cash provided by operating activities                                                        908,560         912,446            556,763
Cash flows from investing activities:
  Property additions                                                                              (396,724)      (449,444)           (257,005)
  Issuance of note receivable                                                                            -         (5,527)            (23,100)
  Proceeds from repayments on note receivable                                                          564            125                   -
  Proceeds from sale of other assets                                                                     -              -               9,183
  Net cash (used in) investing activities                                                         (396,160)      (454,846)           (270,922)
Cash flows from financing activities:
  Proceeds from borrowings of short-term debt, net                                                       -              -              39,000
  Proceeds from borrowings of long-term debt                                                             -        347,579                   -
  Principal payments on long-term debt                                                                   -            (73)           (100,203)
  Payments on short-term debt, net                                                                       -        (39,000)                  -
  Payments on capital lease obligation                                                              (1,244)          (992)                  -
  Proceeds from sale and issuance of common stock, net                                              33,916         65,202              26,101
  Cash payments for repurchase of common stock                                                    (481,734)      (424,163)           (444,105)
  Cash dividends paid                                                                              (60,025)       (48,290)            (44,693)
  Net cash (used in) financing activities                                                         (509,087)       (99,737)           (523,900)
  Effect of exchange rate changes on cash                                                           (3,759)           2,378            (1,165)
  Net (decrease) increase in cash and cash equivalents                                                (446)       360,241            (239,224)
  Cash and cash equivalents at beginning of year                                                   492,776        132,535             371,759
  Cash and cash equivalents at end of year                                                        $492,330       $492,776            $132,535
The accompanying notes are an integral part of the financial statements.


                                                                           20
T H E T J X C O M PA N I E S , I N C .


Consolidated Statements of Shareholders’ Equity
                                                                                                Accumulated
                                                                 Common            Additional         Other     Unearned
                                                                 Stock, Par           Paid-in Comprehensive         Stock       Retained
In Thousands                                                      Value $1            Capital  Income (Loss) Compensation       Earnings          Total
Balance, January 29, 2000                                   $299,979           $          -   $ (1,433)       $(3,739) $ 824,421           $1,119,228
 Comprehensive income:
    Net income                                                           -                -              -             -     538,066         538,066
    (Loss) due to foreign currency
      translation adjustments                                            -                -     (11,860)               -              -       (11,860)
    Gain on net investment hedge contracts                               -                -      11,547                -              -        11,547
    Minimum pension liability adjustment                                 -                -      (1,675)               -              -        (1,675)
    Reclassification of prior unrealized loss
      on securities                                                      -                -           133              -              -          133
 Total comprehensive income                                                                                                                  536,211
 Cash dividends declared on common stock                               -                -                -           -       (45,266)        (45,266)
 Restricted stock awards granted                                      10              197                -        (207)            -               -
 Restricted stock awards forfeited                                   (33)            (942)               -         975             -               -
 Amortization of unearned stock compensation                           -                -                -       1,420             -           1,420
 Issuance of common stock under stock
    incentive plans and related tax benefits                    2,656               39,293               -             -           -          41,949
 Common stock repurchased                                     (22,233)             (38,548)              -             -    (374,049)       (434,830)
Balance, January 27, 2001                                     280,379                     -         (3,288)     (1,551)      943,172        1,218,712
 Comprehensive income:
    Net income                                                           -                -              -             -     500,397         500,397
    Cumulative effect of accounting
      change (SFAS No.133)                                               -                -         (1,572)            -              -        (1,572)
    (Loss) due to foreign currency
      translation adjustments                                            -                -         (8,185)            -              -        (8,185)
    Gain on net investment hedge contracts                               -                -          8,190             -              -         8,190
    Minimum pension liability adjustment                                 -                -         (2,151)            -              -        (2,151)
    Amounts reclassified from other
      comprehensive income to net income                                 -                -           251              -              -          251
 Total comprehensive income                                                                                                                  496,930
 Cash dividends declared on common stock                              -                 -                -           -       (49,295)        (49,295)
 Restricted stock awards granted                                    225             7,137                -      (5,775)            -           1,587
 Amortization of unearned stock compensation                          -                 -                -       2,672             -           2,672
 Issuance of common stock under stock
    incentive plans and related tax benefits                    4,102               90,153               -             -           -          94,255
 Common stock repurchased                                     (13,168)             (97,290)              -             -    (313,705)       (424,163)
Balance, January 26, 2002                                     271,538                     -         (6,755)     (4,654)     1,080,569       1,340,698
 Comprehensive income:
    Net income                                                           -                -              -             -     578,388         578,388
    Gain due to foreign currency
      translation adjustments                                            -                -      23,006                -              -       23,006
    (Loss) on net investment hedge contracts                             -                -     (23,241)               -              -      (23,241)
    Minimum pension liability adjustment                                 -                -       3,826                -              -        3,826
 Total comprehensive income                                                                                                                  581,979
 Stock split, two-for-one                                     269,431                   -                -           -      (269,431)              -
 Cash dividends declared on common stock                            -                   -                -           -       (63,421)        (63,421)
 Restricted stock awards granted                                  325               5,870                -      (6,195)            -               -
 Amortization of unearned stock compensation                        -                   -                -       3,197             -           3,197
 Issuance of common stock under stock
    incentive plans and related tax benefits                    2,505               41,794               -             -           -          44,299
 Common stock repurchased                                     (23,284)             (47,664)              -             -    (426,657)       (497,605)
Balance, January 25, 2003                                   $520,515           $          -   $ (3,164)       $(7,652) $ 899,448           $1,409,147
The accompanying notes are an integral part of the financial statements.


                                                                              21
T H E T J X C O M PA N I E S , I N C .


Notes to Consolidated Financial Statements
A . S U M M A RY O F A C C O U N T I N G P O L I C I E S
Basis of Presentation: The consolidated financial statements of The TJX Companies, Inc. (“TJX”, the “Company” or
“We”) include the financial statements of all of TJX’s subsidiaries, including our foreign subsidiaries, all of which
are wholly owned. All of TJX’s activities are conducted within TJX or our subsidiaries and are consolidated in these
financial statements. All intercompany transactions have been eliminated in consolidation. The notes pertain to
continuing operations except where otherwise noted.
Fiscal Year: TJX’s fiscal year ends on the last Saturday in January. The fiscal years ended January 25, 2003 (“fiscal
2003”), January 26, 2002 and January 27, 2001 each included 52 weeks.
Use of Estimates: The preparation of the financial statements, in conformity with accounting principles generally
accepted in the United States, requires management to make estimates and assumptions that affect the reported
amounts of assets and liabilities, and disclosure of contingent liabilities, at the date of the financial statements as well
as the reported amounts of revenues and expenses during the reporting period. TJX considers the more significant
accounting policies that involve management estimates and judgments to be those relating to inventory valuation,
retirement obligations, accounting for taxes and reserves for discontinued operations. Actual amounts could differ
from those estimates.
Revenue Recognition: TJX records revenue at the time of sale and receipt of merchandise by the customer, net of a
reserve for estimated returns. We estimate returns based upon our historical experience. We defer recognition of a
layaway sale and its related profit to the accounting period when the customer receives layaway merchandise.
Consolidated Statements of Income Classifications: Cost of sales, including buying and occupancy costs include the
cost of merchandise sold; store occupancy costs (including real estate taxes, utility and maintenance costs, and fixed
asset depreciation); the costs of operating our distribution centers; payroll, benefits and travel costs directly associ-
ated with buying inventory; and systems costs related to the buying and tracking of inventory.
  Selling, general and administrative expenses include store payroll and benefit costs; communication costs; credit
and check expenses; advertising; administrative and field management payroll, benefits and travel costs; corporate
administrative costs and depreciation; gains and losses on foreign currency exchange contracts and other nonrecur-
ring gains or losses; and all other miscellaneous income and expense items.
Cash, Cash Equivalents and Short-Term Investments: TJX generally considers highly liquid investments with an
initial maturity of three months or less to be cash equivalents. Our investments are primarily high-grade commer-
cial paper, institutional money market funds and time deposits with major banks. The fair value of cash equivalents
approximates carrying value. During September 1999, we received 693,537 common shares of Manulife Financial
Corporation. The shares reflected ownership interest in the demutualized insurer due to policies held by TJX. These
securities were recorded at market value upon receipt resulting in an $8.5 million pre-tax gain. During fiscal 2001,
we sold all of these shares for $9.2 million and realized a gain of $722,000.
Merchandise Inventories: Inventories are stated at the lower of cost or market.TJX uses the retail method for valuing
inventories on the first-in first-out basis. We almost exclusively utilize a permanent markdown strategy and lower the
cost value of the inventory that is subject to markdown at the time the retail prices are lowered in our stores.
Common Stock and Equity: TJX’s equity transactions consist primarily of the repurchase of our common stock under
our stock repurchase program and the issuance of common stock under our stock incentive plan. Under the stock
repurchase program we repurchase our common stock on the open market. The par value of the shares repurchased
is charged to common stock with the excess of the purchase price over par first charged against any available addi-
tional paid-in capital (“APIC”) and the balance charged to retained earnings. Virtually all shares are retired when
purchased. We have an immaterial number of shares held in treasury which are reflected as a reduction to common
stock outstanding.
   Shares issued under our stock incentive plan are issued from authorized but previously unissued shares, and proceeds
received are recorded by increasing common stock for the par value of the shares with the excess over par added to
APIC. Income tax benefits due to the exercise of stock options are also added to APIC and included with the proceeds
received from the option exercise. The income tax benefits are included in cash flows from operating activities in the
statements of cash flows. The par value and excess of the fair value over par value of restricted stock awards are also
added to common stock and APIC with an offsetting amount recorded in unearned stock compensation. The amount


                                                                            22
T H E T J X C O M PA N I E S , I N C .


included in unearned stock compensation is amortized into earnings over the vesting period of the related award. Due
to the high volume of repurchases over the past several years we have no remaining balance in APIC.
  TJX has adopted the disclosure-only provisions of Statement of Financial Accounting Standards (“SFAS”) No.123,
“Accounting for Stock-Based Compensation,” and continues to apply the provisions of Accounting Principles Board
Opinion No.25, “Accounting for Stock Issued to Employees,” in accounting for compensation expense under its stock
option plans. TJX grants options at fair market value on the date of the grant, accordingly no compensation expense
has been recognized for the stock options issued during fiscal 2003, 2002 or 2001. Compensation expense deter-
mined in accordance with SFAS No.123, net of related income tax effect, amounted to $39.7 million, $27.8 million
and $19.2 million for fiscal 2003, 2002 and 2001, respectively. Disclosure as required by SFAS No.148, as discussed
in New Accounting Standards below, is presented in Note E.
Interest: TJX’s interest expense, net was $25.4 million, $25.6 million and $22.9 million in fiscal 2003, 2002 and
2001, respectively. Interest expense is presented net of interest income of $10.5 million, $15.0 million and
$11.8 million in fiscal 2003, 2002 and 2001, respectively. We capitalize interest during the active construction
period of major capital projects. Capitalized interest is added to the cost of the related assets. We capitalized interest
of $559,000, $222,000 and $311,000 in fiscal 2003, 2002 and 2001, respectively. Debt discount and related issue
expenses are amortized to interest expense over the lives of the related debt issues or to the first date the holders of
the debt may request TJX to repurchase such debt.
Depreciation and Amortization: For financial reporting purposes, TJX provides for depreciation and amortization of
property by the use of the straight-line method over the estimated useful lives of the assets. Buildings are depreciated
over 33 years, leasehold costs and improvements are generally amortized over the lease term (typically 10 years) or
their estimated useful life, whichever is shorter, and furniture, fixtures and equipment are depreciated over 3 to 10
years. Depreciation and amortization expense for property was $196.4 million for fiscal 2003,
$183.1 million for fiscal 2002, and $169.1 million for fiscal 2001. Amortization expense for property held under a
capital lease was $2.2 million and $1.5 million in fiscal 2003 and 2002, respectively. Maintenance and repairs are
charged to expense as incurred. Significant costs incurred for internally developed software are capitalized and amor-
tized over three to five years. Upon retirement or sale, the cost of disposed assets and the related accumulated
depreciation are eliminated and any gain or loss is included in net income. Pre-opening costs are expensed as incurred.
Goodwill and Tradename: Goodwill is primarily the excess of the purchase price paid over the carrying value of the
minority interest acquired in fiscal 1990 in TJX’s former 83%-owned subsidiary and represents goodwill associated
with the T.J. Maxx chain and is included in the Marmaxx segment at January 25, 2003. In addition, goodwill includes
the excess of cost over the estimated fair market value of the net assets of Winners acquired by TJX in fiscal 1991.
   Goodwill, net of amortization, totaled $71.5 million and $71.4 million as of January 25, 2003 and January 26,
2002, respectively, and had been amortized over 40 years on a straight-line basis through January 26, 2002. Annual
amortization of goodwill was $2.6 million in fiscal 2002 and 2001. There was no amortization of goodwill in fiscal
2003. Cumulative amortization as of January 25, 2003 and January 26, 2002 was $32.9 million.
   Tradename is the value assigned to the name “Marshalls” as a result of TJX’s acquisition of the Marshalls chain in
fiscal 1996. The value of the tradename was determined by the discounted present value of assumed after-tax royalty
payments, offset by a reduction for its pro-rata share of the total negative goodwill acquired. The final purchase price
allocated to the tradename amounted to $128.3 million. The tradename had been amortized over 40 years through
January 26, 2002. Annual amortization expense was $3.2 million in fiscal 2002 and 2001. There was no amortization
of tradename in fiscal 2003. Cumulative amortization as of January 25, 2003 and January 26, 2002 was $20.6 million.
   The Company acquires other tradenames of manufacturers to have marketing privileges for their products. Such
tradenames are included in other assets and are amortized to cost of sales, including buying and occupancy costs over
the term of the agreement generally from 7 to 10 years. The Company had $3.2 million and $569,000 in tradenames
at January 25, 2003 and January 26, 2002, respectively. Tradenames and the related amortization are included in the
related operating segment.
   In July 2001, the Financial Accounting Standards Board (“FASB”) issued SFAS No.142, “Goodwill and Other
Intangible Assets.” This Statement addresses how goodwill and other intangible assets should be accounted for after
they have been initially recognized in the financial statements. We implemented SFAS No.142 during our fiscal year
beginning January 27, 2002. As a result of the new standard, we no longer amortize goodwill or the value of the
Marshalls tradename which has an indefinite life. No impairments have been recorded on these assets to date.


                                                                23
T H E T J X C O M PA N I E S , I N C .


The following schedule presents pro forma income from continuing operations (unaudited) and pro forma net
income (unaudited) presented as if goodwill amortization and tradename amortization had not been included as an
expense in the prior periods:
                                                                                                       Fiscal Year Ended
                                                                                         January 25,      January 26,       January 27,
In Thousands Except Per Share Amounts                                                          2003              2002             2001

Reported income from continuing operations                                              $578,388       $540,397            $538,066
Add back: Goodwill amortization, net of related tax effects                                       -          2,607            2,609
Add back: Tradename amortization, net of related tax effects                                      -          1,910            1,910
Pro forma income from continuing operations                                             $578,388       $544,914            $542,585
Diluted earnings per share:
Reported income from continuing operations                                                 $1.08               $.97             $.93
Pro forma income from continuing operations                                                $1.08               $.98             $.94
Reported net income                                                                     $578,388       $500,397            $538,066
Add back: Goodwill amortization, net of related tax effects                                       -          2,607            2,609
Add back: Tradename amortization, net of related tax effects                                      -          1,910            1,910
Pro forma net income                                                                    $578,388       $504,914            $542,585
Diluted earnings per share:
Reported net income                                                                        $1.08               $.90             $.93
Pro forma net income                                                                       $1.08               $.91             $.94
Impairment of Long-Lived Assets: TJX periodically reviews the value of its property and intangible assets in relation
to the current and expected operating results of the related business segments in order to assess whether there has
been a permanent impairment of their carrying values. An impairment exists when the undiscounted cash flow of
an asset is less than the carrying cost of that asset. Store by store impairment analysis is performed, at a minimum,
on an annual basis. We recorded an impairment loss of $3.1 million in fiscal 2001 as a component of the
$6.3 million estimated cost of closing our three T.K. Maxx stores in the Netherlands.
Advertising Costs: TJX expenses advertising costs as incurred. Advertising expense was $135.3 million, $128.5 million
and $121.8 million for fiscal 2003, 2002 and 2001, respectively.
Earnings Per Share: All earnings per share amounts discussed refer to diluted earnings per share unless otherwise indi-
cated. All historical earnings per share amounts reflect the May 2002 two-for-one stock split.
Foreign Currency Translation and Related Hedging Activity: TJX’s foreign assets and liabilities are translated at the
fiscal year-end exchange rate. Activity of the foreign operations that affect the statements of income and cash flows
are translated at the average exchange rates prevailing during the fiscal year. A large portion of the net investments in
the foreign operations are hedged with foreign currency forward contracts and swap agreements. The translation
adjustments associated with the foreign operations and the related hedging instruments are included in shareholders’
equity as a component of accumulated other comprehensive income (loss). Cumulative foreign currency translation
adjustments, net of hedging activity, included in shareholders’ equity amounted to losses of $3.2 million and $2.9
million as of January 25, 2003 and January 26, 2002, respectively.
   Effective January 28, 2001, TJX implemented SFAS No.133, “Accounting for Derivative Instruments and Hedging
Activities.” This Statement, as amended, established accounting and reporting standards for derivative instruments,
including certain derivative instruments embedded in other contracts, and for hedging activities. This Statement
requires that an entity recognize all derivatives as either assets or liabilities in the statements of financial position and
measure those instruments at fair value. This Statement also requires that companies recognize adjustments to the fair
value of derivatives in earnings when they occur, if they do not qualify for hedge accounting. For derivatives that
qualify for hedge accounting, changes in the fair value of the derivatives can be recognized currently in earnings,
along with an offsetting adjustment against the basis of the underlying hedged item, or can be deferred in accumu-
lated other comprehensive income.


                                                                24
T H E T J X C O M PA N I E S , I N C .


   This Statement affects the accounting for TJX’s hedging contracts. As described in Note C, we periodically enter into
forward foreign currency exchange contracts to hedge certain merchandise purchase commitments, intercompany
balances, including intercompany debt, and net investment in and between foreign subsidiaries. Through
January 27, 2001, we applied hedge accounting to these contracts. Upon adoption of SFAS No.133, we prospectively
elected not to apply the hedge accounting rules to our merchandise purchase commitment and intercompany balance
(excluding intercompany debt) related contracts, even though these contracts effectively function as an economic
hedge of the underlying exposure. Thus, the changes in fair value of the merchandise purchase commitment and
intercompany balance (excluding intercompany debt) related contracts are reported in current earnings as a compo-
nent of selling, general and administrative expenses, with no offset for marking the underlying exposure to fair value.
We continue to apply hedge accounting to our net investment hedge contracts, and changes in fair value of these
contracts, as well as gains and losses upon settlement, are recorded in accumulated other comprehensive income,
offsetting changes in the cumulative foreign translation adjustments of our foreign divisions. We also apply hedge
accounting to intercompany debt hedge contracts. If we deem the intercompany debt to be indefinitely invested, the
hedge contracts are designated as net investment hedges and accounted for as described above. For all other inter-
company debt, the changes in fair value of the related contracts are recorded in the statement of income and offset
by marking the underlying item to fair value in the same period. Upon settlement, the realized gains and losses on
these contracts are offset by the realized gains and losses of the underlying item in the statement of income.
   At implementation of SFAS No.133, the fair value of all of TJX’s hedge contracts amounted to a net asset of
$10.0 million, most of which related to net investment hedge contracts. The carrying value of all hedge contracts
before adoption was $12.8 million. We also wrote off a net deferred asset of $1.2 million, related to premiums on
existing hedge contracts, and thus recorded a charge to accumulated other comprehensive income for the cumula-
tive effect of an accounting change of $1.6 million effective January 28, 2001.
New Accounting Standards: In June 2002, the FASB issued SFAS No.146, “Accounting for Costs Associated with Exit or
Disposal Activities.”This Statement addresses financial accounting and reporting for costs associated with exit or disposal
activities including store closing activities.The provisions of SFAS No.146 are effective for exit or disposal activities initi-
ated after December 31, 2002, with early adoption encouraged. Generally the effect of these provisions is to defer the
recording of certain store closing costs from the date we commit to close a store to the date the store actually closes.
The adoption of SFAS No.146 will not have a material impact on our financial position or results of operations.
   In December 2002, the FASB issued SFAS No.148, “Accounting for Stock-Based Compensation – Transition and
Disclosure.” This Statement amends SFAS No.123, “Accounting for Stock-Based Compensation,” and provides alter-
native methods of transition for entities that voluntarily convert to the fair value based method of accounting for
stock-based employee compensation and requires amended disclosure presentation for the fiscal year ending
January 25, 2003 and all subsequent interim periods. We anticipate that the FASB may issue additional guidance or
propose additional changes in this area. While we await additional FASB guidance we are continuing to account for
stock-based compensation in accordance with APB Opinion No.25.
   In November 2002, the FASB issued FASB Interpretation No. 45 “Guarantor’s Accounting and Disclosure Require-
ments for Guarantees, Including Indirect Guarantees of Indebtedness of Others.” This Interpretation specifies certain
disclosures for guarantees issued by an entity and requires recognition and measurement at fair value for certain types
of guarantees. We have included the disclosure requirements of the interpretation with regard to guarantees made by
TJX in Note L. The recognition and measurement provisions, which we believe will not have a material effect on our
financial position or results of operation, are effective for qualifying guarantees issued after December 31, 2002.
Reclassifications: We have reclassified certain amounts in prior years’ financial statements for comparative purposes.
Major reclassifications include the separate presentation of federal and state income taxes payable on the balance
sheets and statements of cash flow and a more detailed presentation of unearned stock compensation within the
statements of shareholders’ equity.
   None of the reclassifications had any impact on net income, current liabilities or total shareholders’ equity as
previously reported.


                                                                  25
T H E T J X C O M PA N I E S , I N C .


B. LONG-TERM DEBT AND CREDIT LINES
The table below presents long-term debt, exclusive of current installments, as of January 25, 2003 and January 26,
2002. Capital lease obligations are separately presented in Note D.
                                                                                                 January 25,       January 26,
In Thousands                                                                                           2003              2002
General corporate debt:
  Medium term notes, interest at 5.87% on $15,000 maturing
    October 21, 2003                                                                         $            -      $ 15,000
  Medium term notes, interest at 7.97% on $5,000 maturing
    September 20, 2004                                                                              5,000            5,000
  7% unsecured notes, maturing June 15, 2005 (effective interest rate of
    7.02% after reduction of the unamortized debt discount of $33
    and $47 in fiscal 2003 and 2002, respectively)                                                99,967            99,953
  7.45% unsecured notes, maturing December 15, 2009 (effective interest
    rate of 7.50% after reduction of unamortized debt discount of
    $439 and $503 in fiscal 2003 and 2002, respectively)                                      199,561             199,497
  Total general corporate debt                                                                304,528             319,450
Subordinated debt:
  Zero coupon convertible subordinated notes due February 13, 2021,
    after reduction of unamortized debt discount of $157,252 and $164,907
    in fiscal 2003 and 2002, respectively                                                     360,248             352,593
  Total subordinated debt                                                                     360,248             352,593
Long-term debt, exclusive of current installments                                            $664,776            $672,043

  The aggregate maturities of long-term debt, exclusive of current installments at January 25, 2003 are as follows:

In Thousands                                                                                                   Long-Term Debt
Fiscal Year
2005                                                                                                             $365,248
2006                                                                                                               99,967
2007                                                                                                                    -
2008                                                                                                                    -
Later years                                                                                                       199,561
Aggregate maturities of long-term debt, exclusive of current installments                                        $664,776
The above maturity table assumes that all holders of the zero coupon convertible subordinated notes exercise their put
options in fiscal 2005. The note holders also have put options available to them in fiscal 2008 and 2014. If none of the
put options are exercised and the notes are not redeemed or converted, the notes will mature in fiscal 2022.
   In February 2001, TJX issued $517.5 million zero coupon convertible subordinated notes due in February 2021
and raised gross proceeds of $347.6 million. The issue price of the notes represents a yield to maturity of 2% per
year. Due to provisions of the first put option on February 13, 2002, we amortized the debt discount assuming a
1.5% yield for fiscal 2002.The notes are subordinated to all existing and future senior indebtedness of TJX.The notes
are convertible into 16.9 million shares of common stock of TJX if the sale price of our common stock reaches spec-
ified thresholds, if the credit rating of the notes is below investment grade, if the notes are called for redemption or
if certain specified corporate transactions occur. The holders of the notes have the right to require us to purchase the
notes for $369.0 million, $391.7 million and $441.3 million on February 13, 2004, 2007 and 2013, respectively.
The repurchase amounts represent original purchase price plus accrued original issue discount. We may pay the
purchase price in cash, TJX stock, or a combination of the two. If the holders exercise their put options, we expect
to fund the payment with cash, financing from our short-term credit facility, new long-term borrowings or a combi-
nation thereof. At the first put date of February 13, 2002, no holder exercised the put option. In addition, if a change
in control of TJX occurs on or before February 13, 2007, each holder may require TJX to purchase for cash all or a
portion of such holder’s notes. We may redeem for cash all, or a portion of, the notes at any time on or after February
13, 2007 for the original purchase price plus accrued original issue discount. We used the proceeds for our acceler-
ated store roll-out program, investment in our distribution center network, our common stock repurchase program
and general corporate purposes.


                                                               26
T H E T J X C O M PA N I E S , I N C .


   In December 1999, TJX issued $200 million of 7.45% ten-year notes. The proceeds were used for general
corporate purposes, including our ongoing stock repurchase program.
   TJX periodically enters into financial instruments to manage our cost of borrowing. TJX entered into a rate-lock
agreement to hedge the underlying treasury rate of the $200 million ten-year notes, prior to their issuance in
December 1999. The cost of this agreement has been deferred and is being amortized to interest expense over the
term of the notes and results in an effective rate of 7.60% on the debt.
   During fiscal 2003, we entered into a $370 million five-year revolving credit facility and a $320 million 364-day
revolving credit facility, replacing similar agreements scheduled to expire during fiscal 2003. On March 24, 2003,
the 364-day agreement was renewed and increased to $330 million, with substantially all of the other terms and
conditions of the original facility remaining unchanged. Our ability to borrow under the agreements is not limited
by our debt rating level. The credit facilities do not require any compensating balances however, TJX must maintain
certain leverage and fixed charge coverage ratios. Based on our current financial condition, we believe that the possi-
bility of non-compliance with these covenants is remote. The revolving credit facilities are used as backup to our
commercial paper program. As of January 25, 2003, all $690 million of the revolving credit facilities were available
for use. Interest is payable on borrowings at rates equal to or less than prime. There were no short-term borrowings
during fiscal 2003. The maximum amount of our U.S. short-term borrowings was $39 million and $330 million in
fiscal 2002 and 2001, respectively. The weighted average interest rate on our U.S. short-term borrowings was 5.32%
and 6.82% in fiscal 2002 and 2001, respectively.
   As of January 25, 2003, TJX had credit lines totaling C$40 million for its Canadian subsidiary. The maximum
amount outstanding under our Canadian credit lines was C$19.2 million in fiscal 2003, C$22.6 million in fiscal
2002 and C$15.2 million in fiscal 2001. Subsequent to the end of fiscal 2003, our Canadian credit lines were
reduced to C$20 million.
C. FINANCIAL INSTRUMENTS
Effective January 28, 2001, TJX implemented Statement of Financial Accounting Standards (“SFAS”) No.133,
“Accounting for Derivative Instruments and Hedging Activities.” This Statement requires that all derivatives be
recorded on the balance sheets at fair value. See Note A for a description of TJX’s foreign currency translation and
related hedging activity policy.
   TJX periodically enters into forward foreign currency exchange contracts to obtain an economic hedge on firm U.S.
dollar and Euro merchandise purchase commitments made by its foreign subsidiaries. These commitments are typi-
cally six months or less in duration. The contracts outstanding at January 25, 2003, cover certain commitments for the
first and second quarters of fiscal 2004. TJX elected not to apply hedge accounting rules to these contracts and there-
fore includes the change in the fair value of these contracts in earnings as a component of selling, general and
administrative expenses.The change in the fair value of these contracts resulted in expense of $2.6 million and income
of $855,000 in fiscal 2003 and 2002, respectively.
   TJX enters forward foreign currency exchange contracts to obtain an economic hedge on certain foreign intercom-
pany payables, primarily license fees, for which we elected not to apply hedge accounting rules. Such contracts
outstanding at January 25, 2003, cover intercompany payables for the first quarter of fiscal 2004. The change in fair
value of these contracts resulted in expense of $1 million in fiscal 2003 and income of $167,000 in fiscal 2002 which
is reflected in the related periods’ earnings as a component of selling, general and administrative expenses.
   TJX also enters into foreign currency forward and swap contracts in both Canadian dollars and British pound ster-
ling and accounts for them as a hedge of the investment in and between our foreign subsidiaries. Foreign exchange
gains and losses as well as fair value adjustments on the agreements are recognized in other comprehensive income,
thereby offsetting translation adjustments associated with our investment in and between our foreign subsidiaries.
   The change in fair value of the contracts designated as a hedge of the net investment in foreign operations resulted
in a loss of $23.2 million that was included in other comprehensive income in fiscal 2003 and a gain of $8.2 million
in other comprehensive income in fiscal 2002. The change in the cumulative foreign currency translation adjustment
resulted in a gain of $23.0 million and a loss of $8.2 million that was also included as a component of other compre-
hensive income in fiscal 2003 and 2002, respectively.
   TJX also enters derivative contracts, designated as fair value hedges, to hedge certain foreign intercompany
payables, primarily debt and related interest. The net impact of hedging activity related to these intercompany
payables resulted in losses of $954,000 and $429,000 in fiscal 2003 and 2002, respectively, which is reflected in
earnings as a component of selling, general and administrative expenses.


                                                               27
T H E T J X C O M PA N I E S , I N C .


  Following is a summary of TJX’s derivative financial instruments and related fair values, outstanding at
January 25, 2003:
                                                                                                              Blended         Fair Value
                                                                                                              Contract             Asset
In Thousands                                                                       Pay          Receive           Rate         (Liability)
Fair value hedges:
  Intercompany balances, primarily debt
     and related interest                                               £ 19,000         U.S.$ 30,024         1.5802 U.S.$       (807)
Net asset hedges:                                                     C$388,962 U.S.$247,725                  0.6369 U.S.$ (5,664)
                                                                       £ 91,000   C$225,817                   2.4815 U.S.$ (1,567)
Hedge accounting not elected:
 Merchandise purchase commitments
   and intercompany balances, primarily
   license fees                                                       C$ 94,696          U.S.$ 60,259         0.6363 U.S.$ (1,945)
                                                                       £ 10,331          U.S.$ 15,910         1.5400 U.S.$ (916)
                                                                                             € 12,360
                                                                       £ 8,087                                1.5284 U.S.$    187
Net fair value (liability)                                                                                           U.S.$(10,712)
The fair value of the derivatives is classified as assets or liabilities, current or non-current, based upon valuation
results and settlement dates of the individual contracts. Following are the balance sheet classifications of the fair value
of our derivatives:

                                                                                                           January 25,       January 26,
In Thousands                                                                                                     2003              2002
Current assets                                                                                            $     197      $ 9,493
Non-current assets                                                                                              415        2,865
Current (liabilities)                                                                                         (3,871)             (92)
Non-current (liabilities)                                                                                     (7,453)             (34)

Net fair value (liability) asset                                                                          $(10,712)      $12,232
TJX’s forward foreign currency exchange and swap contracts require us to make payments of certain foreign curren-
cies for receipt of U.S. dollars, Canadian dollars or Euros. All of these contracts except the net asset hedges mature
during fiscal 2004. The British pound net asset hedge matures during fiscal 2009; the Canadian dollar net asset
hedges have maturities from fiscal 2004 to fiscal 2010.
   The counterparties to the forward exchange contracts and swap agreements are major international financial insti-
tutions and the contracts contain rights of offset, which minimize our exposure to credit loss in the event of
nonperformance by one of the counterparties. We do not require counterparties to maintain collateral for these
contracts. We periodically monitor our position and the credit ratings of the counterparties and do not anticipate
losses resulting from the nonperformance of these institutions.
   The fair value of our general corporate debt, including current installments, is estimated using discounted cash
flow analysis based upon our current incremental borrowing rates for similar types of borrowing arrangements. The
fair value of our zero coupon convertible subordinated notes is estimated by obtaining market quotes. The fair value
of general corporate debt, including current installments, at January 25, 2003 is $363.9 million versus a carrying
value of $319.5 million. The fair value of the zero coupon convertible subordinated notes is $423.7 million versus
a carrying value of $360.2 million. These estimates do not necessarily reflect certain provisions or restrictions in the
various debt agreements which might affect our ability to settle these obligations.
D. C O M M I T M E N T S
TJX is committed under long-term leases related to its continuing operations for the rental of real estate and fixtures
and equipment. Most of our leases are store operating leases with a ten-year initial term and options to extend for one
or more five-year periods. Certain Marshalls leases, acquired in fiscal 1996, had remaining terms ranging up to twenty-
five years. Leases for T.K. Maxx are generally for fifteen to twenty-five years with ten-year kick-out options. Many of the
leases contain escalation clauses and early termination penalties. In addition, we are generally required to pay insurance,
real estate taxes and other operating expenses including, in some cases, rentals based on a percentage of sales.


                                                                28
T H E T J X C O M PA N I E S , I N C .


  Following is a schedule of future minimum lease payments for continuing operations as of January 25, 2003:
                                                                                                                      Capital         Operating
In Thousands                                                                                                           Lease             Leases
Fiscal Year
2004                                                                                                               $ 3,726 $ 536,860
2005                                                                                                                 3,726    514,755
2006                                                                                                                 3,726    469,822
2007                                                                                                                 3,726    425,937
2008                                                                                                                 3,726    381,383
Later years                                                                                                         30,397  1,625,522
Total future minimum lease payments                                                                                 49,027 $3,954,279
Less amount representing interest                                                                                   18,691
Net present value of minimum capital lease payments                                                                $30,336
The capital lease commitment relates to a 283,000-square-foot addition to TJX’s home office facility. Rental payments
commenced June 1, 2001, and we recognized a capital lease asset and related obligation equal to the present value
of the lease payments of $32.6 million.
  Rental expense under operating leases for continuing operations amounted to $524.7 million, $446.6 million and
$390.6 million for fiscal 2003, 2002 and 2001, respectively. Rental expense includes contingent rent and is reported
net of sublease income. Contingent rent was $8.2 million, $6.8 million and $7.0 million in fiscal 2003, 2002 and
2001, respectively; and sublease income was $3.2 million, $3.7 million and $4.2 million in fiscal 2003, 2002 and
2001, respectively. The total net present value of TJX’s minimum operating lease obligations approximates
$2,947.0 million as of January 25, 2003, including a current portion of $348.5 million.
  TJX had outstanding letters of credit totaling $44.6 million as of January 25, 2003 and $23.9 million as of January
26, 2002. Letters of credit are issued by TJX primarily for the purchase of inventory.
E . S T O C K C O M P E N S AT I O N P L A N S
In the following note, all references to historical awards, outstanding awards and availability of shares for future
grants under TJX’s Stock Incentive Plan and related prices per share have been restated, for comparability purposes,
to reflect the two-for-one stock split distributed in May 2002.
  TJX has a stock incentive plan under which options and other stock awards may be granted to its directors, offi-
cers and key employees. This plan has been approved by TJX’s shareholders and all stock compensation awards are
made under this plan. The Stock Incentive Plan, as amended with shareholder approval, provides for the issuance of
up to 109.3 million shares with 21.0 million shares available for future grants as of January 25, 2003. In June 2001,
shareholders approved an amendment to the Stock Incentive Plan to permit grants to directors and the Board termi-
nated the former Directors’ Stock Option Plan.
  Under the Stock Incentive Plan, TJX has granted options for the purchase of common stock, generally within ten
years from the grant date at option prices of 100% of market price on the grant date. Most options outstanding vest
over a three-year period starting one year after the grant, and are exercisable in their entirety three years after the
grant date. Outstanding options granted to directors become fully exercisable one year after the date of grant.
  A summary of the status of TJX’s stock options and related Weighted Average Exercise Prices (“WAEP”) is presented
below (shares in thousands):
                                                                                              Fiscal Year Ended
                                                             January 25, 2003                   January 26, 2002               January 27, 2001
                                                         Shares         WAEP                Shares          WAEP           Shares         WAEP
Outstanding at beginning of year                      29,624           $13.10             28,073      $ 9.84           23,664        $ 8.53
Granted                                               11,395            19.85             10,743        17.48          10,356         10.37
Exercised                                             (2,970)           10.94             (8,432)        7.97          (5,449)         4.92
Forfeitures                                             (853)           15.85               (760)       12.27            (498)        12.29
Outstanding at end of year                            37,196            15.28             29,624        13.10          28,073          9.84
Options exercisable at end of year                    16,265           $12.12             11,594      $ 10.20          11,760        $ 7.99
TJX realizes an income tax benefit from restricted stock vesting and the exercise of stock options, which results in a
decrease in current income taxes payable and an increase in additional paid-in capital. Such benefits amounted to
$11.8 million, $30.6 million and $15.9 million for fiscal 2003, 2002 and 2001, respectively.


                                                                  29
T H E T J X C O M PA N I E S , I N C .


  TJX has adopted the disclosure-only provisions of Statement of Financial Accounting Standards (“SFAS”) No.123,
“Accounting for Stock-Based Compensation,” and continues to apply the provisions of Accounting Principles Board
Opinion No.25, “Accounting for Stock Issued to Employees,” in accounting for compensation expense under its stock
option plans. We grant options at fair market value on the date of the grant; accordingly, no compensation expense
has been recognized for the stock options issued during fiscal 2003, 2002 or 2001. Compensation expense deter-
mined in accordance with SFAS No.123, net of related income tax effect, would have amounted to
$39.7 million, $27.8 million and $19.2 million for fiscal 2003, 2002 and 2001, respectively.
  Presented below are the unaudited pro forma income from continuing operations, net income and related earn-
ings per share showing the effect that stock compensation expenses, determined in accordance with SFAS No.123,
would have on reported results.
                                                                                                     Fiscal Year Ended
                                                                                       January 25,       January 26,     January 27,
In Thousands Except Per Share Amounts                                                        2003               2002           2001
Income from continuing operations, as reported                                        $578,388       $540,397 $538,066
Add: Stock-based employee compensation expense
  included in reported income from continuing
  operations,net of related tax effects                                                   1,973            1,651              883
Deduct: Total stock-based employee compensation
  expense determined under fair value based
  method for all awards, net of related tax effects                                    (41,699)         (29,450)         (20,112)
Pro forma income from continuing operations                                           $538,662       $512,598 $518,837
Earnings per share:
 Basic – as reported                                                                      $1.09              $.98            $.94
 Basic – pro forma                                                                        $1.01              $.93            $.90

 Diluted – as reported                                                                    $1.08              $.97            $.93
 Diluted – pro forma                                                                      $1.00              $.92            $.90
Net income, as reported                                                               $578,388        $500,397 $538,066
Add: Stock-based employee compensation expense
  included in reported net income, net of related tax effects                             1,973            1,651              883
Deduct: Total stock-based employee compensation
  expense determined under fair value based
  method for all awards, net of related tax effects                                    (41,699)         (29,450)         (20,112)
Pro forma net income                                                                  $538,662       $472,598 $518,837
Earnings per share:
 Basic – as reported                                                                      $1.09              $.91            $.94
 Basic – pro forma                                                                        $1.01              $.86            $.90
 Diluted – as reported                                                                    $1.08              $.90            $.93
 Diluted – pro forma                                                                      $1.00              $.85            $.90
For purposes of applying the provisions of SFAS No. 123 for the pro forma calculations, the fair value of each option
granted during fiscal 2003, 2002 and 2001 is estimated on the date of grant using the Black-Scholes option pricing
model with the following assumptions: dividend yield of .5% in fiscal 2003 and 2002, and 1% in fiscal 2001; expected
volatility of 44%, 46% and 48% in fiscal 2003, 2002 and 2001, respectively; a risk-free interest rate of 3.5% in fiscal
2003, 5.0% in fiscal 2002 and 5.2% in fiscal 2001; and expected holding period of six years in all fiscal periods. The
weighted average fair value of options granted during fiscal 2003, 2002 and 2001 was $8.93, $8.46 and $5.04 per
share, respectively.


                                                              30
T H E T J X C O M PA N I E S , I N C .


  The following table summarizes information about stock options outstanding as of January 25, 2003 (shares
in thousands):
                                                                                           Options Outstanding               Options Exercisable
                                                                                                Weighted       Weighted                 Weighted
                                                                                                  Average       Average                   Average
Range of                                                                                       Remaining        Exercise                 Exercise
Exercise Prices                                                                     Shares   Contract Life         Price     Shares          Price
$ 1.6094 - $ 3.1563                                                                547             1.9 years   $ 2.30         547       $ 2.30
$ 3.1564 - $ 5.3438                                                              1,508             3.9 years     5.01       1,508         5.01
$ 5.3439 - $ 7.2344                                                                803             4.6 years     7.22         803         7.22
$ 7.2345 - $10.8750                                                              8,620             7.2 years    10.47       5,623        10.52
$10.8751 - $15.2500                                                              4,439             6.6 years    14.62       4,439        14.62
$15.2501 - $19.8500                                                             21,279             9.1 years    18.73       3,345        17.48
  Total                                                                         37,196             8.0 years   $15.28      16,265       $12.12
We modified option grants of our associates lost in the tragedy of September 11, 2001. Unvested awards were vested,
and the families were allowed to realize the full economic benefit of the original grants and we provided other bene-
fits to the families. During fiscal 2002, we recorded additional compensation expense related to these option
modifications and benefits. We do not typically modify awards after the date of grant.
   TJX has also issued restricted stock and performance-based stock awards under the Stock Incentive Plan. Restricted
stock awards are issued at par value, or at no cost, and have restrictions that generally lapse over three to four years
from date of grant. Performance-based shares have restrictions that generally lapse over one to four years when and if
specified criteria are met.The market value in excess of cost is charged to income ratably over the period during which
these awards vest. Such pre-tax charges amounted to $3.2 million, $2.7 million and $1.4 million in fiscal 2003, 2002
and 2001, respectively. The market value of the awards is determined at date of grant for restricted stock awards, and
at the date shares are earned for performance-based awards.
   A combined total of 325,000 shares, 450,000 shares and 20,000 shares for restricted and performance-based awards
were issued in fiscal 2003, 2002 and 2001, respectively. There were 66,000 shares forfeited during fiscal 2001; no
shares were forfeited during fiscal 2003 or 2002. The weighted average market value per share of these stock awards at
grant date was $19.85, $15.00 and $10.38 for fiscal 2003, 2002 and 2001, respectively.
   TJX maintained a separate deferred stock compensation plan for its outside directors under which deferred share
awards valued at $10,000 each were issued annually to outside directors. During fiscal 2003, the Board merged this
deferred stock compensation plan into the Stock Incentive Plan, and all deferred shares earned will be issued pursuant
to the Stock Incentive Plan. Beginning in June 2003, the annual deferred share award granted to each outside director
will be valued at $30,000. As of the end of fiscal 2003, a total of 45,793 deferred shares had been granted under the
plan. Actual shares will be issued at termination of service or a change of control. Prior to merging the deferred stock
award plan into the Stock Incentive Plan, TJX planned to issue actual shares from shares held in treasury. Currently we
have 175,276 shares held in treasury.
F. C A P I TA L S T O C K A N D E A R N I N G S P E R S H A R E
Capital Stock: TJX distributed a two-for-one stock split, effected in the form of a 100% stock dividend, on
May 8, 2002 to shareholders of record on April 25, 2002, which resulted in the issuance of 269.4 million shares of
common stock and a corresponding decrease of $269.4 million in retained earnings. All historical earnings per share
amounts and reference to common stock activity in the notes have been restated to reflect the two-for-one stock split.
   During fiscal 2003, we completed our $1 billion stock repurchase program begun in fiscal 2001 and initiated
another multi-year $1 billion stock repurchase program. We had cash expenditures under all of our repurchase
programs of $481.7 million, $424.2 million and $444.1 million in fiscal 2003, 2002 and 2001, respectively, funded
primarily by cash generated from operations. The total common shares repurchased amounted to 25.9 million shares
in fiscal 2003, 26.3 million shares in fiscal 2002 and 44.5 million shares in fiscal 2001. As of January 25, 2003, we
had repurchased 16.1 million shares of our common stock at a cost of $303.4 million under the current $1 billion
stock repurchase program. All shares repurchased have been retired except 87,638 shares purchased in fiscal 2003
and held in treasury.
   TJX has authorization to issue up to 5 million shares of preferred stock, par value $1. There was no preferred stock
issued or outstanding at January 25, 2003.


                                                                           31
T H E T J X C O M PA N I E S , I N C .


  Earnings Per Share: The following schedule presents the calculation of basic and diluted earnings per share for
income from continuing operations:
                                                                                                        Fiscal Year Ended
                                                                                          January 25,      January 26,       January 27,
Amounts In Thousands Except Per Share Amounts                                                   2003              2002             2001
Basic earnings per share:
  Income from continuing operations                                                      $578,388       $540,397 $538,066
  Weighted average common stock outstanding
    for basic earnings per share calculation                                              532,241         550,647            574,881
  Basic earnings per share                                                                  $1.09            $.98               $.94
Diluted earnings per share:
  Income from continuing operations                                                      $578,388       $540,397 $538,066
  Weighted average common stock outstanding
    for basic earnings per share calculation                                              532,241         550,647            574,881
  Assumed exercise of stock options and awards                                              5,499           5,621              3,511
  Weighted average common shares for diluted
    earnings per share calculation                                                        537,740         556,268            578,392
  Diluted earnings per share                                                                $1.08            $.97               $.93
The weighted average common shares for the diluted earnings per share calculation exclude the incremental effect
related to outstanding stock options, the exercise price of which is in excess of the related fiscal year’s average price
of TJX’s common stock. Such options are excluded because they would have an antidilutive effect. These options
amounted to 11.2 million as of January 25, 2003, 10.6 million as of January 26, 2002 and 9.2 million as of
January 27, 2001. The 16.9 million shares issuable upon conversion of the zero coupon convertible debt were also
excluded from the diluted earnings per share calculation because criteria for conversion had not been met during
the fiscal years presented.
G . I N C O M E TA X E S
The provision for income taxes includes the following:
                                                                                                        Fiscal Year Ended
                                                                                          January 25,      January 26,       January 27,
In Thousands                                                                                    2003              2002             2001
Current:
  Federal                                                                                $218,857 $236,070                  $272,075
  State                                                                                    47,894   44,228                    51,217
  Foreign                                                                                  20,758   18,119                    27,819
Deferred:
  Federal                                                                                  57,125          28,133            (22,359)
  State                                                                                     5,558           4,071             (2,269)
  Foreign                                                                                   9,144           3,026                393
Provision for income taxes                                                               $359,336       $333,647            $326,876
In addition to the above provision, in fiscal 2002 TJX also recorded deferred income tax benefits of $26.5 million as
a component of a $40 million after-tax charge relating to discontinued operations.


                                                                 32
T H E T J X C O M PA N I E S , I N C .


  TJX had a net deferred tax (liability) asset as follows:
                                                                                                       January 25,        January 26,
In Thousands                                                                                                 2003               2002
Deferred tax assets:
  Foreign net operating loss carryforward                                                            $ 13,108            $ 14,546
  Reserve for discontinued operations                                                                  21,617              35,277
  Reserve for closed store and restructuring costs                                                      4,712               5,824
  Pension, postretirement and employee benefits                                                        31,001              34,493
  Leases                                                                                               22,591              21,076
  Other                                                                                                37,307              29,591
    Total deferred tax assets                                                                         130,336             140,807
Deferred tax liabilities:
  Property, plant and equipment                                                                        62,189    21,143
  Safe harbor leases                                                                                   12,683    13,395
  Tradename                                                                                            42,873    42,873
  Undistributed foreign earnings                                                                       12,809         -
  Other                                                                                                32,790    24,818
    Total deferred tax liabilities                                                                    163,344   102,229
Net deferred tax (liability) asset                                                                   $(33,008) $ 38,578
The fiscal 2003 total net deferred tax liability is presented on the balance sheet as a current asset of $9.0 million and
a non-current liability of $42.0 million. For fiscal 2002, the net deferred tax asset is presented on the balance sheet
as a current asset of $12.0 million and a non-current asset of $26.6 million. TJX has provided for deferred U.S. taxes
on all undistributed Canadian earnings. All earnings of TJX’s other foreign subsidiaries are indefinitely reinvested and
no deferred taxes have been provided for on those earnings.
   TJX has a United Kingdom operating loss carryforward of approximately $43.7 million that may be applied against
future taxable income in the U.K., all of which has been recognized for financial reporting purposes. The U.K. net
operating loss does not expire under current tax law. In fiscal 2003 TJX utilized a Puerto Rico net operating loss carry-
forward of approximately $1 million which was acquired in the Marshalls acquisition. No Puerto Rico net operating
loss carryforward exists as of January 25, 2003.
   TJX’s worldwide effective income tax rate was 38.3% for fiscal 2003, 38.2% for fiscal 2002, and 37.8% for fiscal
2001. The difference between the U.S. federal statutory income tax rate and TJX’s worldwide effective income tax rate
is reconciled below:
                                                                                                     Fiscal Year Ended
                                                                                       January 25,     January 26,        January 27,
                                                                                             2003             2002              2001
U.S. federal statutory income tax rate                                                     35.0%            35.0%             35.0%
Effective state income tax rate                                                             4.1              3.8               4.0
Impact of foreign operations                                                                (.3)             (.4)             (1.0)
All other                                                                                   (.5)             (.2)              (.2)
Worldwide effective income tax rate                                                        38.3%            38.2%             37.8%
The additional benefit reflected in “all other” in fiscal 2003 is due to the favorable effect of the tax benefit for payment
of executive retirement benefits in exchange for the termination of split-dollar arrangements described in Note H.
H. PENSION PLANS AND OTHER RETIREMENT BENEFITS
Pension: TJX has a funded defined benefit retirement plan covering the majority of its full-time U.S. employees.
Employees who have attained twenty-one years of age and have completed one year of service are covered under the
plan. No employee contributions are required and benefits are based on compensation earned in each year of service.
We also have an unfunded supplemental retirement plan which covers key employees of the Company and provides
additional retirement benefits based on average compensation. Our funded defined benefit retirement plan assets are
invested primarily in stock and bonds of U.S. corporations, excluding TJX, as well as various investment funds.


                                                               33
tjx Annual Reports2002

Mais conteúdo relacionado

Mais procurados

Jörg Mayer: Food price volatility - assessing potential market impacts
Jörg Mayer: Food price volatility - assessing potential market impactsJörg Mayer: Food price volatility - assessing potential market impacts
Jörg Mayer: Food price volatility - assessing potential market impactsfutureagricultures
 
Deutsche EuroShop | Company Presentation | 09/11
Deutsche EuroShop | Company Presentation | 09/11Deutsche EuroShop | Company Presentation | 09/11
Deutsche EuroShop | Company Presentation | 09/11Deutsche EuroShop AG
 
Deutsche EuroShop | Company Presentation | 08/11
Deutsche EuroShop | Company Presentation | 08/11Deutsche EuroShop | Company Presentation | 08/11
Deutsche EuroShop | Company Presentation | 08/11Deutsche EuroShop AG
 
Deutsche EuroShop | Company Presentation | 07/11
Deutsche EuroShop | Company Presentation | 07/11Deutsche EuroShop | Company Presentation | 07/11
Deutsche EuroShop | Company Presentation | 07/11Deutsche EuroShop AG
 
tax.state.nv.us documents utreturn_20040401
tax.state.nv.us documents  utreturn_20040401tax.state.nv.us documents  utreturn_20040401
tax.state.nv.us documents utreturn_20040401taxman taxman
 
fiserv annual reports 2003
fiserv annual reports 2003fiserv annual reports 2003
fiserv annual reports 2003finance47
 
Flevy.com - Paycheck Stub Template
Flevy.com - Paycheck Stub TemplateFlevy.com - Paycheck Stub Template
Flevy.com - Paycheck Stub TemplateDavid Tracy
 
tax.state.nv.us documents utreturn_20031001
tax.state.nv.us documents  utreturn_20031001tax.state.nv.us documents  utreturn_20031001
tax.state.nv.us documents utreturn_20031001taxman taxman
 
tax.state.nv.us documents utreturn_20030701
tax.state.nv.us documents  utreturn_20030701tax.state.nv.us documents  utreturn_20030701
tax.state.nv.us documents utreturn_20030701taxman taxman
 
Fanuc Ot Cnc Training Manual
Fanuc Ot Cnc Training ManualFanuc Ot Cnc Training Manual
Fanuc Ot Cnc Training Manualout2thow
 
tax.state.nv.us documents utreturn
tax.state.nv.us documents  utreturntax.state.nv.us documents  utreturn
tax.state.nv.us documents utreturntaxman taxman
 
Stormwater Financing Mechanisms- Charlotte Katzenmoyer
Stormwater Financing Mechanisms- Charlotte KatzenmoyerStormwater Financing Mechanisms- Charlotte Katzenmoyer
Stormwater Financing Mechanisms- Charlotte KatzenmoyerCleanH2O
 
Budget Forecast Project
Budget Forecast ProjectBudget Forecast Project
Budget Forecast Projectdavisdemers
 
143. Belmont Stakes
143. Belmont Stakes143. Belmont Stakes
143. Belmont Stakesracingportal
 

Mais procurados (19)

Jörg Mayer: Food price volatility - assessing potential market impacts
Jörg Mayer: Food price volatility - assessing potential market impactsJörg Mayer: Food price volatility - assessing potential market impacts
Jörg Mayer: Food price volatility - assessing potential market impacts
 
Deutsche EuroShop | Company Presentation | 09/11
Deutsche EuroShop | Company Presentation | 09/11Deutsche EuroShop | Company Presentation | 09/11
Deutsche EuroShop | Company Presentation | 09/11
 
Deutsche EuroShop | Company Presentation | 08/11
Deutsche EuroShop | Company Presentation | 08/11Deutsche EuroShop | Company Presentation | 08/11
Deutsche EuroShop | Company Presentation | 08/11
 
Deutsche EuroShop | Company Presentation | 07/11
Deutsche EuroShop | Company Presentation | 07/11Deutsche EuroShop | Company Presentation | 07/11
Deutsche EuroShop | Company Presentation | 07/11
 
tax.state.nv.us documents utreturn_20040401
tax.state.nv.us documents  utreturn_20040401tax.state.nv.us documents  utreturn_20040401
tax.state.nv.us documents utreturn_20040401
 
fiserv annual reports 2003
fiserv annual reports 2003fiserv annual reports 2003
fiserv annual reports 2003
 
Annuity graph
Annuity graphAnnuity graph
Annuity graph
 
Flevy.com - Paycheck Stub Template
Flevy.com - Paycheck Stub TemplateFlevy.com - Paycheck Stub Template
Flevy.com - Paycheck Stub Template
 
tax.state.nv.us documents utreturn_20031001
tax.state.nv.us documents  utreturn_20031001tax.state.nv.us documents  utreturn_20031001
tax.state.nv.us documents utreturn_20031001
 
tax.state.nv.us documents utreturn_20030701
tax.state.nv.us documents  utreturn_20030701tax.state.nv.us documents  utreturn_20030701
tax.state.nv.us documents utreturn_20030701
 
Fanuc Ot Cnc Training Manual
Fanuc Ot Cnc Training ManualFanuc Ot Cnc Training Manual
Fanuc Ot Cnc Training Manual
 
Geraldo Martha Presentation at the Food Security Futures I Conference
Geraldo Martha Presentation at the Food Security Futures I ConferenceGeraldo Martha Presentation at the Food Security Futures I Conference
Geraldo Martha Presentation at the Food Security Futures I Conference
 
tax.state.nv.us documents utreturn
tax.state.nv.us documents  utreturntax.state.nv.us documents  utreturn
tax.state.nv.us documents utreturn
 
Telephone 5 months dead
Telephone 5 months deadTelephone 5 months dead
Telephone 5 months dead
 
Stormwater Financing Mechanisms- Charlotte Katzenmoyer
Stormwater Financing Mechanisms- Charlotte KatzenmoyerStormwater Financing Mechanisms- Charlotte Katzenmoyer
Stormwater Financing Mechanisms- Charlotte Katzenmoyer
 
Budget Forecast Project
Budget Forecast ProjectBudget Forecast Project
Budget Forecast Project
 
143. Belmont Stakes
143. Belmont Stakes143. Belmont Stakes
143. Belmont Stakes
 
The Woodlands Real Estate
The Woodlands Real EstateThe Woodlands Real Estate
The Woodlands Real Estate
 
Tulare County 2011 Economic Forecast
Tulare County 2011 Economic ForecastTulare County 2011 Economic Forecast
Tulare County 2011 Economic Forecast
 

Destaque

1997ann_fin auto nation
1997ann_fin auto nation1997ann_fin auto nation
1997ann_fin auto nationfinance14
 
AR06 express scripts
AR06 express scripts AR06 express scripts
AR06 express scripts finance14
 
2007ProxyStatement auto nation
2007ProxyStatement auto nation2007ProxyStatement auto nation
2007ProxyStatement auto nationfinance14
 
Murphy Oil Corporation's 2008 Proxy Statement
	Murphy Oil Corporation's 2008 Proxy Statement 	Murphy Oil Corporation's 2008 Proxy Statement
Murphy Oil Corporation's 2008 Proxy Statement finance14
 
1998_Financial_Discussion auto nation
1998_Financial_Discussion auto nation1998_Financial_Discussion auto nation
1998_Financial_Discussion auto nationfinance14
 
loews 10Q_3Q08
loews 10Q_3Q08loews 10Q_3Q08
loews 10Q_3Q08finance14
 
kimberly clark AR 05
kimberly clark AR 05kimberly clark AR 05
kimberly clark AR 05finance14
 

Destaque (7)

1997ann_fin auto nation
1997ann_fin auto nation1997ann_fin auto nation
1997ann_fin auto nation
 
AR06 express scripts
AR06 express scripts AR06 express scripts
AR06 express scripts
 
2007ProxyStatement auto nation
2007ProxyStatement auto nation2007ProxyStatement auto nation
2007ProxyStatement auto nation
 
Murphy Oil Corporation's 2008 Proxy Statement
	Murphy Oil Corporation's 2008 Proxy Statement 	Murphy Oil Corporation's 2008 Proxy Statement
Murphy Oil Corporation's 2008 Proxy Statement
 
1998_Financial_Discussion auto nation
1998_Financial_Discussion auto nation1998_Financial_Discussion auto nation
1998_Financial_Discussion auto nation
 
loews 10Q_3Q08
loews 10Q_3Q08loews 10Q_3Q08
loews 10Q_3Q08
 
kimberly clark AR 05
kimberly clark AR 05kimberly clark AR 05
kimberly clark AR 05
 

Semelhante a tjx Annual Reports2002

tech data Annual report 2003
tech data  Annual report 2003tech data  Annual report 2003
tech data Annual report 2003finance11
 
tech data Annual report 2002
tech data  Annual report 2002tech data  Annual report 2002
tech data Annual report 2002finance11
 
Line by environment interaction, yield stability and grouping of test locatio...
Line by environment interaction, yield stability and grouping of test locatio...Line by environment interaction, yield stability and grouping of test locatio...
Line by environment interaction, yield stability and grouping of test locatio...ILRI
 
Target Annual Report 2004
Target Annual Report 2004Target Annual Report 2004
Target Annual Report 2004finance4
 
Sop control paradox slides - 07 feb12
Sop control paradox slides - 07 feb12Sop control paradox slides - 07 feb12
Sop control paradox slides - 07 feb12Steelwedge_Software
 
Scania HQ%20Bank%20Investor%20meeting_tcm10-219785
Scania HQ%20Bank%20Investor%20meeting_tcm10-219785Scania HQ%20Bank%20Investor%20meeting_tcm10-219785
Scania HQ%20Bank%20Investor%20meeting_tcm10-219785finance50
 
Global solar radiation forecasting with non lineal statistical techniques and...
Global solar radiation forecasting with non lineal statistical techniques and...Global solar radiation forecasting with non lineal statistical techniques and...
Global solar radiation forecasting with non lineal statistical techniques and...IrSOLaV Pomares
 
2002_10_Impact of Privatization over Labor Force
2002_10_Impact of Privatization over Labor Force2002_10_Impact of Privatization over Labor Force
2002_10_Impact of Privatization over Labor ForceCarlos Mladinic
 
TransCanada Corporation - Annual Report - 2012
TransCanada Corporation - Annual Report - 2012TransCanada Corporation - Annual Report - 2012
TransCanada Corporation - Annual Report - 2012TransCanada Corporation
 
fiserv annual reports 2006
fiserv annual reports 2006fiserv annual reports 2006
fiserv annual reports 2006finance47
 
petsmart AR02
petsmart  AR02petsmart  AR02
petsmart AR02finance49
 
petsmart AR02
petsmart  AR02petsmart  AR02
petsmart AR02finance49
 
ACG European Capital Tour: Investing pitfalls / lessons learned and big succe...
ACG European Capital Tour: Investing pitfalls / lessons learned and big succe...ACG European Capital Tour: Investing pitfalls / lessons learned and big succe...
ACG European Capital Tour: Investing pitfalls / lessons learned and big succe...ACGEU
 

Semelhante a tjx Annual Reports2002 (15)

tech data Annual report 2003
tech data  Annual report 2003tech data  Annual report 2003
tech data Annual report 2003
 
tech data Annual report 2002
tech data  Annual report 2002tech data  Annual report 2002
tech data Annual report 2002
 
Line by environment interaction, yield stability and grouping of test locatio...
Line by environment interaction, yield stability and grouping of test locatio...Line by environment interaction, yield stability and grouping of test locatio...
Line by environment interaction, yield stability and grouping of test locatio...
 
Target Annual Report 2004
Target Annual Report 2004Target Annual Report 2004
Target Annual Report 2004
 
Sop control paradox slides - 07 feb12
Sop control paradox slides - 07 feb12Sop control paradox slides - 07 feb12
Sop control paradox slides - 07 feb12
 
Scania HQ%20Bank%20Investor%20meeting_tcm10-219785
Scania HQ%20Bank%20Investor%20meeting_tcm10-219785Scania HQ%20Bank%20Investor%20meeting_tcm10-219785
Scania HQ%20Bank%20Investor%20meeting_tcm10-219785
 
Global solar radiation forecasting with non lineal statistical techniques and...
Global solar radiation forecasting with non lineal statistical techniques and...Global solar radiation forecasting with non lineal statistical techniques and...
Global solar radiation forecasting with non lineal statistical techniques and...
 
2002_10_Impact of Privatization over Labor Force
2002_10_Impact of Privatization over Labor Force2002_10_Impact of Privatization over Labor Force
2002_10_Impact of Privatization over Labor Force
 
TransCanada Corporation - Annual Report - 2012
TransCanada Corporation - Annual Report - 2012TransCanada Corporation - Annual Report - 2012
TransCanada Corporation - Annual Report - 2012
 
fiserv annual reports 2006
fiserv annual reports 2006fiserv annual reports 2006
fiserv annual reports 2006
 
petsmart AR02
petsmart  AR02petsmart  AR02
petsmart AR02
 
petsmart AR02
petsmart  AR02petsmart  AR02
petsmart AR02
 
ACG European Capital Tour: Investing pitfalls / lessons learned and big succe...
ACG European Capital Tour: Investing pitfalls / lessons learned and big succe...ACG European Capital Tour: Investing pitfalls / lessons learned and big succe...
ACG European Capital Tour: Investing pitfalls / lessons learned and big succe...
 
Utah Adult Education Report Card (2008-2009)
Utah Adult Education Report Card (2008-2009)Utah Adult Education Report Card (2008-2009)
Utah Adult Education Report Card (2008-2009)
 
Merchants 2009 Final
Merchants 2009 FinalMerchants 2009 Final
Merchants 2009 Final
 

Mais de finance14

freeport-mcmoran copper& gold Certificate of Designations for Freeport-McMoR...
freeport-mcmoran copper& gold  Certificate of Designations for Freeport-McMoR...freeport-mcmoran copper& gold  Certificate of Designations for Freeport-McMoR...
freeport-mcmoran copper& gold Certificate of Designations for Freeport-McMoR...finance14
 
freeport-mcmoran copper& gold Amended & Restated Certificate of Incorporatio...
freeport-mcmoran copper& gold  Amended & Restated Certificate of Incorporatio...freeport-mcmoran copper& gold  Amended & Restated Certificate of Incorporatio...
freeport-mcmoran copper& gold Amended & Restated Certificate of Incorporatio...finance14
 
freeport-mcmoran copper& gold Public Policy Committee
freeport-mcmoran copper& gold  Public Policy Committeefreeport-mcmoran copper& gold  Public Policy Committee
freeport-mcmoran copper& gold Public Policy Committeefinance14
 
freeport-mcmoran copper& gold Nominating & Corporate Governance Committee
freeport-mcmoran copper& gold  Nominating & Corporate Governance Committeefreeport-mcmoran copper& gold  Nominating & Corporate Governance Committee
freeport-mcmoran copper& gold Nominating & Corporate Governance Committeefinance14
 
freeport-mcmoran copper& gold Corporate Personnel Committee
freeport-mcmoran copper& gold  Corporate Personnel Committeefreeport-mcmoran copper& gold  Corporate Personnel Committee
freeport-mcmoran copper& gold Corporate Personnel Committeefinance14
 
freeport-mcmoran copper& gold Audit Committee
freeport-mcmoran copper& gold  Audit Committeefreeport-mcmoran copper& gold  Audit Committee
freeport-mcmoran copper& gold Audit Committeefinance14
 
freeport-mcmoran copper& gold 2008ar
freeport-mcmoran copper& gold  2008arfreeport-mcmoran copper& gold  2008ar
freeport-mcmoran copper& gold 2008arfinance14
 
freeport-mcmoran copper& gold Proxy Statement 2004
freeport-mcmoran copper& gold Proxy Statement 2004freeport-mcmoran copper& gold Proxy Statement 2004
freeport-mcmoran copper& gold Proxy Statement 2004finance14
 
freeport-mcmoran copper& gold 2003ar
freeport-mcmoran copper& gold  2003arfreeport-mcmoran copper& gold  2003ar
freeport-mcmoran copper& gold 2003arfinance14
 
freeport-mcmoran copper& gold Proxy Statement 2005
freeport-mcmoran copper& gold Proxy Statement 2005freeport-mcmoran copper& gold Proxy Statement 2005
freeport-mcmoran copper& gold Proxy Statement 2005finance14
 
freeport-mcmoran copper& gold 2004 ar
freeport-mcmoran copper& gold 2004 arfreeport-mcmoran copper& gold 2004 ar
freeport-mcmoran copper& gold 2004 arfinance14
 
freeport-mcmoran copper& gold Proxy Statement 2006
freeport-mcmoran copper& gold Proxy Statement 2006freeport-mcmoran copper& gold Proxy Statement 2006
freeport-mcmoran copper& gold Proxy Statement 2006finance14
 
freeport-mcmoran copper& gold 2005 ar
freeport-mcmoran copper& gold 2005 arfreeport-mcmoran copper& gold 2005 ar
freeport-mcmoran copper& gold 2005 arfinance14
 
freeport-mcmoran copper& gold Proxy Statement 2007
freeport-mcmoran copper& gold Proxy Statement 2007freeport-mcmoran copper& gold Proxy Statement 2007
freeport-mcmoran copper& gold Proxy Statement 2007finance14
 
freeport-mcmoran copper& gold 2006 ar
freeport-mcmoran copper& gold 2006 arfreeport-mcmoran copper& gold 2006 ar
freeport-mcmoran copper& gold 2006 arfinance14
 
freeport-mcmoran copper& gold Proxy Statement 2008
freeport-mcmoran copper& gold Proxy Statement 2008freeport-mcmoran copper& gold Proxy Statement 2008
freeport-mcmoran copper& gold Proxy Statement 2008finance14
 
freeport-mcmoran copper& gold 2007 ar
freeport-mcmoran copper& gold 2007 arfreeport-mcmoran copper& gold 2007 ar
freeport-mcmoran copper& gold 2007 arfinance14
 
loews Highmount Parker
loews Highmount Parker loews Highmount Parker
loews Highmount Parker finance14
 
loews 2 CNA Lilienthal Mense
loews 2 CNA Lilienthal Mense loews 2 CNA Lilienthal Mense
loews 2 CNA Lilienthal Mense finance14
 
loews Q307_10Q
loews Q307_10Qloews Q307_10Q
loews Q307_10Qfinance14
 

Mais de finance14 (20)

freeport-mcmoran copper& gold Certificate of Designations for Freeport-McMoR...
freeport-mcmoran copper& gold  Certificate of Designations for Freeport-McMoR...freeport-mcmoran copper& gold  Certificate of Designations for Freeport-McMoR...
freeport-mcmoran copper& gold Certificate of Designations for Freeport-McMoR...
 
freeport-mcmoran copper& gold Amended & Restated Certificate of Incorporatio...
freeport-mcmoran copper& gold  Amended & Restated Certificate of Incorporatio...freeport-mcmoran copper& gold  Amended & Restated Certificate of Incorporatio...
freeport-mcmoran copper& gold Amended & Restated Certificate of Incorporatio...
 
freeport-mcmoran copper& gold Public Policy Committee
freeport-mcmoran copper& gold  Public Policy Committeefreeport-mcmoran copper& gold  Public Policy Committee
freeport-mcmoran copper& gold Public Policy Committee
 
freeport-mcmoran copper& gold Nominating & Corporate Governance Committee
freeport-mcmoran copper& gold  Nominating & Corporate Governance Committeefreeport-mcmoran copper& gold  Nominating & Corporate Governance Committee
freeport-mcmoran copper& gold Nominating & Corporate Governance Committee
 
freeport-mcmoran copper& gold Corporate Personnel Committee
freeport-mcmoran copper& gold  Corporate Personnel Committeefreeport-mcmoran copper& gold  Corporate Personnel Committee
freeport-mcmoran copper& gold Corporate Personnel Committee
 
freeport-mcmoran copper& gold Audit Committee
freeport-mcmoran copper& gold  Audit Committeefreeport-mcmoran copper& gold  Audit Committee
freeport-mcmoran copper& gold Audit Committee
 
freeport-mcmoran copper& gold 2008ar
freeport-mcmoran copper& gold  2008arfreeport-mcmoran copper& gold  2008ar
freeport-mcmoran copper& gold 2008ar
 
freeport-mcmoran copper& gold Proxy Statement 2004
freeport-mcmoran copper& gold Proxy Statement 2004freeport-mcmoran copper& gold Proxy Statement 2004
freeport-mcmoran copper& gold Proxy Statement 2004
 
freeport-mcmoran copper& gold 2003ar
freeport-mcmoran copper& gold  2003arfreeport-mcmoran copper& gold  2003ar
freeport-mcmoran copper& gold 2003ar
 
freeport-mcmoran copper& gold Proxy Statement 2005
freeport-mcmoran copper& gold Proxy Statement 2005freeport-mcmoran copper& gold Proxy Statement 2005
freeport-mcmoran copper& gold Proxy Statement 2005
 
freeport-mcmoran copper& gold 2004 ar
freeport-mcmoran copper& gold 2004 arfreeport-mcmoran copper& gold 2004 ar
freeport-mcmoran copper& gold 2004 ar
 
freeport-mcmoran copper& gold Proxy Statement 2006
freeport-mcmoran copper& gold Proxy Statement 2006freeport-mcmoran copper& gold Proxy Statement 2006
freeport-mcmoran copper& gold Proxy Statement 2006
 
freeport-mcmoran copper& gold 2005 ar
freeport-mcmoran copper& gold 2005 arfreeport-mcmoran copper& gold 2005 ar
freeport-mcmoran copper& gold 2005 ar
 
freeport-mcmoran copper& gold Proxy Statement 2007
freeport-mcmoran copper& gold Proxy Statement 2007freeport-mcmoran copper& gold Proxy Statement 2007
freeport-mcmoran copper& gold Proxy Statement 2007
 
freeport-mcmoran copper& gold 2006 ar
freeport-mcmoran copper& gold 2006 arfreeport-mcmoran copper& gold 2006 ar
freeport-mcmoran copper& gold 2006 ar
 
freeport-mcmoran copper& gold Proxy Statement 2008
freeport-mcmoran copper& gold Proxy Statement 2008freeport-mcmoran copper& gold Proxy Statement 2008
freeport-mcmoran copper& gold Proxy Statement 2008
 
freeport-mcmoran copper& gold 2007 ar
freeport-mcmoran copper& gold 2007 arfreeport-mcmoran copper& gold 2007 ar
freeport-mcmoran copper& gold 2007 ar
 
loews Highmount Parker
loews Highmount Parker loews Highmount Parker
loews Highmount Parker
 
loews 2 CNA Lilienthal Mense
loews 2 CNA Lilienthal Mense loews 2 CNA Lilienthal Mense
loews 2 CNA Lilienthal Mense
 
loews Q307_10Q
loews Q307_10Qloews Q307_10Q
loews Q307_10Q
 

Último

Governor Olli Rehn: Dialling back monetary restraint
Governor Olli Rehn: Dialling back monetary restraintGovernor Olli Rehn: Dialling back monetary restraint
Governor Olli Rehn: Dialling back monetary restraintSuomen Pankki
 
government_intervention_in_business_ownership[1].pdf
government_intervention_in_business_ownership[1].pdfgovernment_intervention_in_business_ownership[1].pdf
government_intervention_in_business_ownership[1].pdfshaunmashale756
 
原版1:1复刻温哥华岛大学毕业证Vancouver毕业证留信学历认证
原版1:1复刻温哥华岛大学毕业证Vancouver毕业证留信学历认证原版1:1复刻温哥华岛大学毕业证Vancouver毕业证留信学历认证
原版1:1复刻温哥华岛大学毕业证Vancouver毕业证留信学历认证rjrjkk
 
Interimreport1 January–31 March2024 Elo Mutual Pension Insurance Company
Interimreport1 January–31 March2024 Elo Mutual Pension Insurance CompanyInterimreport1 January–31 March2024 Elo Mutual Pension Insurance Company
Interimreport1 January–31 March2024 Elo Mutual Pension Insurance CompanyTyöeläkeyhtiö Elo
 
Monthly Market Risk Update: April 2024 [SlideShare]
Monthly Market Risk Update: April 2024 [SlideShare]Monthly Market Risk Update: April 2024 [SlideShare]
Monthly Market Risk Update: April 2024 [SlideShare]Commonwealth
 
212MTAMount Durham University Bachelor's Diploma in Technology
212MTAMount Durham University Bachelor's Diploma in Technology212MTAMount Durham University Bachelor's Diploma in Technology
212MTAMount Durham University Bachelor's Diploma in Technologyz xss
 
AfRESFullPaper22018EmpiricalPerformanceofRealEstateInvestmentTrustsandShareho...
AfRESFullPaper22018EmpiricalPerformanceofRealEstateInvestmentTrustsandShareho...AfRESFullPaper22018EmpiricalPerformanceofRealEstateInvestmentTrustsandShareho...
AfRESFullPaper22018EmpiricalPerformanceofRealEstateInvestmentTrustsandShareho...yordanosyohannes2
 
(办理原版一样)QUT毕业证昆士兰科技大学毕业证学位证留信学历认证成绩单补办
(办理原版一样)QUT毕业证昆士兰科技大学毕业证学位证留信学历认证成绩单补办(办理原版一样)QUT毕业证昆士兰科技大学毕业证学位证留信学历认证成绩单补办
(办理原版一样)QUT毕业证昆士兰科技大学毕业证学位证留信学历认证成绩单补办fqiuho152
 
Authentic No 1 Amil Baba In Pakistan Authentic No 1 Amil Baba In Karachi No 1...
Authentic No 1 Amil Baba In Pakistan Authentic No 1 Amil Baba In Karachi No 1...Authentic No 1 Amil Baba In Pakistan Authentic No 1 Amil Baba In Karachi No 1...
Authentic No 1 Amil Baba In Pakistan Authentic No 1 Amil Baba In Karachi No 1...First NO1 World Amil baba in Faisalabad
 
《加拿大本地办假证-寻找办理Dalhousie毕业证和达尔豪斯大学毕业证书的中介代理》
《加拿大本地办假证-寻找办理Dalhousie毕业证和达尔豪斯大学毕业证书的中介代理》《加拿大本地办假证-寻找办理Dalhousie毕业证和达尔豪斯大学毕业证书的中介代理》
《加拿大本地办假证-寻找办理Dalhousie毕业证和达尔豪斯大学毕业证书的中介代理》rnrncn29
 
chapter_2.ppt The labour market definitions and trends
chapter_2.ppt The labour market definitions and trendschapter_2.ppt The labour market definitions and trends
chapter_2.ppt The labour market definitions and trendslemlemtesfaye192
 
(办理学位证)加拿大萨省大学毕业证成绩单原版一比一
(办理学位证)加拿大萨省大学毕业证成绩单原版一比一(办理学位证)加拿大萨省大学毕业证成绩单原版一比一
(办理学位证)加拿大萨省大学毕业证成绩单原版一比一S SDS
 
Financial Leverage Definition, Advantages, and Disadvantages
Financial Leverage Definition, Advantages, and DisadvantagesFinancial Leverage Definition, Advantages, and Disadvantages
Financial Leverage Definition, Advantages, and Disadvantagesjayjaymabutot13
 
Current Economic situation of Pakistan .pptx
Current Economic situation of Pakistan .pptxCurrent Economic situation of Pakistan .pptx
Current Economic situation of Pakistan .pptxuzma244191
 
NO1 WorldWide Genuine vashikaran specialist Vashikaran baba near Lahore Vashi...
NO1 WorldWide Genuine vashikaran specialist Vashikaran baba near Lahore Vashi...NO1 WorldWide Genuine vashikaran specialist Vashikaran baba near Lahore Vashi...
NO1 WorldWide Genuine vashikaran specialist Vashikaran baba near Lahore Vashi...Amil baba
 
NO1 Certified Ilam kala Jadu Specialist Expert In Bahawalpur, Sargodha, Sialk...
NO1 Certified Ilam kala Jadu Specialist Expert In Bahawalpur, Sargodha, Sialk...NO1 Certified Ilam kala Jadu Specialist Expert In Bahawalpur, Sargodha, Sialk...
NO1 Certified Ilam kala Jadu Specialist Expert In Bahawalpur, Sargodha, Sialk...Amil Baba Dawood bangali
 
BPPG response - Options for Defined Benefit schemes - 19Apr24.pdf
BPPG response - Options for Defined Benefit schemes - 19Apr24.pdfBPPG response - Options for Defined Benefit schemes - 19Apr24.pdf
BPPG response - Options for Defined Benefit schemes - 19Apr24.pdfHenry Tapper
 
Lundin Gold April 2024 Corporate Presentation v4.pdf
Lundin Gold April 2024 Corporate Presentation v4.pdfLundin Gold April 2024 Corporate Presentation v4.pdf
Lundin Gold April 2024 Corporate Presentation v4.pdfAdnet Communications
 
原版1:1复刻堪萨斯大学毕业证KU毕业证留信学历认证
原版1:1复刻堪萨斯大学毕业证KU毕业证留信学历认证原版1:1复刻堪萨斯大学毕业证KU毕业证留信学历认证
原版1:1复刻堪萨斯大学毕业证KU毕业证留信学历认证jdkhjh
 

Último (20)

Governor Olli Rehn: Dialling back monetary restraint
Governor Olli Rehn: Dialling back monetary restraintGovernor Olli Rehn: Dialling back monetary restraint
Governor Olli Rehn: Dialling back monetary restraint
 
government_intervention_in_business_ownership[1].pdf
government_intervention_in_business_ownership[1].pdfgovernment_intervention_in_business_ownership[1].pdf
government_intervention_in_business_ownership[1].pdf
 
Monthly Economic Monitoring of Ukraine No 231, April 2024
Monthly Economic Monitoring of Ukraine No 231, April 2024Monthly Economic Monitoring of Ukraine No 231, April 2024
Monthly Economic Monitoring of Ukraine No 231, April 2024
 
原版1:1复刻温哥华岛大学毕业证Vancouver毕业证留信学历认证
原版1:1复刻温哥华岛大学毕业证Vancouver毕业证留信学历认证原版1:1复刻温哥华岛大学毕业证Vancouver毕业证留信学历认证
原版1:1复刻温哥华岛大学毕业证Vancouver毕业证留信学历认证
 
Interimreport1 January–31 March2024 Elo Mutual Pension Insurance Company
Interimreport1 January–31 March2024 Elo Mutual Pension Insurance CompanyInterimreport1 January–31 March2024 Elo Mutual Pension Insurance Company
Interimreport1 January–31 March2024 Elo Mutual Pension Insurance Company
 
Monthly Market Risk Update: April 2024 [SlideShare]
Monthly Market Risk Update: April 2024 [SlideShare]Monthly Market Risk Update: April 2024 [SlideShare]
Monthly Market Risk Update: April 2024 [SlideShare]
 
212MTAMount Durham University Bachelor's Diploma in Technology
212MTAMount Durham University Bachelor's Diploma in Technology212MTAMount Durham University Bachelor's Diploma in Technology
212MTAMount Durham University Bachelor's Diploma in Technology
 
AfRESFullPaper22018EmpiricalPerformanceofRealEstateInvestmentTrustsandShareho...
AfRESFullPaper22018EmpiricalPerformanceofRealEstateInvestmentTrustsandShareho...AfRESFullPaper22018EmpiricalPerformanceofRealEstateInvestmentTrustsandShareho...
AfRESFullPaper22018EmpiricalPerformanceofRealEstateInvestmentTrustsandShareho...
 
(办理原版一样)QUT毕业证昆士兰科技大学毕业证学位证留信学历认证成绩单补办
(办理原版一样)QUT毕业证昆士兰科技大学毕业证学位证留信学历认证成绩单补办(办理原版一样)QUT毕业证昆士兰科技大学毕业证学位证留信学历认证成绩单补办
(办理原版一样)QUT毕业证昆士兰科技大学毕业证学位证留信学历认证成绩单补办
 
Authentic No 1 Amil Baba In Pakistan Authentic No 1 Amil Baba In Karachi No 1...
Authentic No 1 Amil Baba In Pakistan Authentic No 1 Amil Baba In Karachi No 1...Authentic No 1 Amil Baba In Pakistan Authentic No 1 Amil Baba In Karachi No 1...
Authentic No 1 Amil Baba In Pakistan Authentic No 1 Amil Baba In Karachi No 1...
 
《加拿大本地办假证-寻找办理Dalhousie毕业证和达尔豪斯大学毕业证书的中介代理》
《加拿大本地办假证-寻找办理Dalhousie毕业证和达尔豪斯大学毕业证书的中介代理》《加拿大本地办假证-寻找办理Dalhousie毕业证和达尔豪斯大学毕业证书的中介代理》
《加拿大本地办假证-寻找办理Dalhousie毕业证和达尔豪斯大学毕业证书的中介代理》
 
chapter_2.ppt The labour market definitions and trends
chapter_2.ppt The labour market definitions and trendschapter_2.ppt The labour market definitions and trends
chapter_2.ppt The labour market definitions and trends
 
(办理学位证)加拿大萨省大学毕业证成绩单原版一比一
(办理学位证)加拿大萨省大学毕业证成绩单原版一比一(办理学位证)加拿大萨省大学毕业证成绩单原版一比一
(办理学位证)加拿大萨省大学毕业证成绩单原版一比一
 
Financial Leverage Definition, Advantages, and Disadvantages
Financial Leverage Definition, Advantages, and DisadvantagesFinancial Leverage Definition, Advantages, and Disadvantages
Financial Leverage Definition, Advantages, and Disadvantages
 
Current Economic situation of Pakistan .pptx
Current Economic situation of Pakistan .pptxCurrent Economic situation of Pakistan .pptx
Current Economic situation of Pakistan .pptx
 
NO1 WorldWide Genuine vashikaran specialist Vashikaran baba near Lahore Vashi...
NO1 WorldWide Genuine vashikaran specialist Vashikaran baba near Lahore Vashi...NO1 WorldWide Genuine vashikaran specialist Vashikaran baba near Lahore Vashi...
NO1 WorldWide Genuine vashikaran specialist Vashikaran baba near Lahore Vashi...
 
NO1 Certified Ilam kala Jadu Specialist Expert In Bahawalpur, Sargodha, Sialk...
NO1 Certified Ilam kala Jadu Specialist Expert In Bahawalpur, Sargodha, Sialk...NO1 Certified Ilam kala Jadu Specialist Expert In Bahawalpur, Sargodha, Sialk...
NO1 Certified Ilam kala Jadu Specialist Expert In Bahawalpur, Sargodha, Sialk...
 
BPPG response - Options for Defined Benefit schemes - 19Apr24.pdf
BPPG response - Options for Defined Benefit schemes - 19Apr24.pdfBPPG response - Options for Defined Benefit schemes - 19Apr24.pdf
BPPG response - Options for Defined Benefit schemes - 19Apr24.pdf
 
Lundin Gold April 2024 Corporate Presentation v4.pdf
Lundin Gold April 2024 Corporate Presentation v4.pdfLundin Gold April 2024 Corporate Presentation v4.pdf
Lundin Gold April 2024 Corporate Presentation v4.pdf
 
原版1:1复刻堪萨斯大学毕业证KU毕业证留信学历认证
原版1:1复刻堪萨斯大学毕业证KU毕业证留信学历认证原版1:1复刻堪萨斯大学毕业证KU毕业证留信学历认证
原版1:1复刻堪萨斯大学毕业证KU毕业证留信学历认证
 

tjx Annual Reports2002

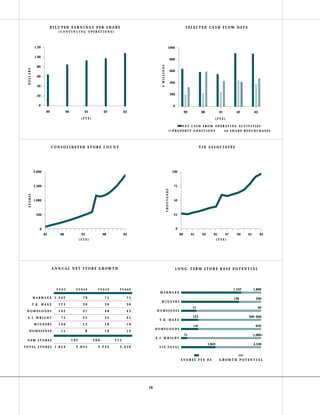
  • 1. DILUTED EARNINGS PER SHARE S E L E C T E D C A S H F L OW DATA ( C O N T I N U I N G O P E R AT I O N S ) 1.20 1000 1.00 800 $ MILLIONS .80 DOLLARS 600 .60 400 .40 200 .20 0 0 99 00 01 02 03 99 00 01 02 03 (FYE) (FYE) N E T C A S H F R O M O P E R AT I N G A C T I V I T I E S P RO P E RT Y A D D I T I O N S SHARE REPURCHASES C O N S O L I DAT E D S T O R E C O U N T T J X A S S O C I AT E S 2,000 100 1,500 75 THOUSANDS STORES 1,000 50 500 25 0 0 84 88 93 98 89 91 93 95 97 99 01 03 03 (FYE) (FYE) A N N UA L N E T S TO R E G ROW T H LONG-TERM STORE BASE POTENTIAL 1,342 1,800 FY03 FY04E FY05E FY06E MARMAXX MARMAXX 1,342 79 75 75 146 200 WINNERS 123 30 30 30 T. K . M A X X 15 80 HOMESENSE 142 37 40 43 HOMEGOODS 123 300–600 75 25 35 45 A.J. WRIGHT T. K . M A X X 146 13 10 10 WINNERS 650 142 HOMEGOODS 15 8 10 12 HOMESENSE 75 1,000+ A.J. WRIGHT 192 200 215 NEW STORES 1,843 4,330 T O TA L S T O R E S 1 , 8 4 3 2,035 2,235 2,450 T J X T O TA L STORES FYE 03 G ROW T H P OT E N T I A L 16
  • 2. T H E T J X C O M PA N I E S , I N C . Selected Financial Data (Continuing Operations) Amounts In Thousands Fiscal Year Ended January Except Per Share Amounts 2003 2002 2001 2000 1999 Income statement and per share data: Net sales $11,981,207 $10,708,998 $9,579,006 $8,795,347 $7,949,101 Income from continuing operations before cumulative effect of accounting change $ 578,388 $ 540,397 $ 538,066 $ 526,822 $ 433,202 Weighted average common shares for diluted earnings per share calculation 537,740 556,268 578,392 635,582 669,296 Diluted earnings per share from continuing operations before cumulative effect of accounting change $1.08 $.97 $.93 $.83 $.65 Cash dividends declared per share $ .12 $.09 $.08 $.07 $.06 Balance sheet data: Cash and cash equivalents $ 492,330 $ 492,776 $ 132,535 $ 371,759 $ 461,244 Working capital 674,195 800,916 537,185 532,017 663,902 Total assets 3,940,489 3,595,743 2,932,283 2,804,963 2,760,127 Capital expenditures 396,724 449,444 257,005 238,569 207,742 Long-term obligations (1) 693,764 702,379 319,372 319,367 220,344 Shareholders’ equity 1,409,147 1,340,698 1,218,712 1,119,228 1,220,656 Other financial data: After-tax return on average shareholders’ equity 42.1% 42.2% 46.0% 45.0% 36.3% Total debt as a percentage of total capitalization (2) 33.5% 34.4% 22.7% 27.3% 15.3% Stores in operation at year-end: T.J. Maxx 713 687 661 632 604 Marshalls 629 582 535 505 475 Winners 146 131 117 100 87 T.K. Maxx 123 101 74 54 39 HomeGoods 142 112 81 51 35 A.J. Wright 75 45 25 15 6 HomeSense 15 7 - - - Total 1,843 1,665 1,493 1,357 1,246 (1) Includes long-term debt, exclusive of current installments and obligation under capital lease, less portion due within one year. (2) Total capitalization includes shareholders’ equity, short-term debt, long-term debt and capital lease obligation, including current maturities. 17
  • 3. T H E T J X C O M PA N I E S , I N C . Consolidated Statements of Income Fiscal Year Ended January 25, January 26, January 27, Amounts In Thousands Except Per Share Amounts 2003 2002 2001 Net sales $11,981,207 $10,708,998 $9,579,006 Cost of sales, including buying and occupancy costs 9,079,579 8,122,922 7,188,124 Selling, general and administrative expenses 1,938,531 1,686,389 1,503,036 Interest expense, net 25,373 25,643 22,904 Income from continuing operations before provision for income taxes 937,724 874,044 864,942 Provision for income taxes 359,336 333,647 326,876 Income from continuing operations 578,388 540,397 538,066 (Loss) from discontinued operations, net of income taxes - (40,000) - Net income $ 578,388 $ 500,397 $ 538,066 Basic earnings per share: Income from continuing operations $1.09 $.98 $.94 Net income $1.09 $.91 $.94 Weighted average common shares - basic 532,241 550,647 574,881 Diluted earnings per share: Income from continuing operations $1.08 $.97 $.93 Net income $1.08 $.90 $.93 Weighted average common shares - diluted 537,740 556,268 578,392 Cash dividends declared per share $ .12 $.09 $.08 The accompanying notes are an integral part of the financial statements. 18
  • 4. T H E T J X C O M PA N I E S , I N C . Consolidated Balance Sheets January 25, January 26, In Thousands 2003 2002 Assets Current assets: Cash and cash equivalents $ 492,330 $ 492,776 Accounts receivable 75,515 69,209 Merchandise inventories 1,563,450 1,456,976 Prepaid expenses and other current assets 100,284 84,962 Current deferred income taxes, net 8,961 12,003 Total current assets 2,240,540 2,115,926 Property at cost: Land and buildings 230,810 172,016 Leasehold costs and improvements 970,981 853,733 Furniture, fixtures and equipment 1,409,123 1,210,366 2,610,914 2,236,115 Less accumulated depreciation and amortization 1,232,189 1,076,196 1,378,725 1,159,919 Property under capital lease, net of accumulated amortization of $3,723 and $1,489, respectively 28,849 31,083 Other assets 113,192 83,139 Non-current deferred income taxes, net - 26,575 Goodwill and tradename, net of amortization 179,183 179,101 Total Assets $3,940,489 $3,595,743 Liabilities Current liabilities: Current installments of long-term debt $ 15,000 $ - Obligation under capital lease due within one year 1,348 1,244 Accounts payable 817,633 761,546 Accrued expenses and other current liabilities 669,732 510,270 Federal, foreign and state income taxes payable 62,632 41,950 Total current liabilities 1,566,345 1,315,010 Other long-term liabilities 229,264 237,656 Non-current deferred income taxes, net 41,969 - Obligation under capital lease, less portion due within one year 28,988 30,336 Long-term debt, exclusive of current installments 664,776 672,043 Commitments and contingencies - - Shareholders’ Equity Common stock, authorized 1,200,000,000 shares, par value $1, issued and outstanding 520,515,041 and 543,075,306 (post-split) shares, respectively 520,515 271,538 Additional paid-in capital - - Accumulated other comprehensive income (loss) (3,164) (6,755) Unearned stock compensation (7,652) (4,654) Retained earnings 899,448 1,080,569 Total shareholders’ equity 1,409,147 1,340,698 Total Liabilities and Shareholders’ Equity $3,940,489 $3,595,743 The accompanying notes are an integral part of the financial statements. 19
  • 5. T H E T J X C O M PA N I E S , I N C . Consolidated Statements of Cash Flows Fiscal Year Ended January 25, January 26, January 27, In Thousands 2003 2002 2001 Cash flows from operating activities: Net income $578,388 $500,397 $538,066 Adjustments to reconcile net income to net cash provided by operating activities: Loss from discontinued operations, net of income taxes - 40,000 - Depreciation and amortization 207,876 204,081 175,781 Property disposals and impairments 8,699 6,832 4,559 Tax benefit of employee stock options 11,767 30,644 15,941 Deferred income tax provision (benefit) 72,138 35,230 (24,235) Changes in assets and liabilities: (Increase) in accounts receivable (5,983) (7,615) (6,501) (Increase) in merchandise inventories (85,644) (13,292) (232,031) (Increase) in prepaid expenses and other current assets (22,208) (1,273) (12,083) Increase in accounts payable 45,559 120,770 34,158 Increase in accrued expenses and other liabilities 112,781 16,116 69,726 Increase (decrease) in income taxes payable 20,334 (62) (592) Other, net (35,147) (19,382) (6,026) Net cash provided by operating activities 908,560 912,446 556,763 Cash flows from investing activities: Property additions (396,724) (449,444) (257,005) Issuance of note receivable - (5,527) (23,100) Proceeds from repayments on note receivable 564 125 - Proceeds from sale of other assets - - 9,183 Net cash (used in) investing activities (396,160) (454,846) (270,922) Cash flows from financing activities: Proceeds from borrowings of short-term debt, net - - 39,000 Proceeds from borrowings of long-term debt - 347,579 - Principal payments on long-term debt - (73) (100,203) Payments on short-term debt, net - (39,000) - Payments on capital lease obligation (1,244) (992) - Proceeds from sale and issuance of common stock, net 33,916 65,202 26,101 Cash payments for repurchase of common stock (481,734) (424,163) (444,105) Cash dividends paid (60,025) (48,290) (44,693) Net cash (used in) financing activities (509,087) (99,737) (523,900) Effect of exchange rate changes on cash (3,759) 2,378 (1,165) Net (decrease) increase in cash and cash equivalents (446) 360,241 (239,224) Cash and cash equivalents at beginning of year 492,776 132,535 371,759 Cash and cash equivalents at end of year $492,330 $492,776 $132,535 The accompanying notes are an integral part of the financial statements. 20
  • 6. T H E T J X C O M PA N I E S , I N C . Consolidated Statements of Shareholders’ Equity Accumulated Common Additional Other Unearned Stock, Par Paid-in Comprehensive Stock Retained In Thousands Value $1 Capital Income (Loss) Compensation Earnings Total Balance, January 29, 2000 $299,979 $ - $ (1,433) $(3,739) $ 824,421 $1,119,228 Comprehensive income: Net income - - - - 538,066 538,066 (Loss) due to foreign currency translation adjustments - - (11,860) - - (11,860) Gain on net investment hedge contracts - - 11,547 - - 11,547 Minimum pension liability adjustment - - (1,675) - - (1,675) Reclassification of prior unrealized loss on securities - - 133 - - 133 Total comprehensive income 536,211 Cash dividends declared on common stock - - - - (45,266) (45,266) Restricted stock awards granted 10 197 - (207) - - Restricted stock awards forfeited (33) (942) - 975 - - Amortization of unearned stock compensation - - - 1,420 - 1,420 Issuance of common stock under stock incentive plans and related tax benefits 2,656 39,293 - - - 41,949 Common stock repurchased (22,233) (38,548) - - (374,049) (434,830) Balance, January 27, 2001 280,379 - (3,288) (1,551) 943,172 1,218,712 Comprehensive income: Net income - - - - 500,397 500,397 Cumulative effect of accounting change (SFAS No.133) - - (1,572) - - (1,572) (Loss) due to foreign currency translation adjustments - - (8,185) - - (8,185) Gain on net investment hedge contracts - - 8,190 - - 8,190 Minimum pension liability adjustment - - (2,151) - - (2,151) Amounts reclassified from other comprehensive income to net income - - 251 - - 251 Total comprehensive income 496,930 Cash dividends declared on common stock - - - - (49,295) (49,295) Restricted stock awards granted 225 7,137 - (5,775) - 1,587 Amortization of unearned stock compensation - - - 2,672 - 2,672 Issuance of common stock under stock incentive plans and related tax benefits 4,102 90,153 - - - 94,255 Common stock repurchased (13,168) (97,290) - - (313,705) (424,163) Balance, January 26, 2002 271,538 - (6,755) (4,654) 1,080,569 1,340,698 Comprehensive income: Net income - - - - 578,388 578,388 Gain due to foreign currency translation adjustments - - 23,006 - - 23,006 (Loss) on net investment hedge contracts - - (23,241) - - (23,241) Minimum pension liability adjustment - - 3,826 - - 3,826 Total comprehensive income 581,979 Stock split, two-for-one 269,431 - - - (269,431) - Cash dividends declared on common stock - - - - (63,421) (63,421) Restricted stock awards granted 325 5,870 - (6,195) - - Amortization of unearned stock compensation - - - 3,197 - 3,197 Issuance of common stock under stock incentive plans and related tax benefits 2,505 41,794 - - - 44,299 Common stock repurchased (23,284) (47,664) - - (426,657) (497,605) Balance, January 25, 2003 $520,515 $ - $ (3,164) $(7,652) $ 899,448 $1,409,147 The accompanying notes are an integral part of the financial statements. 21
  • 7. T H E T J X C O M PA N I E S , I N C . Notes to Consolidated Financial Statements A . S U M M A RY O F A C C O U N T I N G P O L I C I E S Basis of Presentation: The consolidated financial statements of The TJX Companies, Inc. (“TJX”, the “Company” or “We”) include the financial statements of all of TJX’s subsidiaries, including our foreign subsidiaries, all of which are wholly owned. All of TJX’s activities are conducted within TJX or our subsidiaries and are consolidated in these financial statements. All intercompany transactions have been eliminated in consolidation. The notes pertain to continuing operations except where otherwise noted. Fiscal Year: TJX’s fiscal year ends on the last Saturday in January. The fiscal years ended January 25, 2003 (“fiscal 2003”), January 26, 2002 and January 27, 2001 each included 52 weeks. Use of Estimates: The preparation of the financial statements, in conformity with accounting principles generally accepted in the United States, requires management to make estimates and assumptions that affect the reported amounts of assets and liabilities, and disclosure of contingent liabilities, at the date of the financial statements as well as the reported amounts of revenues and expenses during the reporting period. TJX considers the more significant accounting policies that involve management estimates and judgments to be those relating to inventory valuation, retirement obligations, accounting for taxes and reserves for discontinued operations. Actual amounts could differ from those estimates. Revenue Recognition: TJX records revenue at the time of sale and receipt of merchandise by the customer, net of a reserve for estimated returns. We estimate returns based upon our historical experience. We defer recognition of a layaway sale and its related profit to the accounting period when the customer receives layaway merchandise. Consolidated Statements of Income Classifications: Cost of sales, including buying and occupancy costs include the cost of merchandise sold; store occupancy costs (including real estate taxes, utility and maintenance costs, and fixed asset depreciation); the costs of operating our distribution centers; payroll, benefits and travel costs directly associ- ated with buying inventory; and systems costs related to the buying and tracking of inventory. Selling, general and administrative expenses include store payroll and benefit costs; communication costs; credit and check expenses; advertising; administrative and field management payroll, benefits and travel costs; corporate administrative costs and depreciation; gains and losses on foreign currency exchange contracts and other nonrecur- ring gains or losses; and all other miscellaneous income and expense items. Cash, Cash Equivalents and Short-Term Investments: TJX generally considers highly liquid investments with an initial maturity of three months or less to be cash equivalents. Our investments are primarily high-grade commer- cial paper, institutional money market funds and time deposits with major banks. The fair value of cash equivalents approximates carrying value. During September 1999, we received 693,537 common shares of Manulife Financial Corporation. The shares reflected ownership interest in the demutualized insurer due to policies held by TJX. These securities were recorded at market value upon receipt resulting in an $8.5 million pre-tax gain. During fiscal 2001, we sold all of these shares for $9.2 million and realized a gain of $722,000. Merchandise Inventories: Inventories are stated at the lower of cost or market.TJX uses the retail method for valuing inventories on the first-in first-out basis. We almost exclusively utilize a permanent markdown strategy and lower the cost value of the inventory that is subject to markdown at the time the retail prices are lowered in our stores. Common Stock and Equity: TJX’s equity transactions consist primarily of the repurchase of our common stock under our stock repurchase program and the issuance of common stock under our stock incentive plan. Under the stock repurchase program we repurchase our common stock on the open market. The par value of the shares repurchased is charged to common stock with the excess of the purchase price over par first charged against any available addi- tional paid-in capital (“APIC”) and the balance charged to retained earnings. Virtually all shares are retired when purchased. We have an immaterial number of shares held in treasury which are reflected as a reduction to common stock outstanding. Shares issued under our stock incentive plan are issued from authorized but previously unissued shares, and proceeds received are recorded by increasing common stock for the par value of the shares with the excess over par added to APIC. Income tax benefits due to the exercise of stock options are also added to APIC and included with the proceeds received from the option exercise. The income tax benefits are included in cash flows from operating activities in the statements of cash flows. The par value and excess of the fair value over par value of restricted stock awards are also added to common stock and APIC with an offsetting amount recorded in unearned stock compensation. The amount 22
  • 8. T H E T J X C O M PA N I E S , I N C . included in unearned stock compensation is amortized into earnings over the vesting period of the related award. Due to the high volume of repurchases over the past several years we have no remaining balance in APIC. TJX has adopted the disclosure-only provisions of Statement of Financial Accounting Standards (“SFAS”) No.123, “Accounting for Stock-Based Compensation,” and continues to apply the provisions of Accounting Principles Board Opinion No.25, “Accounting for Stock Issued to Employees,” in accounting for compensation expense under its stock option plans. TJX grants options at fair market value on the date of the grant, accordingly no compensation expense has been recognized for the stock options issued during fiscal 2003, 2002 or 2001. Compensation expense deter- mined in accordance with SFAS No.123, net of related income tax effect, amounted to $39.7 million, $27.8 million and $19.2 million for fiscal 2003, 2002 and 2001, respectively. Disclosure as required by SFAS No.148, as discussed in New Accounting Standards below, is presented in Note E. Interest: TJX’s interest expense, net was $25.4 million, $25.6 million and $22.9 million in fiscal 2003, 2002 and 2001, respectively. Interest expense is presented net of interest income of $10.5 million, $15.0 million and $11.8 million in fiscal 2003, 2002 and 2001, respectively. We capitalize interest during the active construction period of major capital projects. Capitalized interest is added to the cost of the related assets. We capitalized interest of $559,000, $222,000 and $311,000 in fiscal 2003, 2002 and 2001, respectively. Debt discount and related issue expenses are amortized to interest expense over the lives of the related debt issues or to the first date the holders of the debt may request TJX to repurchase such debt. Depreciation and Amortization: For financial reporting purposes, TJX provides for depreciation and amortization of property by the use of the straight-line method over the estimated useful lives of the assets. Buildings are depreciated over 33 years, leasehold costs and improvements are generally amortized over the lease term (typically 10 years) or their estimated useful life, whichever is shorter, and furniture, fixtures and equipment are depreciated over 3 to 10 years. Depreciation and amortization expense for property was $196.4 million for fiscal 2003, $183.1 million for fiscal 2002, and $169.1 million for fiscal 2001. Amortization expense for property held under a capital lease was $2.2 million and $1.5 million in fiscal 2003 and 2002, respectively. Maintenance and repairs are charged to expense as incurred. Significant costs incurred for internally developed software are capitalized and amor- tized over three to five years. Upon retirement or sale, the cost of disposed assets and the related accumulated depreciation are eliminated and any gain or loss is included in net income. Pre-opening costs are expensed as incurred. Goodwill and Tradename: Goodwill is primarily the excess of the purchase price paid over the carrying value of the minority interest acquired in fiscal 1990 in TJX’s former 83%-owned subsidiary and represents goodwill associated with the T.J. Maxx chain and is included in the Marmaxx segment at January 25, 2003. In addition, goodwill includes the excess of cost over the estimated fair market value of the net assets of Winners acquired by TJX in fiscal 1991. Goodwill, net of amortization, totaled $71.5 million and $71.4 million as of January 25, 2003 and January 26, 2002, respectively, and had been amortized over 40 years on a straight-line basis through January 26, 2002. Annual amortization of goodwill was $2.6 million in fiscal 2002 and 2001. There was no amortization of goodwill in fiscal 2003. Cumulative amortization as of January 25, 2003 and January 26, 2002 was $32.9 million. Tradename is the value assigned to the name “Marshalls” as a result of TJX’s acquisition of the Marshalls chain in fiscal 1996. The value of the tradename was determined by the discounted present value of assumed after-tax royalty payments, offset by a reduction for its pro-rata share of the total negative goodwill acquired. The final purchase price allocated to the tradename amounted to $128.3 million. The tradename had been amortized over 40 years through January 26, 2002. Annual amortization expense was $3.2 million in fiscal 2002 and 2001. There was no amortization of tradename in fiscal 2003. Cumulative amortization as of January 25, 2003 and January 26, 2002 was $20.6 million. The Company acquires other tradenames of manufacturers to have marketing privileges for their products. Such tradenames are included in other assets and are amortized to cost of sales, including buying and occupancy costs over the term of the agreement generally from 7 to 10 years. The Company had $3.2 million and $569,000 in tradenames at January 25, 2003 and January 26, 2002, respectively. Tradenames and the related amortization are included in the related operating segment. In July 2001, the Financial Accounting Standards Board (“FASB”) issued SFAS No.142, “Goodwill and Other Intangible Assets.” This Statement addresses how goodwill and other intangible assets should be accounted for after they have been initially recognized in the financial statements. We implemented SFAS No.142 during our fiscal year beginning January 27, 2002. As a result of the new standard, we no longer amortize goodwill or the value of the Marshalls tradename which has an indefinite life. No impairments have been recorded on these assets to date. 23
  • 9. T H E T J X C O M PA N I E S , I N C . The following schedule presents pro forma income from continuing operations (unaudited) and pro forma net income (unaudited) presented as if goodwill amortization and tradename amortization had not been included as an expense in the prior periods: Fiscal Year Ended January 25, January 26, January 27, In Thousands Except Per Share Amounts 2003 2002 2001 Reported income from continuing operations $578,388 $540,397 $538,066 Add back: Goodwill amortization, net of related tax effects - 2,607 2,609 Add back: Tradename amortization, net of related tax effects - 1,910 1,910 Pro forma income from continuing operations $578,388 $544,914 $542,585 Diluted earnings per share: Reported income from continuing operations $1.08 $.97 $.93 Pro forma income from continuing operations $1.08 $.98 $.94 Reported net income $578,388 $500,397 $538,066 Add back: Goodwill amortization, net of related tax effects - 2,607 2,609 Add back: Tradename amortization, net of related tax effects - 1,910 1,910 Pro forma net income $578,388 $504,914 $542,585 Diluted earnings per share: Reported net income $1.08 $.90 $.93 Pro forma net income $1.08 $.91 $.94 Impairment of Long-Lived Assets: TJX periodically reviews the value of its property and intangible assets in relation to the current and expected operating results of the related business segments in order to assess whether there has been a permanent impairment of their carrying values. An impairment exists when the undiscounted cash flow of an asset is less than the carrying cost of that asset. Store by store impairment analysis is performed, at a minimum, on an annual basis. We recorded an impairment loss of $3.1 million in fiscal 2001 as a component of the $6.3 million estimated cost of closing our three T.K. Maxx stores in the Netherlands. Advertising Costs: TJX expenses advertising costs as incurred. Advertising expense was $135.3 million, $128.5 million and $121.8 million for fiscal 2003, 2002 and 2001, respectively. Earnings Per Share: All earnings per share amounts discussed refer to diluted earnings per share unless otherwise indi- cated. All historical earnings per share amounts reflect the May 2002 two-for-one stock split. Foreign Currency Translation and Related Hedging Activity: TJX’s foreign assets and liabilities are translated at the fiscal year-end exchange rate. Activity of the foreign operations that affect the statements of income and cash flows are translated at the average exchange rates prevailing during the fiscal year. A large portion of the net investments in the foreign operations are hedged with foreign currency forward contracts and swap agreements. The translation adjustments associated with the foreign operations and the related hedging instruments are included in shareholders’ equity as a component of accumulated other comprehensive income (loss). Cumulative foreign currency translation adjustments, net of hedging activity, included in shareholders’ equity amounted to losses of $3.2 million and $2.9 million as of January 25, 2003 and January 26, 2002, respectively. Effective January 28, 2001, TJX implemented SFAS No.133, “Accounting for Derivative Instruments and Hedging Activities.” This Statement, as amended, established accounting and reporting standards for derivative instruments, including certain derivative instruments embedded in other contracts, and for hedging activities. This Statement requires that an entity recognize all derivatives as either assets or liabilities in the statements of financial position and measure those instruments at fair value. This Statement also requires that companies recognize adjustments to the fair value of derivatives in earnings when they occur, if they do not qualify for hedge accounting. For derivatives that qualify for hedge accounting, changes in the fair value of the derivatives can be recognized currently in earnings, along with an offsetting adjustment against the basis of the underlying hedged item, or can be deferred in accumu- lated other comprehensive income. 24
  • 10. T H E T J X C O M PA N I E S , I N C . This Statement affects the accounting for TJX’s hedging contracts. As described in Note C, we periodically enter into forward foreign currency exchange contracts to hedge certain merchandise purchase commitments, intercompany balances, including intercompany debt, and net investment in and between foreign subsidiaries. Through January 27, 2001, we applied hedge accounting to these contracts. Upon adoption of SFAS No.133, we prospectively elected not to apply the hedge accounting rules to our merchandise purchase commitment and intercompany balance (excluding intercompany debt) related contracts, even though these contracts effectively function as an economic hedge of the underlying exposure. Thus, the changes in fair value of the merchandise purchase commitment and intercompany balance (excluding intercompany debt) related contracts are reported in current earnings as a compo- nent of selling, general and administrative expenses, with no offset for marking the underlying exposure to fair value. We continue to apply hedge accounting to our net investment hedge contracts, and changes in fair value of these contracts, as well as gains and losses upon settlement, are recorded in accumulated other comprehensive income, offsetting changes in the cumulative foreign translation adjustments of our foreign divisions. We also apply hedge accounting to intercompany debt hedge contracts. If we deem the intercompany debt to be indefinitely invested, the hedge contracts are designated as net investment hedges and accounted for as described above. For all other inter- company debt, the changes in fair value of the related contracts are recorded in the statement of income and offset by marking the underlying item to fair value in the same period. Upon settlement, the realized gains and losses on these contracts are offset by the realized gains and losses of the underlying item in the statement of income. At implementation of SFAS No.133, the fair value of all of TJX’s hedge contracts amounted to a net asset of $10.0 million, most of which related to net investment hedge contracts. The carrying value of all hedge contracts before adoption was $12.8 million. We also wrote off a net deferred asset of $1.2 million, related to premiums on existing hedge contracts, and thus recorded a charge to accumulated other comprehensive income for the cumula- tive effect of an accounting change of $1.6 million effective January 28, 2001. New Accounting Standards: In June 2002, the FASB issued SFAS No.146, “Accounting for Costs Associated with Exit or Disposal Activities.”This Statement addresses financial accounting and reporting for costs associated with exit or disposal activities including store closing activities.The provisions of SFAS No.146 are effective for exit or disposal activities initi- ated after December 31, 2002, with early adoption encouraged. Generally the effect of these provisions is to defer the recording of certain store closing costs from the date we commit to close a store to the date the store actually closes. The adoption of SFAS No.146 will not have a material impact on our financial position or results of operations. In December 2002, the FASB issued SFAS No.148, “Accounting for Stock-Based Compensation – Transition and Disclosure.” This Statement amends SFAS No.123, “Accounting for Stock-Based Compensation,” and provides alter- native methods of transition for entities that voluntarily convert to the fair value based method of accounting for stock-based employee compensation and requires amended disclosure presentation for the fiscal year ending January 25, 2003 and all subsequent interim periods. We anticipate that the FASB may issue additional guidance or propose additional changes in this area. While we await additional FASB guidance we are continuing to account for stock-based compensation in accordance with APB Opinion No.25. In November 2002, the FASB issued FASB Interpretation No. 45 “Guarantor’s Accounting and Disclosure Require- ments for Guarantees, Including Indirect Guarantees of Indebtedness of Others.” This Interpretation specifies certain disclosures for guarantees issued by an entity and requires recognition and measurement at fair value for certain types of guarantees. We have included the disclosure requirements of the interpretation with regard to guarantees made by TJX in Note L. The recognition and measurement provisions, which we believe will not have a material effect on our financial position or results of operation, are effective for qualifying guarantees issued after December 31, 2002. Reclassifications: We have reclassified certain amounts in prior years’ financial statements for comparative purposes. Major reclassifications include the separate presentation of federal and state income taxes payable on the balance sheets and statements of cash flow and a more detailed presentation of unearned stock compensation within the statements of shareholders’ equity. None of the reclassifications had any impact on net income, current liabilities or total shareholders’ equity as previously reported. 25
  • 11. T H E T J X C O M PA N I E S , I N C . B. LONG-TERM DEBT AND CREDIT LINES The table below presents long-term debt, exclusive of current installments, as of January 25, 2003 and January 26, 2002. Capital lease obligations are separately presented in Note D. January 25, January 26, In Thousands 2003 2002 General corporate debt: Medium term notes, interest at 5.87% on $15,000 maturing October 21, 2003 $ - $ 15,000 Medium term notes, interest at 7.97% on $5,000 maturing September 20, 2004 5,000 5,000 7% unsecured notes, maturing June 15, 2005 (effective interest rate of 7.02% after reduction of the unamortized debt discount of $33 and $47 in fiscal 2003 and 2002, respectively) 99,967 99,953 7.45% unsecured notes, maturing December 15, 2009 (effective interest rate of 7.50% after reduction of unamortized debt discount of $439 and $503 in fiscal 2003 and 2002, respectively) 199,561 199,497 Total general corporate debt 304,528 319,450 Subordinated debt: Zero coupon convertible subordinated notes due February 13, 2021, after reduction of unamortized debt discount of $157,252 and $164,907 in fiscal 2003 and 2002, respectively 360,248 352,593 Total subordinated debt 360,248 352,593 Long-term debt, exclusive of current installments $664,776 $672,043 The aggregate maturities of long-term debt, exclusive of current installments at January 25, 2003 are as follows: In Thousands Long-Term Debt Fiscal Year 2005 $365,248 2006 99,967 2007 - 2008 - Later years 199,561 Aggregate maturities of long-term debt, exclusive of current installments $664,776 The above maturity table assumes that all holders of the zero coupon convertible subordinated notes exercise their put options in fiscal 2005. The note holders also have put options available to them in fiscal 2008 and 2014. If none of the put options are exercised and the notes are not redeemed or converted, the notes will mature in fiscal 2022. In February 2001, TJX issued $517.5 million zero coupon convertible subordinated notes due in February 2021 and raised gross proceeds of $347.6 million. The issue price of the notes represents a yield to maturity of 2% per year. Due to provisions of the first put option on February 13, 2002, we amortized the debt discount assuming a 1.5% yield for fiscal 2002.The notes are subordinated to all existing and future senior indebtedness of TJX.The notes are convertible into 16.9 million shares of common stock of TJX if the sale price of our common stock reaches spec- ified thresholds, if the credit rating of the notes is below investment grade, if the notes are called for redemption or if certain specified corporate transactions occur. The holders of the notes have the right to require us to purchase the notes for $369.0 million, $391.7 million and $441.3 million on February 13, 2004, 2007 and 2013, respectively. The repurchase amounts represent original purchase price plus accrued original issue discount. We may pay the purchase price in cash, TJX stock, or a combination of the two. If the holders exercise their put options, we expect to fund the payment with cash, financing from our short-term credit facility, new long-term borrowings or a combi- nation thereof. At the first put date of February 13, 2002, no holder exercised the put option. In addition, if a change in control of TJX occurs on or before February 13, 2007, each holder may require TJX to purchase for cash all or a portion of such holder’s notes. We may redeem for cash all, or a portion of, the notes at any time on or after February 13, 2007 for the original purchase price plus accrued original issue discount. We used the proceeds for our acceler- ated store roll-out program, investment in our distribution center network, our common stock repurchase program and general corporate purposes. 26
  • 12. T H E T J X C O M PA N I E S , I N C . In December 1999, TJX issued $200 million of 7.45% ten-year notes. The proceeds were used for general corporate purposes, including our ongoing stock repurchase program. TJX periodically enters into financial instruments to manage our cost of borrowing. TJX entered into a rate-lock agreement to hedge the underlying treasury rate of the $200 million ten-year notes, prior to their issuance in December 1999. The cost of this agreement has been deferred and is being amortized to interest expense over the term of the notes and results in an effective rate of 7.60% on the debt. During fiscal 2003, we entered into a $370 million five-year revolving credit facility and a $320 million 364-day revolving credit facility, replacing similar agreements scheduled to expire during fiscal 2003. On March 24, 2003, the 364-day agreement was renewed and increased to $330 million, with substantially all of the other terms and conditions of the original facility remaining unchanged. Our ability to borrow under the agreements is not limited by our debt rating level. The credit facilities do not require any compensating balances however, TJX must maintain certain leverage and fixed charge coverage ratios. Based on our current financial condition, we believe that the possi- bility of non-compliance with these covenants is remote. The revolving credit facilities are used as backup to our commercial paper program. As of January 25, 2003, all $690 million of the revolving credit facilities were available for use. Interest is payable on borrowings at rates equal to or less than prime. There were no short-term borrowings during fiscal 2003. The maximum amount of our U.S. short-term borrowings was $39 million and $330 million in fiscal 2002 and 2001, respectively. The weighted average interest rate on our U.S. short-term borrowings was 5.32% and 6.82% in fiscal 2002 and 2001, respectively. As of January 25, 2003, TJX had credit lines totaling C$40 million for its Canadian subsidiary. The maximum amount outstanding under our Canadian credit lines was C$19.2 million in fiscal 2003, C$22.6 million in fiscal 2002 and C$15.2 million in fiscal 2001. Subsequent to the end of fiscal 2003, our Canadian credit lines were reduced to C$20 million. C. FINANCIAL INSTRUMENTS Effective January 28, 2001, TJX implemented Statement of Financial Accounting Standards (“SFAS”) No.133, “Accounting for Derivative Instruments and Hedging Activities.” This Statement requires that all derivatives be recorded on the balance sheets at fair value. See Note A for a description of TJX’s foreign currency translation and related hedging activity policy. TJX periodically enters into forward foreign currency exchange contracts to obtain an economic hedge on firm U.S. dollar and Euro merchandise purchase commitments made by its foreign subsidiaries. These commitments are typi- cally six months or less in duration. The contracts outstanding at January 25, 2003, cover certain commitments for the first and second quarters of fiscal 2004. TJX elected not to apply hedge accounting rules to these contracts and there- fore includes the change in the fair value of these contracts in earnings as a component of selling, general and administrative expenses.The change in the fair value of these contracts resulted in expense of $2.6 million and income of $855,000 in fiscal 2003 and 2002, respectively. TJX enters forward foreign currency exchange contracts to obtain an economic hedge on certain foreign intercom- pany payables, primarily license fees, for which we elected not to apply hedge accounting rules. Such contracts outstanding at January 25, 2003, cover intercompany payables for the first quarter of fiscal 2004. The change in fair value of these contracts resulted in expense of $1 million in fiscal 2003 and income of $167,000 in fiscal 2002 which is reflected in the related periods’ earnings as a component of selling, general and administrative expenses. TJX also enters into foreign currency forward and swap contracts in both Canadian dollars and British pound ster- ling and accounts for them as a hedge of the investment in and between our foreign subsidiaries. Foreign exchange gains and losses as well as fair value adjustments on the agreements are recognized in other comprehensive income, thereby offsetting translation adjustments associated with our investment in and between our foreign subsidiaries. The change in fair value of the contracts designated as a hedge of the net investment in foreign operations resulted in a loss of $23.2 million that was included in other comprehensive income in fiscal 2003 and a gain of $8.2 million in other comprehensive income in fiscal 2002. The change in the cumulative foreign currency translation adjustment resulted in a gain of $23.0 million and a loss of $8.2 million that was also included as a component of other compre- hensive income in fiscal 2003 and 2002, respectively. TJX also enters derivative contracts, designated as fair value hedges, to hedge certain foreign intercompany payables, primarily debt and related interest. The net impact of hedging activity related to these intercompany payables resulted in losses of $954,000 and $429,000 in fiscal 2003 and 2002, respectively, which is reflected in earnings as a component of selling, general and administrative expenses. 27
  • 13. T H E T J X C O M PA N I E S , I N C . Following is a summary of TJX’s derivative financial instruments and related fair values, outstanding at January 25, 2003: Blended Fair Value Contract Asset In Thousands Pay Receive Rate (Liability) Fair value hedges: Intercompany balances, primarily debt and related interest £ 19,000 U.S.$ 30,024 1.5802 U.S.$ (807) Net asset hedges: C$388,962 U.S.$247,725 0.6369 U.S.$ (5,664) £ 91,000 C$225,817 2.4815 U.S.$ (1,567) Hedge accounting not elected: Merchandise purchase commitments and intercompany balances, primarily license fees C$ 94,696 U.S.$ 60,259 0.6363 U.S.$ (1,945) £ 10,331 U.S.$ 15,910 1.5400 U.S.$ (916) € 12,360 £ 8,087 1.5284 U.S.$ 187 Net fair value (liability) U.S.$(10,712) The fair value of the derivatives is classified as assets or liabilities, current or non-current, based upon valuation results and settlement dates of the individual contracts. Following are the balance sheet classifications of the fair value of our derivatives: January 25, January 26, In Thousands 2003 2002 Current assets $ 197 $ 9,493 Non-current assets 415 2,865 Current (liabilities) (3,871) (92) Non-current (liabilities) (7,453) (34) Net fair value (liability) asset $(10,712) $12,232 TJX’s forward foreign currency exchange and swap contracts require us to make payments of certain foreign curren- cies for receipt of U.S. dollars, Canadian dollars or Euros. All of these contracts except the net asset hedges mature during fiscal 2004. The British pound net asset hedge matures during fiscal 2009; the Canadian dollar net asset hedges have maturities from fiscal 2004 to fiscal 2010. The counterparties to the forward exchange contracts and swap agreements are major international financial insti- tutions and the contracts contain rights of offset, which minimize our exposure to credit loss in the event of nonperformance by one of the counterparties. We do not require counterparties to maintain collateral for these contracts. We periodically monitor our position and the credit ratings of the counterparties and do not anticipate losses resulting from the nonperformance of these institutions. The fair value of our general corporate debt, including current installments, is estimated using discounted cash flow analysis based upon our current incremental borrowing rates for similar types of borrowing arrangements. The fair value of our zero coupon convertible subordinated notes is estimated by obtaining market quotes. The fair value of general corporate debt, including current installments, at January 25, 2003 is $363.9 million versus a carrying value of $319.5 million. The fair value of the zero coupon convertible subordinated notes is $423.7 million versus a carrying value of $360.2 million. These estimates do not necessarily reflect certain provisions or restrictions in the various debt agreements which might affect our ability to settle these obligations. D. C O M M I T M E N T S TJX is committed under long-term leases related to its continuing operations for the rental of real estate and fixtures and equipment. Most of our leases are store operating leases with a ten-year initial term and options to extend for one or more five-year periods. Certain Marshalls leases, acquired in fiscal 1996, had remaining terms ranging up to twenty- five years. Leases for T.K. Maxx are generally for fifteen to twenty-five years with ten-year kick-out options. Many of the leases contain escalation clauses and early termination penalties. In addition, we are generally required to pay insurance, real estate taxes and other operating expenses including, in some cases, rentals based on a percentage of sales. 28
  • 14. T H E T J X C O M PA N I E S , I N C . Following is a schedule of future minimum lease payments for continuing operations as of January 25, 2003: Capital Operating In Thousands Lease Leases Fiscal Year 2004 $ 3,726 $ 536,860 2005 3,726 514,755 2006 3,726 469,822 2007 3,726 425,937 2008 3,726 381,383 Later years 30,397 1,625,522 Total future minimum lease payments 49,027 $3,954,279 Less amount representing interest 18,691 Net present value of minimum capital lease payments $30,336 The capital lease commitment relates to a 283,000-square-foot addition to TJX’s home office facility. Rental payments commenced June 1, 2001, and we recognized a capital lease asset and related obligation equal to the present value of the lease payments of $32.6 million. Rental expense under operating leases for continuing operations amounted to $524.7 million, $446.6 million and $390.6 million for fiscal 2003, 2002 and 2001, respectively. Rental expense includes contingent rent and is reported net of sublease income. Contingent rent was $8.2 million, $6.8 million and $7.0 million in fiscal 2003, 2002 and 2001, respectively; and sublease income was $3.2 million, $3.7 million and $4.2 million in fiscal 2003, 2002 and 2001, respectively. The total net present value of TJX’s minimum operating lease obligations approximates $2,947.0 million as of January 25, 2003, including a current portion of $348.5 million. TJX had outstanding letters of credit totaling $44.6 million as of January 25, 2003 and $23.9 million as of January 26, 2002. Letters of credit are issued by TJX primarily for the purchase of inventory. E . S T O C K C O M P E N S AT I O N P L A N S In the following note, all references to historical awards, outstanding awards and availability of shares for future grants under TJX’s Stock Incentive Plan and related prices per share have been restated, for comparability purposes, to reflect the two-for-one stock split distributed in May 2002. TJX has a stock incentive plan under which options and other stock awards may be granted to its directors, offi- cers and key employees. This plan has been approved by TJX’s shareholders and all stock compensation awards are made under this plan. The Stock Incentive Plan, as amended with shareholder approval, provides for the issuance of up to 109.3 million shares with 21.0 million shares available for future grants as of January 25, 2003. In June 2001, shareholders approved an amendment to the Stock Incentive Plan to permit grants to directors and the Board termi- nated the former Directors’ Stock Option Plan. Under the Stock Incentive Plan, TJX has granted options for the purchase of common stock, generally within ten years from the grant date at option prices of 100% of market price on the grant date. Most options outstanding vest over a three-year period starting one year after the grant, and are exercisable in their entirety three years after the grant date. Outstanding options granted to directors become fully exercisable one year after the date of grant. A summary of the status of TJX’s stock options and related Weighted Average Exercise Prices (“WAEP”) is presented below (shares in thousands): Fiscal Year Ended January 25, 2003 January 26, 2002 January 27, 2001 Shares WAEP Shares WAEP Shares WAEP Outstanding at beginning of year 29,624 $13.10 28,073 $ 9.84 23,664 $ 8.53 Granted 11,395 19.85 10,743 17.48 10,356 10.37 Exercised (2,970) 10.94 (8,432) 7.97 (5,449) 4.92 Forfeitures (853) 15.85 (760) 12.27 (498) 12.29 Outstanding at end of year 37,196 15.28 29,624 13.10 28,073 9.84 Options exercisable at end of year 16,265 $12.12 11,594 $ 10.20 11,760 $ 7.99 TJX realizes an income tax benefit from restricted stock vesting and the exercise of stock options, which results in a decrease in current income taxes payable and an increase in additional paid-in capital. Such benefits amounted to $11.8 million, $30.6 million and $15.9 million for fiscal 2003, 2002 and 2001, respectively. 29
  • 15. T H E T J X C O M PA N I E S , I N C . TJX has adopted the disclosure-only provisions of Statement of Financial Accounting Standards (“SFAS”) No.123, “Accounting for Stock-Based Compensation,” and continues to apply the provisions of Accounting Principles Board Opinion No.25, “Accounting for Stock Issued to Employees,” in accounting for compensation expense under its stock option plans. We grant options at fair market value on the date of the grant; accordingly, no compensation expense has been recognized for the stock options issued during fiscal 2003, 2002 or 2001. Compensation expense deter- mined in accordance with SFAS No.123, net of related income tax effect, would have amounted to $39.7 million, $27.8 million and $19.2 million for fiscal 2003, 2002 and 2001, respectively. Presented below are the unaudited pro forma income from continuing operations, net income and related earn- ings per share showing the effect that stock compensation expenses, determined in accordance with SFAS No.123, would have on reported results. Fiscal Year Ended January 25, January 26, January 27, In Thousands Except Per Share Amounts 2003 2002 2001 Income from continuing operations, as reported $578,388 $540,397 $538,066 Add: Stock-based employee compensation expense included in reported income from continuing operations,net of related tax effects 1,973 1,651 883 Deduct: Total stock-based employee compensation expense determined under fair value based method for all awards, net of related tax effects (41,699) (29,450) (20,112) Pro forma income from continuing operations $538,662 $512,598 $518,837 Earnings per share: Basic – as reported $1.09 $.98 $.94 Basic – pro forma $1.01 $.93 $.90 Diluted – as reported $1.08 $.97 $.93 Diluted – pro forma $1.00 $.92 $.90 Net income, as reported $578,388 $500,397 $538,066 Add: Stock-based employee compensation expense included in reported net income, net of related tax effects 1,973 1,651 883 Deduct: Total stock-based employee compensation expense determined under fair value based method for all awards, net of related tax effects (41,699) (29,450) (20,112) Pro forma net income $538,662 $472,598 $518,837 Earnings per share: Basic – as reported $1.09 $.91 $.94 Basic – pro forma $1.01 $.86 $.90 Diluted – as reported $1.08 $.90 $.93 Diluted – pro forma $1.00 $.85 $.90 For purposes of applying the provisions of SFAS No. 123 for the pro forma calculations, the fair value of each option granted during fiscal 2003, 2002 and 2001 is estimated on the date of grant using the Black-Scholes option pricing model with the following assumptions: dividend yield of .5% in fiscal 2003 and 2002, and 1% in fiscal 2001; expected volatility of 44%, 46% and 48% in fiscal 2003, 2002 and 2001, respectively; a risk-free interest rate of 3.5% in fiscal 2003, 5.0% in fiscal 2002 and 5.2% in fiscal 2001; and expected holding period of six years in all fiscal periods. The weighted average fair value of options granted during fiscal 2003, 2002 and 2001 was $8.93, $8.46 and $5.04 per share, respectively. 30
  • 16. T H E T J X C O M PA N I E S , I N C . The following table summarizes information about stock options outstanding as of January 25, 2003 (shares in thousands): Options Outstanding Options Exercisable Weighted Weighted Weighted Average Average Average Range of Remaining Exercise Exercise Exercise Prices Shares Contract Life Price Shares Price $ 1.6094 - $ 3.1563 547 1.9 years $ 2.30 547 $ 2.30 $ 3.1564 - $ 5.3438 1,508 3.9 years 5.01 1,508 5.01 $ 5.3439 - $ 7.2344 803 4.6 years 7.22 803 7.22 $ 7.2345 - $10.8750 8,620 7.2 years 10.47 5,623 10.52 $10.8751 - $15.2500 4,439 6.6 years 14.62 4,439 14.62 $15.2501 - $19.8500 21,279 9.1 years 18.73 3,345 17.48 Total 37,196 8.0 years $15.28 16,265 $12.12 We modified option grants of our associates lost in the tragedy of September 11, 2001. Unvested awards were vested, and the families were allowed to realize the full economic benefit of the original grants and we provided other bene- fits to the families. During fiscal 2002, we recorded additional compensation expense related to these option modifications and benefits. We do not typically modify awards after the date of grant. TJX has also issued restricted stock and performance-based stock awards under the Stock Incentive Plan. Restricted stock awards are issued at par value, or at no cost, and have restrictions that generally lapse over three to four years from date of grant. Performance-based shares have restrictions that generally lapse over one to four years when and if specified criteria are met.The market value in excess of cost is charged to income ratably over the period during which these awards vest. Such pre-tax charges amounted to $3.2 million, $2.7 million and $1.4 million in fiscal 2003, 2002 and 2001, respectively. The market value of the awards is determined at date of grant for restricted stock awards, and at the date shares are earned for performance-based awards. A combined total of 325,000 shares, 450,000 shares and 20,000 shares for restricted and performance-based awards were issued in fiscal 2003, 2002 and 2001, respectively. There were 66,000 shares forfeited during fiscal 2001; no shares were forfeited during fiscal 2003 or 2002. The weighted average market value per share of these stock awards at grant date was $19.85, $15.00 and $10.38 for fiscal 2003, 2002 and 2001, respectively. TJX maintained a separate deferred stock compensation plan for its outside directors under which deferred share awards valued at $10,000 each were issued annually to outside directors. During fiscal 2003, the Board merged this deferred stock compensation plan into the Stock Incentive Plan, and all deferred shares earned will be issued pursuant to the Stock Incentive Plan. Beginning in June 2003, the annual deferred share award granted to each outside director will be valued at $30,000. As of the end of fiscal 2003, a total of 45,793 deferred shares had been granted under the plan. Actual shares will be issued at termination of service or a change of control. Prior to merging the deferred stock award plan into the Stock Incentive Plan, TJX planned to issue actual shares from shares held in treasury. Currently we have 175,276 shares held in treasury. F. C A P I TA L S T O C K A N D E A R N I N G S P E R S H A R E Capital Stock: TJX distributed a two-for-one stock split, effected in the form of a 100% stock dividend, on May 8, 2002 to shareholders of record on April 25, 2002, which resulted in the issuance of 269.4 million shares of common stock and a corresponding decrease of $269.4 million in retained earnings. All historical earnings per share amounts and reference to common stock activity in the notes have been restated to reflect the two-for-one stock split. During fiscal 2003, we completed our $1 billion stock repurchase program begun in fiscal 2001 and initiated another multi-year $1 billion stock repurchase program. We had cash expenditures under all of our repurchase programs of $481.7 million, $424.2 million and $444.1 million in fiscal 2003, 2002 and 2001, respectively, funded primarily by cash generated from operations. The total common shares repurchased amounted to 25.9 million shares in fiscal 2003, 26.3 million shares in fiscal 2002 and 44.5 million shares in fiscal 2001. As of January 25, 2003, we had repurchased 16.1 million shares of our common stock at a cost of $303.4 million under the current $1 billion stock repurchase program. All shares repurchased have been retired except 87,638 shares purchased in fiscal 2003 and held in treasury. TJX has authorization to issue up to 5 million shares of preferred stock, par value $1. There was no preferred stock issued or outstanding at January 25, 2003. 31
  • 17. T H E T J X C O M PA N I E S , I N C . Earnings Per Share: The following schedule presents the calculation of basic and diluted earnings per share for income from continuing operations: Fiscal Year Ended January 25, January 26, January 27, Amounts In Thousands Except Per Share Amounts 2003 2002 2001 Basic earnings per share: Income from continuing operations $578,388 $540,397 $538,066 Weighted average common stock outstanding for basic earnings per share calculation 532,241 550,647 574,881 Basic earnings per share $1.09 $.98 $.94 Diluted earnings per share: Income from continuing operations $578,388 $540,397 $538,066 Weighted average common stock outstanding for basic earnings per share calculation 532,241 550,647 574,881 Assumed exercise of stock options and awards 5,499 5,621 3,511 Weighted average common shares for diluted earnings per share calculation 537,740 556,268 578,392 Diluted earnings per share $1.08 $.97 $.93 The weighted average common shares for the diluted earnings per share calculation exclude the incremental effect related to outstanding stock options, the exercise price of which is in excess of the related fiscal year’s average price of TJX’s common stock. Such options are excluded because they would have an antidilutive effect. These options amounted to 11.2 million as of January 25, 2003, 10.6 million as of January 26, 2002 and 9.2 million as of January 27, 2001. The 16.9 million shares issuable upon conversion of the zero coupon convertible debt were also excluded from the diluted earnings per share calculation because criteria for conversion had not been met during the fiscal years presented. G . I N C O M E TA X E S The provision for income taxes includes the following: Fiscal Year Ended January 25, January 26, January 27, In Thousands 2003 2002 2001 Current: Federal $218,857 $236,070 $272,075 State 47,894 44,228 51,217 Foreign 20,758 18,119 27,819 Deferred: Federal 57,125 28,133 (22,359) State 5,558 4,071 (2,269) Foreign 9,144 3,026 393 Provision for income taxes $359,336 $333,647 $326,876 In addition to the above provision, in fiscal 2002 TJX also recorded deferred income tax benefits of $26.5 million as a component of a $40 million after-tax charge relating to discontinued operations. 32
  • 18. T H E T J X C O M PA N I E S , I N C . TJX had a net deferred tax (liability) asset as follows: January 25, January 26, In Thousands 2003 2002 Deferred tax assets: Foreign net operating loss carryforward $ 13,108 $ 14,546 Reserve for discontinued operations 21,617 35,277 Reserve for closed store and restructuring costs 4,712 5,824 Pension, postretirement and employee benefits 31,001 34,493 Leases 22,591 21,076 Other 37,307 29,591 Total deferred tax assets 130,336 140,807 Deferred tax liabilities: Property, plant and equipment 62,189 21,143 Safe harbor leases 12,683 13,395 Tradename 42,873 42,873 Undistributed foreign earnings 12,809 - Other 32,790 24,818 Total deferred tax liabilities 163,344 102,229 Net deferred tax (liability) asset $(33,008) $ 38,578 The fiscal 2003 total net deferred tax liability is presented on the balance sheet as a current asset of $9.0 million and a non-current liability of $42.0 million. For fiscal 2002, the net deferred tax asset is presented on the balance sheet as a current asset of $12.0 million and a non-current asset of $26.6 million. TJX has provided for deferred U.S. taxes on all undistributed Canadian earnings. All earnings of TJX’s other foreign subsidiaries are indefinitely reinvested and no deferred taxes have been provided for on those earnings. TJX has a United Kingdom operating loss carryforward of approximately $43.7 million that may be applied against future taxable income in the U.K., all of which has been recognized for financial reporting purposes. The U.K. net operating loss does not expire under current tax law. In fiscal 2003 TJX utilized a Puerto Rico net operating loss carry- forward of approximately $1 million which was acquired in the Marshalls acquisition. No Puerto Rico net operating loss carryforward exists as of January 25, 2003. TJX’s worldwide effective income tax rate was 38.3% for fiscal 2003, 38.2% for fiscal 2002, and 37.8% for fiscal 2001. The difference between the U.S. federal statutory income tax rate and TJX’s worldwide effective income tax rate is reconciled below: Fiscal Year Ended January 25, January 26, January 27, 2003 2002 2001 U.S. federal statutory income tax rate 35.0% 35.0% 35.0% Effective state income tax rate 4.1 3.8 4.0 Impact of foreign operations (.3) (.4) (1.0) All other (.5) (.2) (.2) Worldwide effective income tax rate 38.3% 38.2% 37.8% The additional benefit reflected in “all other” in fiscal 2003 is due to the favorable effect of the tax benefit for payment of executive retirement benefits in exchange for the termination of split-dollar arrangements described in Note H. H. PENSION PLANS AND OTHER RETIREMENT BENEFITS Pension: TJX has a funded defined benefit retirement plan covering the majority of its full-time U.S. employees. Employees who have attained twenty-one years of age and have completed one year of service are covered under the plan. No employee contributions are required and benefits are based on compensation earned in each year of service. We also have an unfunded supplemental retirement plan which covers key employees of the Company and provides additional retirement benefits based on average compensation. Our funded defined benefit retirement plan assets are invested primarily in stock and bonds of U.S. corporations, excluding TJX, as well as various investment funds. 33