SlideShare uma empresa Scribd logo
1 de 29
Baixar para ler offline
The TJX Companies, Inc.

CONSOLIDATED          STATEMENTS          OF    INCOME


                                                                                          Fiscal Year Ended
                                                                            January 30,      January 31,        January 25,
Dollars in Thousands Except Per Share Amounts                                     1999              1998              1997
                                                                                              (53 weeks)
Net sales                                                                  $7,949,101      $7,389,069          $6,689,410
Cost of sales, including buying and occupancy costs                         5,957,415       5,676,541           5,198,783
Selling, general and administrative expenses                                1,285,988       1,185,755           1,087,137
Interest expense, net                                                           1,686           4,502              37,350
Income from continuing operations before
   income taxes and extraordinary item                                       704,012          522,271            366,140
Provision for income taxes                                                   270,810          215,679            152,314
Income from continuing operations
   before extraordinary item                                                 433,202          306,592            213,826

Discontinued operations:
  Income from discontinued operations, net of income taxes                           –                –            29,361
  Gain (loss) on disposal of discontinued
     operations, net of income taxes                                          (9,048)              –             125,556
Income before extraordinary item                                             424,154         306,592             368,743
Extraordinary (charge), net of income taxes                                        –          (1,777)             (5,620)
Net income                                                                   424,154         304,815             363,123
Preferred stock dividends                                                      3,523          11,668              13,741
Net income available to common shareholders                                $ 420,631       $ 293,147           $ 349,382

Basic earnings per share:
  Income from continuing operations
     before extraordinary item                                                  $1.35           $0.92               $ .66
  Net income                                                                    $1.32           $0.91               $1.16
  Weighted average common shares — basic                                  318,073,081     321,474,046         300,926,904

Diluted earnings per share:
  Income from continuing operations
     before extraordinary item                                                  $1.29           $0.88               $ .61
  Net income                                                                    $1.27           $0.87               $1.04
  Weighted average common shares — diluted                                334,647,950     349,612,184         350,650,100

Cash dividends per share                                                        $ .12            $0.10              $ .07

The accompanying notes are an integral part of the financial statements.


2
The TJX Companies, Inc.

CONSOLIDATED          BALANCE        SHEETS


                                                                                    January 30,       January 31,
In Thousands                                                                              1999              1998
Assets
    Current assets:
      Cash and cash equivalents                                                 $ 461,244         $ 404,369
      Accounts receivable                                                           67,345            60,735
      Merchandise inventories                                                    1,186,068         1,190,170
      Prepaid expenses                                                              28,448            27,357
         Total current assets                                                    1,743,105         1,682,631
    Property at cost:
      Land and buildings                                                           115,485           108,729
      Leasehold costs and improvements                                             547,099           480,964
      Furniture, fixtures and equipment                                            711,320           611,470
                                                                                 1,373,904         1,201,163
      Less: accumulated depreciation and amortization                              617,302           515,027
                                                                                   756,602           686,136

    Other assets                                                                    27,436            36,645
    Deferred income taxes                                                           22,386                 –
    Goodwill and tradename, net of amortization                                    198,317           204,220
         Total Assets                                                           $2,747,846        $2,609,632

Liabilities
    Current liabilities:
      Current installments of long-term debt                                    $      694        $   23,360
      Accounts payable                                                             617,159           582,791
      Accrued expenses and other current liabilities                               688,993           611,506
         Total current liabilities                                               1,306,846         1,217,657

    Long-term debt, exclusive of current installments                                220,344           221,024
    Deferred income taxes                                                                  –             6,859

Shareholders’         Equity
    Preferred stock at face value, authorized 5,000,000 shares, par value $1,
      issued and outstanding cumulative convertible stock of
      727,300 shares of 7% Series E at January 31, 1998                                      –          72,730
    Common stock, authorized 600,000,000 shares, par value $1,
      issued and outstanding 322,140,770 and 159,901,247 shares                    322,141           159,901
    Additional paid-in capital                                                           –           198,736
    Accumulated other comprehensive income (loss)                                   (1,529)            3,317
    Retained earnings                                                              900,044           729,408
         Total shareholders’ equity                                              1,220,656         1,164,092
         Total Liabilities and Shareholders’ Equity                             $2,747,846        $2,609,632

The accompanying notes are an integral part of the financial statements.


3
The TJX Companies, Inc.

CONSOLIDATED          STATEMENTS          OF   CASH     FLOWS


                                                                                        Fiscal Year Ended
                                                                          January 30,      January 31,      January 25,
In Thousands                                                                    1999              1998            1997
                                                                                            (53 weeks)
Cash    flows     from    operating       activities:
  Net income                                                              $ 424,154       $ 304,815         $ 363,123
  Adjustments to reconcile net income to net cash
     provided by operating activities:
       (Income) from discontinued operations,
          net of income taxes                                                    –                –           (29,361)
       Loss (gain) on disposal of discontinued operations                    9,048                –          (125,556)
       Extraordinary charge                                                      –            1,777             5,620
       Depreciation and amortization                                       136,531          124,891           126,830
       Property disposals and asset write-downs                              6,037           18,778            25,399
       Other, net                                                           (6,296)          (3,928)             (732)
       Changes in assets and liabilities, excluding
          effect of acquisitions and dispositions:
             (Increase) in accounts receivable                               (6,610)         (3,460)          (2,131)
             (Increase) decrease in merchandise inventories                   4,102        (130,665)         198,983
             (Increase) decrease in prepaid expenses                         (1,091)        (10,978)              27
             Increase in accounts payable                                    34,368          48,846           95,677
             Increase in accrued expenses
                and other current liabilities                               62,491           39,184           11,928
             (Decrease) in deferred income taxes                           (19,965)          (3,793)          (5,344)
Net cash provided by operating activities                                  642,769          385,467          664,463

Cash    flows     from    investing       activities:
  Property additions                                                       (207,742)       (192,382)         (119,153)
  Proceeds from sale of other assets                                          9,421          15,697                 –
  Acquisition of Marshalls, net of cash acquired                                  –               –           (49,327)
  Proceeds from (adjustments to) sale
     of discontinued operations                                                   –         (33,190)         222,800
Net cash provided by (used in) investing activities                        (198,321)       (209,875)          54,320

Cash    flows     from    financing       activities:
  Principal payments on long-term debt                                      (23,360)        (27,179)          (46,506)
  Prepayment of long-term debt                                                    –               –          (455,560)
  Proceeds from sale and issuance of common stock, net                       27,763          15,471            34,395
  Stock repurchased                                                        (350,319)       (245,198)                –
  Cash dividends                                                            (41,657)        (43,500)          (35,019)
Net cash (used in) financing activities                                    (387,573)       (300,406)         (502,690)
Net cash provided by (used in) continuing operations                         56,875        (124,814)          216,093
Net cash provided by discontinued operations                                      –          54,451            49,413
Net increase (decrease) in cash and cash equivalents                         56,875         (70,363)          265,506
Cash and cash equivalents at beginning of year                              404,369         474,732           209,226
Cash and cash equivalents at end of year                                  $ 461,244       $ 404,369         $ 474,732

The accompanying notes are an integral part of the financial statements.


4
The TJX Companies, Inc.

CONSOLIDATED          STATEMENTS          OF   SHAREHOLDERS’              EQUITY

                                                                                              Accumulated
                                                   Preferred       Common         Additional        Other
                                                       Stock     Stock, Par          Paid-in Comprehensive    Retained
In Thousands                                      Face Value       Value $1         Capital Income (Loss)     Earnings        Total
Balance, January 27, 1996                         $282,500       $ 72,486     $ 270,839          $(1,680) $ 140,489 $ 764,634
   Comprehensive income:
      Net income                                            –             –               –            –     363,123      363,123
      Foreign currency translation                          –             –               –          642           –          642
   Total comprehensive income                                                                                             363,765
   Cash dividends:
      Preferred stock                                       –             –               –             –     (13,741)     (13,741)
      Common stock                                          –             –               –             –     (21,278)     (21,278)
   Conversion of cumulative preferred
      stock into common stock:
         Series A                                     (25,000)      1,190           23,810              –           –            –
         Series C                                     (82,500)      3,178           79,322              –           –            –
         Series D                                     (25,000)      1,350           23,650              –           –            –
   Issuance of common stock under stock
      incentive plans and related tax benefits              –       1,372           32,786              –           –      34,158
   Other                                                    –           –             (352)             –           –        (352)

Balance, January 25, 1997                          150,000         79,576         430,055          (1,038)   468,593     1,127,186
   Comprehensive income:
      Net income                                            –             –               –            –     304,815      304,815
      Foreign currency translation                          –             –               –         (643)          –         (643)
      Unrealized gains on securities                        –             –               –        4,998           –        4,998
   Total comprehensive income                                                                                             309,170
   Cash dividends:
      Preferred stock                                       –             –               –             –     (11,668)     (11,668)
      Common stock                                          –             –               –             –     (31,832)     (31,832)
   Conversion of cumulative Series E
      preferred stock into common stock               (77,020)      8,315           68,705              –           –            –
   Stock repurchased:
      Preferred                                          (250)           –               –              –        (500)        (750)
      Common                                                –       (8,528)       (235,920)             –           –     (244,448)
   Stock split, two-for-one                                 –      79,823          (79,823)             –           –            –
   Issuance of common stock under stock
      incentive plans and related tax benefits              –         715           15,719              –           –      16,434

Balance, January 31, 1998                             72,730      159,901         198,736          3,317     729,408     1,164,092
   Comprehensive income:
      Net income                                            –             –               –             –    424,154      424,154
      Foreign currency translation                          –             –               –           152          –           152
      Reclassification of unrealized gains                  –             –               –        (4,998)         –        (4,998)
   Total comprehensive income                                                                                             419,308
   Cash dividends:
      Preferred stock                                       –             –               –             –      (3,523)      (3,523)
      Common stock                                          –             –               –             –     (38,134)     (38,134)
   Conversion of cumulative Series E
      preferred stock into common stock               (72,730)      14,682          58,048              –           –            –
   Common stock repurchased                                 –      (12,998)       (187,859)             –    (149,462)    (350,319)
   Stock split, two-for-one                                 –     158,954          (96,555)             –     (62,399)           –
   Issuance of common stock under stock
      incentive plans and related tax benefits              –       1,602           27,630              –           –      29,232

Balance, January 30, 1999                         $         –    $322,141     $           –      $(1,529) $ 900,044 $1,220,656

The accompanying notes are an integral part of the financial statements.


5
The TJX Companies, Inc.

SELECTED       INFORMATION           BY   MAJOR       BUSINESS        SEGMENT


                                                                                                Fiscal Year Ended
                                                                               January 30,         January 31,        January 25,
In Thousands                                                                         1999                 1998              1997
                                                                                                    (53 weeks)
Net sales:
  Off-price family apparel stores                                            $7,816,563          $7,290,959         $6,602,391
  Off-price home fashion stores                                                 132,538              98,110             87,019
                                                                             $7,949,101          $7,389,069         $6,689,410
Operating income (loss):
  Off-price family apparel stores                                            $ 782,706           $ 596,908          $ 463,419
  Off-price home fashion stores (1)                                             (4,950)             (8,615)           (14,018)
                                                                               777,756             588,293            449,401
General corporate expense (2)                                                   69,449              58,906             43,297
Goodwill amortization                                                            2,609               2,614              2,614
Interest expense, net                                                            1,686               4,502             37,350
Income from continuing operations
   before income taxes and extraordinary item                                $ 704,012           $ 522,271          $ 366,140

Identifiable assets:
   Off-price family apparel stores                                           $2,093,879          $2,033,945         $1,801,779
   Off-price home fashion stores                                                 49,515              39,074             36,493
                                                                      (3)
   Corporate, primarily cash, goodwill and deferred taxes                       604,452             536,613            668,489
                                                                             $2,747,846          $2,609,632         $2,506,761
Capital expenditures:
  Off-price family apparel stores                                            $ 202,054           $ 190,720          $ 104,955
  Off-price home fashion stores                                                  5,688               1,662                731
  Corporate (3)                                                                      –                   –             13,467
                                                                             $ 207,742           $ 192,382          $ 119,153
Depreciation and amortization:
  Off-price family apparel stores                                            $ 130,325           $ 115,967          $ 113,479
  Off-price home fashion stores                                                  3,302               3,186              2,104
  Corporate, including goodwill (3)                                              2,904               5,738             11,247
                                                                             $ 136,531           $ 124,891          $ 126,830

(1) The periods ended January 30, 1999, January 31, 1998, and January 25, 1997 include a charge of $2.2 million, $1.5 million and
    $3.1 million, respectively, for certain store closings and other restructuring costs relating to HomeGoods.

(2) General corporate expense for the fiscal year ended January 30, 1999 includes a pre-tax charge of $6.3 million for costs
    associated with a fiscal 1998 executive deferred compensation award and a $7.5 million charitable donation to The TJX Foun-
    dation. General corporate expense for the fiscal year ended January 31, 1998 includes a pre-tax charge of $15.2 million for
    costs associated with the foregoing executive deferred compensation award and a pre-tax gain of $6 million for the sale of
    Brylane, Inc. common stock. General corporate expense for the fiscal year ended January 25, 1997 includes the net operating
    results of T.K. Maxx. Fiscal years 1999 and 1998 include the operating results of T.K. Maxx in the off-price family apparel
    stores segment.

(3) The period ended January 25, 1997 includes assets and activity of T.K. Maxx. Fiscal years 1999 and 1998 include T.K. Maxx in
    the off-price family apparel stores segment.


6
The TJX Companies, Inc.

NOTES    TO    CONSOLIDATED       FINANCIAL       STATEMENTS


Summary       of   Accounting    Policies
                  The Company’s fiscal year ends on the last Saturday in January. The fiscal year ended Janu-
Fiscal   Year:
ary 31, 1998 (fiscal 1998) included 53 weeks. The fiscal years ended January 30, 1999 and January 25, 1997
each included 52 weeks.

         o f P r e s e n t a t i o n : The consolidated financial statements of The TJX Companies, Inc. include
Basis
the financial statements of all the Company’s wholly-owned subsidiaries, including its foreign
subsidiaries. The financial statements for the applicable periods present the Company’s former Chad-
wick’s and Hit or Miss divisions as discontinued operations. The notes pertain to continuing operations
except where otherwise noted.
   The preparation of the financial statements, in conformity with generally accepted accounting
principles, requires management to make estimates and assumptions that affect the reported amounts of
assets and liabilities, and disclosure of contingent liabilities, at the date of the financial statements as
well as the reported amounts of revenues and expenses during the reporting period. Actual results could
differ from those estimates.

        E q u i v a l e n t s : The Company generally considers highly liquid investments with an initial matu-
Cash
rity of three months or less to be cash equivalents. The Company’s investments are primarily high grade
commercial paper, institutional money market funds and time deposits with major banks. The fair value of
cash equivalents approximates carrying value.

                 I n v e n t o r i e s : Inventories are stated at the lower of cost or market. The Company uses
Merchandise
the retail method for valuing inventories on the first-in first-out basis.

                   a n d A m o r t i z a t i o n : For financial reporting purposes, the Company provides for
Depreciation
depreciation and amortization of property principally by the use of the straight-line method over the esti-
mated useful lives of the assets. Buildings are depreciated over 33 years, leasehold costs and improvements
are generally amortized over the lease term or their estimated useful life, whichever is shorter, and furni-
ture, fixtures and equipment are depreciated over 3 to 10 years. Maintenance and repairs are charged to
expense as incurred. Upon retirement or sale, the cost of disposed assets and the related depreciation are
eliminated and any gain or loss is included in net income. Debt discount and related issue expenses are
amortized over the lives of the related debt issues. Pre-opening costs are expensed as incurred.

G o o d w i l l a n d T r a d e n a m e : Goodwill is primarily the excess of the purchase price incurred over the
carrying value of the minority interest in the Company’s former 83%-owned subsidiary. The minority interest
was acquired pursuant to the Company’s fiscal 1990 restructuring. In addition, goodwill includes the excess
of cost over the estimated fair market value of the net assets of Winners Apparel Ltd., acquired by the
Company effective May 31, 1990. Goodwill totaled $79.3 million, net of amortization, as of January 30, 1999
and is being amortized over 40 years. Annual amortization of goodwill was $2.6 million in fiscal years 1999,
1998 and 1997. Cumulative amortization as of January 30, 1999 and January 31, 1998 was $25.1 million and
$22.5 million, respectively.


7
Tradename is the value assigned to the name “Marshalls” as a result of the Company’s acquisition of the
Marshalls chain on November 17, 1995. The final allocation of the purchase price of Marshalls, pursuant to
the purchase accounting method, resulted in $130.0 million being allocated to the tradename. The value of
the tradename was determined by the discounted present value of assumed after-tax royalty payments, offset
by a reduction for its pro-rata share of the total negative goodwill acquired (see Note A). The tradename is
deemed to have an indefinite life and accordingly is being amortized over 40 years. Amortization expense was
$3.2 million, $3.4 million and $3.7 million for fiscal years 1999, 1998 and 1997, respectively. Cumulative
amortization as of January 30, 1999 and January 31, 1998 was $11.0 million and $7.8 million, respectively.

I m p a i r m e n t o f L o n g - L i v e d A s s e t s : The Company periodically reviews the value of its property
and intangible assets in relation to the current and expected operating results of the related business
segments in order to assess whether there has been a permanent impairment of their carrying values.
    During the fiscal year ended January 25, 1997, the Company recorded a $12.2 million impairment
charge, relating to the T.J. Maxx distribution facilities, which has been included in selling, general and
administrative expenses.

                            The Company expenses advertising costs during the fiscal year incurred.
Advertising       Costs:


              P e r S h a r e : Statement of Financial Accounting Standards (SFAS) No. 128 “Earnings per
Earnings
Share” requires the presentation of “basic” and “diluted” earnings per share. Basic earnings per share is
based on a simple weighted average of common stock outstanding. Diluted earnings per share includes the
dilutive effect of convertible securities and other common stock equivalents. See Note F for a computation
of basic and diluted earnings per share. All earnings per share amounts discussed refer to diluted earnings
per share unless otherwise indicated. Prior period earnings per share amounts have been restated for the
June 1998 and June 1997 two-for-one stock splits.

F o r e i g n C u r r e n c y T r a n s l a t i o n : The Company’s foreign assets and liabilities are translated at the
year-end exchange rate and income statement items are translated at the average exchange rates prevailing
during the year. A large portion of the Company’s net investment in foreign operations is hedged with foreign
currency swap agreements and forward contracts. The translation adjustment associated with the foreign
operations and the related hedging instruments are included in shareholders’ equity as a component of
comprehensive income (loss). Cumulative foreign currency translation adjustments included in shareholders’
equity amounted to losses of $1.5 million as of January 30, 1999 and $1.7 million as of January 31, 1998.

                                      During 1997, the Financial Accounting Standards Board (FASB)
New    Accounting       Standards:
issued Statement of Financial Accounting Standards (SFAS) No. 130, “Reporting Comprehensive Income.”
This Statement specifies the computation, presentation and disclosures for components of comprehensive
income. The Company adopted SFAS No. 130 in the first quarter ended May 2, 1998 and presents compre-
hensive income as a component of shareholders’ equity.
    Also during 1997, the FASB issued SFAS No. 131, “Disclosure about Segments of an Enterprise and
Related Information.” This new standard did not result in any changes to the Company’s reportable
segments or in the information disclosed about its segments (see Note L).
    During 1998, the FASB issued SFAS No. 133, “Accounting for Derivative Instruments and Hedging
Activities.” This Statement established accounting and reporting standards for derivative instruments,
including certain derivative instruments embedded in other contracts, and for hedging activities. This State-
ment requires that an entity recognize all derivatives as either assets or liabilities in the statements of finan-
cial position and measure those instruments at fair value. The Company believes that the impact of
implementation of this new standard will be immaterial. The Company will adopt SFAS No. 133 in its fiscal
year ending January 27, 2001 or earlier.

          Certain amounts in prior years’ financial statements have been reclassified for comparative purposes.
Other:


8
A.   Dispositions      and   Acquisitions
        o f C h a d w i c k ’ s o f B o s t o n : During the fourth quarter of fiscal 1997, the Company sold its
Sale
Chadwick’s of Boston catalog division to Brylane, L.P. (Brylane). Proceeds of approximately $300 million
included cash, a 10 year $20 million Convertible Subordinated Note at 6% interest (the “Brylane note”) and
Chadwick’s consumer credit card receivables. During fiscal 1998, the Company paid Brylane $33.2 million
as a final settlement of the sale proceeds based upon the final closing balance sheet of Chadwick’s as of
December 7, 1996. Also, pursuant to the disposition, the Company agreed to purchase certain amounts of
excess inventory from Chadwick’s through fiscal 2000. This arrangement has subsequently been amended
and extended through fiscal 2002. The results of Chadwick’s for all periods prior to December 7, 1996 have
been reclassified to discontinued operations. The cash provided by discontinued operations for fiscal 1998
represents the collection of the remaining balance of the Chadwick’s consumer credit card receivables
outstanding as of January 25, 1997. During fiscal 1998, the Company converted a portion of the Brylane note
into 352,908 shares of Brylane, Inc. common stock which it sold for $15.7 million. This sale resulted in an
after-tax gain of $3.6 million, or $.01 per share. During fiscal 1999 the balance of the note was converted into
shares of Brylane common stock. A portion of the shares were donated to the Company’s charitable founda-
tion, and the remaining shares were sold. The net pre-tax impact of these transactions was immaterial.
   The Chadwick’s of Boston catalog division had net sales of $464.8 million and recorded income from opera-
tions of $29.4 million, net of income taxes of $20.9 million, for the fiscal year ended January 25, 1997, which
represents this division’s results through December 7, 1996, the effective date of the transaction. The results of
Chadwick’s for all periods prior to December 7, 1996 have been reclassified to discontinued operations. The
sale of the division resulted in a gain on disposal of $125.6 million, net of income taxes of $15.2 million, or $.36
per share. This gain allowed the Company to utilize its $139 million capital loss carry forward. Interest expense
was allocated to discontinued operations based on their respective proportion of assets to total assets.

        o f H i t o r M i s s : Effective September 30, 1995, the Company sold its Hit or Miss division to
Sale
members of Hit or Miss management and outside investors. The Company received $3 million in cash and
a 7 year $10 million note with interest at 10%. During fiscal 1998, the Company forgave a portion of this
note and was released from certain obligations and guarantees which reduced the note to $5.5 million.
During fiscal 1999 the Company settled the note for $2.0 million, the balance of $3.5 million was charged
to selling, general and administrative expenses.

                  o f M a r s h a l l s : On November 17, 1995, the Company acquired the Marshalls family
Acquisition
apparel chain from Melville Corporation. The Company paid $424.3 million in cash and $175 million
in junior convertible preferred stock. The total purchase price of Marshalls, including acquisition costs
of $6.7 million, was $606 million.
   The acquisition has been accounted for using the purchase method of accounting and accordingly, the
purchase price has been allocated to the assets purchased and the liabilities assumed based upon their fair
values at the date of acquisition. The purchase accounting method allows a one year period to finalize the
fair values of the net assets acquired. No further adjustments to fair market values are made after that point.
The final allocation of purchase price resulted in the fair value of the net assets acquired exceeding the
purchase price, creating negative goodwill of $86.4 million. The negative goodwill was allocated to the long-
term assets acquired. During fiscal 1998, the store closing and restructuring reserve established in the final
allocation of the purchase price was reduced by an additional $15.8 million as the Company closed fewer
stores than initially planned. The $15.8 million reserve reduction was offset by a reduction of $10.0 million
to property, plant and equipment and a reduction of $5.8 million to tradename. The final allocation of
purchase price, as adjusted for the reserve adjustment in fiscal 1998, is summarized below:
In Thousands
Current assets                                                                                           $ 718,627
Property, plant and equipment                                                                              227,071
Tradename                                                                                                  130,046
Current liabilities                                                                                       (469,744)
Total purchase price                                                                                     $ 606,000

The operating results of Marshalls have been included in the consolidated results of the Company from the
date of acquisition on November 17, 1995.

9
B.   Long-Term     Debt   and   Credit    Lines
At January 30, 1999 and January 31, 1998, long-term debt, exclusive of current installments, consisted of
the following:
                                                                                       January 30,      January 31,
In Thousands                                                                                 1999             1998
Equipment notes, interest at 11% to 11.25% maturing
  December 12, 2000 to December 30, 2001                                               $       433      $   1,127
General corporate debt:
  Medium term notes, interest at 5.87% to 7.97%, $15 million maturing on
     October 21, 2003 and $5 million on September 20, 2004                               20,000           20,000
  65⁄8% unsecured notes, maturing June 15, 2000                                         100,000          100,000
  7% unsecured notes, maturing June 15, 2005 (effective interest rate
     of 7.02% after reduction of the unamortized debt discount of
     $89,000 and $103,000 in fiscal 1999 and 1998, respectively)                         99,911           99,897
        Total general corporate debt                                                    219,911          219,897
Long-term debt, exclusive of current installments                                      $220,344         $221,024

The aggregate maturities of long-term debt, exclusive of current installments, at January 30, 1999 are as follows:

                                                                                            General
                                                                       Equipment           Corporate
In Thousands                                                               Notes               Debt           Total
Fiscal Year
2001                                                                       $348        $100,000         $100,348
2002                                                                         85               –               85
2003                                                                          –               –                –
2004                                                                          –          15,000           15,000
Later years                                                                   –         104,911          104,911
Aggregate maturities of long-term debt,
exclusive of current installments                                          $433        $219,911         $220,344

On September 16, 1996, pursuant to a call for redemption, the Company prepaid $88.8 million of its 91⁄2%
sinking fund debentures. The Company recorded an after-tax extraordinary charge of $2.9 million, or $.01
per common share, related to the early retirement of this debt. The Company paid the outstanding balance
of $8.5 million during fiscal 1998 utilizing an optional sinking fund payment under the indenture.
   In June 1995, the Company filed a shelf registration statement with the Securities and Exchange Commission
which provided for the issuance of up to $250 million of long-term debt. This shelf registration statement
was replaced by a new shelf registration statement filed in fiscal 1997 which currently provides for the
issuance of up to $600 million of debt, common stock or preferred stock. In June 1995, the Company issued
$200 million of long-term notes under the original registration statement; $100 million of 6 5⁄8% notes due
June 15, 2000 and $100 million of 7% notes due June 15, 2005. The proceeds were used in part to repay
short-term borrowings and for general corporate purposes, including the repayment of scheduled maturities
of other outstanding long-term debt and for new store and other capital expenditures.
   On November 17, 1995, the Company entered into an unsecured $875 million bank credit agreement
under which the Company borrowed $375 million on a term loan basis to fund the cash portion of the
Marshalls purchase price. During the fourth quarter of the fiscal year ended January 25, 1997, the Company
prepaid the outstanding balance of the $375 million term loan and recorded an after-tax extraordinary
charge of $2.7 million, or $.01 per share, for the early retirement of this debt. The agreement also allowed
the Company to borrow up to an additional $500 million on a revolving loan basis to fund the working capi-
tal needs of the Company. In September 1997, the Company replaced this $500 million revolving credit
agreement with a new five year $500 million revolving credit facility. The Company recorded an extraordi-
nary charge of $1.8 million associated with the write-off of deferred financing costs of the former agreement.


10
The new agreement provides for reduced commitment fees on the unused portion of the line, as well as
lower borrowing costs and has certain financial covenants which include a minimum net worth requirement,
and certain leverage and fixed charge covenants.
   As of January 30, 1999, all $500 million of the revolving credit facility was available for use. Interest is
payable on borrowings at rates equal to or less than prime. The revolving credit facility is used as backup
to the Company’s commercial paper program. The Company had no short-term borrowings under this facil-
ity or its commercial paper program during fiscal 1999 or 1998. Excluding the Company’s foreign
subsidiaries, the weighted average interest rate on the Company’s short-term borrowings under the former
agreement was 5.81% in fiscal 1997. The Company does not have any compensating balance requirements
under these arrangements. The Company also has C$40 million of credit lines for its Canadian operation,
all of which were available as of January 30, 1999.

C.   Financial   Instruments
The Company periodically enters into forward foreign exchange contracts to hedge firm U.S. dollar
merchandise purchase commitments made by its foreign subsidiaries. As of January 30, 1999, the Company
had $18.8 million of such contracts outstanding for its Canadian subsidiary and $3.3 million for its
subsidiary in the United Kingdom. The contracts cover certain commitments for the first quarter of fiscal
2000 and any gains or losses on the contracts will ultimately be reflected in the cost of the merchandise.
Deferred gains and losses on the contracts as of January 30, 1999 were immaterial.
   The Company also has entered into several foreign currency swap and forward contracts in both Cana-
dian dollars and British pounds sterling. Both the swap and forward agreements are accounted for as a
hedge against the Company’s investment in foreign subsidiaries; thus, foreign exchange gains and losses on
the agreements are recognized in shareholders’ equity thereby offsetting translation adjustments associated
with the Company’s investment in foreign operations. The gains and losses on this hedging activity as of
January 30, 1999 are immaterial.
   The Canadian swap and forward agreements will require the Company to pay C$41.7 million in exchange
for $31.2 million in U.S. currency between October 2003 and September 2004. The British pounds sterling
swap and forward agreements will require the Company to pay £59.9 million between October 1999 and
September 2002 in exchange for $94.1 million in U.S. currency.
   The agreements contain rights of offset which minimize the Company’s exposure to credit loss in the
event of nonperformance by one of the counterparties. The interest rates payable on the foreign currency
swap agreements are slightly higher than the interest rates receivable on the currency exchanged, resulting
in deferred interest costs which are being amortized to interest expense over the term of the related agree-
ments. The premium costs or discounts associated with the forward contracts are being amortized over the
term of the related agreements and are included with the gains or losses of the hedging instrument. The
unamortized balance of the net deferred costs was $3.2 million and $4.3 million as of January 30, 1999 and
January 31, 1998, respectively.
   The counterparties to the exchange contracts and swap agreements are major international financial
institutions. The Company periodically monitors its position and the credit ratings of the counterparties and
does not anticipate losses resulting from the nonperformance of these institutions.
   The fair value of the Company’s long-term debt, including current installments, is estimated using
discounted cash flow analysis based upon the Company’s current incremental borrowing rates for similar
types of borrowing arrangements. The fair value of long-term debt, including current installments, at
January 30, 1999 is estimated to be $234.7 million compared to a carrying value of $221.0 million. These
estimates do not necessarily reflect certain provisions or restrictions in the various debt agreements which
might affect the Company’s ability to settle these obligations.


11
D.   Commitments
The Company is committed under long-term leases related to its continuing operations for the rental of real
estate, and fixtures and equipment. T.J. Maxx leases are generally for a ten year initial term with options to
extend for one or more five year periods. Marshalls leases, acquired in fiscal 1996, have remaining terms
ranging up to twenty-five years. In addition, the Company is generally required to pay insurance, real estate
taxes and other operating expenses including, in some cases, rentals based on a percentage of sales.
   Following is a schedule of future minimum lease payments for continuing operations as of January 30, 1999:

In Thousands                                                                                     Operating Leases
Fiscal Year
2000                                                                                                 $ 328,187
2001                                                                                                    311,247
2002                                                                                                    284,097
2003                                                                                                    260,927
2004                                                                                                    229,949
Later years                                                                                           1,040,217
Total future minimum lease payments                                                                  $2,454,624

The rental expense under operating leases for continuing operations amounted to $318.1 million,
$301.9 million and $293.5 million for fiscal years 1999, 1998 and 1997, respectively. The present value of
the Company’s operating lease obligations approximates $1,693.3 million as of January 30, 1999, including
$199.0 million payable in fiscal 2000.
   The Company had outstanding letters of credit in the amount of $40.4 million as of January 30, 1999.
Letters of credit are issued by the Company primarily for the purchase of inventory.

E.   Stock     Compensation    Plans
In the following note, all references to historical awards, outstanding awards and availability of shares for
future grants under the Company’s Stock Incentive Plan and related prices per share have been restated, for
comparability purposes, for the two-for-one stock splits distributed in June 1998 and June 1997.
   The Company has a Stock Incentive Plan under which options and other stock awards may be granted to
certain officers and key employees. The Stock Incentive Plan, as amended, provides for the issuance of up
to 42 million shares with 15.7 million shares available for future grants as of January 30, 1999. The Company
also has a Directors’ Stock Option Plan under which stock options are granted to directors who are not
otherwise employed by the Company. This plan provides for the issuance of up to 200,000 shares. There are
94,000 shares available for future grants under this plan as of January 30, 1999.
   Under its stock option plans, the Company has granted options for the purchase of common stock, gener-
ally within ten years from the grant date at option prices of 100% of market price on the grant date. Most
options outstanding are exercisable at various percentages starting one year after the grant, while certain
options are exercisable in their entirety three years after the grant date. Options granted to directors become
fully exercisable one year after the date of grant.
   A summary of the status of the Company’s stock options and related Weighted Average Exercise Prices
(“WAEP”), adjusted for the two-for-one stock splits distributed in June 1998 and June 1997 is presented
below (shares in thousands):

                                                                     Fiscal Year Ended
                                             January 30, 1999        January 31, 1998         January 25, 1997
                                            Shares        WAEP      Shares         WAEP      Shares        WAEP
Outstanding, beginning of year            10,507       $ 9.04       8,192       $ 6.10     11,248         $4.59
Granted                                    1,964        21.77       4,338        12.97      2,852          8.72
Exercised                                 (2,215)        6.31      (1,756)        5.31     (5,448)         4.45
Canceled                                    (151)       13.35        (267)        7.31       (460)         4.95
Outstanding, end of year                  10,105       $12.04      10,507       $ 9.04      8,192         $6.10
Options exercisable, end of year           4,796                    3,932                   3,412


12
The Company realizes an income tax benefit from the exercise of stock options. This benefit results in a
decrease in current income taxes payable and an increase in additional paid-in capital. Such benefits amounted
to $13.8 million, $6.1 million and $10.2 million for the fiscal years ended January 30, 1999, January 31, 1998
and January 25, 1997, respectively.
   The Company has adopted the disclosure-only provisions of Statement of Financial Accounting Standards
(SFAS) No. 123, “Accounting for Stock-Based Compensation,” and continues to apply the provisions of APB
Opinion No. 25, “Accounting for Stock Issued to Employees,” in accounting for compensation expense under
its stock option plans. The Company grants options at fair market value on the date of the grant; accord-
ingly, no compensation expense has been recognized for the stock options issued during fiscal years 1999,
1998 or 1997. Had compensation expense been determined in accordance with SFAS No. 123, the
Company’s income from continuing operations, net income and related earnings per share amounts would
have been reduced to the unaudited pro forma amounts indicated below:
                                                                                                Unaudited Pro Forma
                                                                                                 Fiscal Year Ended
                                                                                  January 30,       January 31,        January 25,
Dollars in Thousands Except Per Share Amounts                                           1999               1998              1997
                                                                                                     (53 weeks)
Income from continuing operations before extraordinary item                       $424,512          $301,129          $211,893
  Per diluted share                                                               $   1.27          $    .86          $    .60

Net income                                                                        $415,464          $299,352          $361,190
  Per diluted share                                                               $   1.24          $    .85          $   1.03

For purposes of applying the provisions of SFAS No. 123 for the pro forma calculations, the fair value of each
option grant issued during fiscal 1999, 1998 and 1997 is estimated on the date of grant using the Black-
Scholes option pricing model with the following assumptions: dividend yield 1% in 1999, 1998 and 1997,
expected volatility of 40% in fiscal 1999 and 38% in both fiscal 1998 and 1997, a risk-free interest rate of 5.0%
in fiscal 1999, 5.8% in fiscal 1998 and 6.7% in fiscal 1997, and expected holding periods of six years in all
fiscal periods. The weighted average fair value of options granted during fiscal 1999, 1998 and 1997 was
$9.28, $5.52 and $3.88 per share, respectively.
   The effects of applying SFAS No. 123 in this pro forma disclosure are not indicative of future amounts.
SFAS No. 123 does not apply to awards prior to 1995, and additional awards in future years are anticipated.
   The following table summarizes information about stock options outstanding as of January 30, 1999
(shares in thousands):
                                                           Options Outstanding                             Options Exercisable
                                                         Weighted Average
Range of                                                       Remaining Weighted Average                        Weighted Average
Exercise Prices                                 Shares       Contract Life     Exercise Price           Shares      Exercise Price
$ 2.5625–$ 6.3125                           2,209             5.3   Years            $ 4.73             2,209            $ 4.73
$ 6.3126–$10.6875                           3,255             7.7   Years              9.56             1,847              9.36
$10.6876–$14.4688                           2,694             8.5   Years             14.01               740             14.42
$14.4689–$23.9375                           1,947             9.6   Years             21.77                 –                 –
             Total                         10,105             7.8   Years            $12.04             4,796            $ 8.01

During fiscal 1998, a special deferred compensation award was granted to the Company’s Chief Executive
Officer initially denominated in 900,000 shares of the Company’s stock with a fair value of $10.69 per share
at the date of grant. The shares vested at the time of the grant and the Company recorded a deferred
compensation charge of $9.6 million at the time of the grant. The executive may elect to have such grant
denominated into other investments. The Company does not anticipate that the shares will be issued and
therefore does not consider them for diluted earnings per share calculations and adjusts the compensation
charge for changes in the market value of the stock through the date an election is made to denominate into
other investments. The Company recorded additional expense of $6.3 and $5.6 million in fiscal 1999 and
1998, respectively, due to the increase in market value of the shares of Company stock from date of grant.
During fiscal 1999 elections were made to denominate 650,000 shares of Company stock into other invest-
ments. The Company separately transfers funds to a trust in an amount equal to the value of the executive’s
new investment elections. The trust assets, included with other assets on the balance sheet, are invested in
a manner that matches the elections made by the executive.
13
The Company has also issued restricted stock and performance based stock awards under the Stock
Incentive Plan. Restricted stock awards are issued at par value, or at no cost, and have restrictions which
generally lapse over three to five years from date of grant. At January 31, 1998, the performance based
stock awards had either vested or been forfeited. The market value in excess of cost is charged to income
ratably over the period during which these awards vest, such pre-tax charges amounted to $600,000, $2.7
million and $2.5 million in fiscal years 1999, 1998 and 1997, respectively. The market value of the awards
is determined at date of grant for restricted stock awards, and at the date shares are earned for performance
based awards.
   There has been a combined total of 4,000 shares, 1,023,834 shares and 70,000 shares for deferred,
restricted and performance based awards issued for the fiscal years ended January 1999, 1998 and 1997,
respectively. There were 300,000 shares forfeited for the fiscal year ended January 1998, no shares were
forfeited during fiscal years ended January 1999 or 1997. The weighted average market value per share of
these stock awards at grant date was $18.03, $10.89 and $5.99 for fiscal 1999, 1998 and 1997, respectively.
   During fiscal 1998, the Company formed a deferred stock compensation plan for its outside directors
which replaced the Company’s retirement plan for directors. Each director’s deferred stock account has
been credited with deferred stock to compensate for the value of such director’s accrued retirement benefit.
Additional share awards valued at $10,000 are issued annually to each eligible director. Currently there are
24,966 deferred shares outstanding, actual shares will be issued at retirement. The Company has 100,000
shares held in treasury from which the Company will issue such shares.

F.   Capital   Stock    and   Earnings     Per   Share
                       The Company distributed a two-for-one stock split, effected in the form of a 100% stock
Capital    Stock:
dividend, on June 25, 1998 to shareholders of record on June 11, 1998, which resulted in the issuance of 158.9
million shares of common stock and corresponding decreases of $96.5 million in additional paid-in capital and
$62.4 million in retained earnings. Similar transfers were made between additional paid-in capital and common
stock in the amount of $79.8 million, reflecting the two-for-one stock split of June 26, 1997 to shareholders
of record on June 11, 1997. All historical earnings per share amounts have been restated to reflect both two-
for-one stock splits. Reference to common stock activity before the distribution of the related split has not been
restated unless otherwise noted. All activity after the distribution date reflects the two-for-one stock splits.
   In April 1992, the Company issued 250,000 shares of Series A cumulative convertible preferred stock in
a private offering. As of June 1996, pursuant to a call for redemption, the Series A preferred stock was
converted into 1,190,475 shares of common stock.
   In August 1992, the Company issued 1,650,000 shares of Series C cumulative convertible preferred stock
in a public offering. As of September 1996, pursuant to a call for redemption, the Series C preferred stock
was converted into 3,177,844 shares of common stock.
   On November 17, 1995, the Company issued its Series D and Series E convertible preferred stock as part
of the purchase price for Marshalls. The 250,000 shares of Series D preferred stock, with a face value of $25
million, carried an annual dividend rate of $1.81 per share and was automatically converted into 1,349,527
shares of common stock on November 17, 1996.
   The shares of Series E preferred stock, with 1,500,000 shares initially issued at a face value of $150 million,
carried an annual dividend rate of $7.00 per share. During fiscal 1998, 770,200 shares of the Series E preferred
stock were voluntarily converted into 8.3 million shares of common stock and 2,500 shares were repurchased.
During fiscal 1999, 357,300 shares of Series E were voluntarily converted into 6.7 million shares of common
stock. On November 18, 1998, the remaining 370,000 shares of the Series E preferred stock were mandatorily
converted into 8.0 million shares of common stock in accordance with its terms. Inducement fees of $130,000
and $3.8 million were paid on the Series E voluntary conversions in fiscal 1999 and fiscal 1998, respectively.
   The Company recorded aggregate dividends, including inducement fees, on its preferred stock of $3.5
million in fiscal 1999, $11.7 million in fiscal 1998 and $13.7 million in fiscal 1997. The preferred dividends
reduce net income in computing net income available to common shareholders.
   During fiscal 1997, the Company replaced the June 1995 shelf registration statement with another shelf
registration statement which currently provides for the issuance of up to $600 million of debt, common
stock or preferred stock.
   In June 1997, the Company announced a $250 million stock buyback program. During fiscal 1998, the
Company repurchased 17.1 million shares of common stock (adjusted for stock splits) for a cost of

14
$245.2 million. The program was completed in February 1998 at which time the Company announced a
second $250 million stock repurchase program. In October 1998, the Company completed the second $250
million stock repurchase program and announced its intentions to repurchase an additional $750 million of
common stock over the next several years. The Company has spent $95.5 million through January 30, 1999
on this current repurchase program. In total, during fiscal 1999, the Company repurchased a combined total
of 15.6 million shares of common stock (adjusted for stock splits) at a total cost of $350.3 million.

             P e r S h a r e : The Company calculates earnings per share in accordance with SFAS No. 128
Earnings
which requires the presentation of basic and diluted earnings per share. The following schedule presents the
calculation of basic and diluted earnings per share for income from continuing operations:

                                                                                Fiscal Year Ended
                                                                  January 30,      January 31,        January 25,
Dollars in Thousands Except Per Share Amounts                           1999              1998              1997
                                                                                    (53 weeks)
Basic earnings per share:
  Income from continuing operations before extraordinary item    $433,202          $306,592           $213,826
  Less: preferred stock dividends                                   3,523            11,668             13,741
  Income from continuing operations before extraordinary
     item available to common shareholders                       $429,679          $294,924           $200,085
  Weighted average common stock outstanding
     for basic earnings per share                             318,073,081       321,474,046         300,926,904
  Basic earnings per share                                          $1.35              $.92                $.66

Diluted earnings per share:
  Income from continuing operations before extraordinary item
     available to common shareholders                         $429,679             $294,924           $200,085
  Add back: preferred stock dividends                            3,523               11,668             13,741
  Income from continuing operations before extraordinary
     item for diluted earnings per share calculation          $433,202             $306,592           $213,826

     Weighted average common stock outstanding
       for basic earnings per share                            318,073,081      321,474,046         300,926,904
     Assumed conversion of:
       Convertible preferred stock                               10,914,354      24,032,172          46,331,584
       Stock options and awards                                   5,660,515       4,105,966           3,391,612
     Weighted average common shares for
       diluted earnings per share calculation                  334,647,950      349,612,184         350,650,100
     Diluted earnings per share                                      $1.29             $.88                $.61

G.    Income    Taxes
The provision for income taxes includes the following:

                                                                                Fiscal Year Ended
                                                                  January 30,      January 31,        January 25,
In Thousands                                                            1999              1998              1997
                                                                                    (53 weeks)
Current:
  Federal                                                         $231,811         $172,026           $116,848
  State                                                             45,117           39,200             27,160
  Foreign                                                           13,784            8,117              8,079
Deferred:
  Federal                                                          (13,084)          (3,432)                33
  State                                                             (2,306)            (326)               462
  Foreign                                                           (4,512)              94               (268)
Provision for income taxes                                        $270,810         $215,679           $152,314


15
The Company had a net deferred tax (asset) liability as follows:
                                                                                      January 30,      January 31,
In Thousands                                                                                1999             1998
Deferred tax assets:
  Foreign net operating loss carryforward                                             $ 30,660         $ 34,554
  Reserve for discontinued operations                                                   12,074            6,723
  Reserve for closed store and restructuring costs                                      19,767           23,571
  Insurance costs not currently deductible for tax purposes                              7,496           15,049
  Pension, postretirement and employee benefits                                         48,556           34,173
  Leases                                                                                13,379            9,350
  Other                                                                                 24,255           18,789
  Valuation allowance                                                                  (27,321)         (34,603)
     Total deferred tax assets                                                         128,866          107,606
Deferred tax liabilities:
  Property, plant and equipment                                                          17,056          14,736
  Safe harbor leases                                                                     31,738          37,945
  Tradename                                                                              47,373          48,659
  Other                                                                                  10,313          13,125
     Total deferred tax liabilities                                                    106,480          114,465
Net deferred tax (asset) liability                                                    $ (22,386)       $ 6,859

The Company has elected to repatriate the fiscal 1999 earnings of its Canadian subsidiary. During fiscal 1999
the majority of the earnings of its Canadian subsidiary were repatriated and deferred foreign tax credits have
been provided for on the undistributed portion of fiscal 1999 earnings. Prior earnings of its Canadian
subsidiary and all the earnings of the Company’s other foreign subsidiaries are indefinitely reinvested and no
deferred taxes have been provided for on those earnings.
   The Company has a United Kingdom net operating loss carryforward of approximately $50 million for
tax and financial reporting purposes. The United Kingdom net operating loss does not expire under current
United Kingdom tax law. The Company also has a Puerto Rico net operating loss carryforward of approxi-
mately $39 million at January 30, 1999, for tax and financial reporting purposes, which was acquired in the
Marshalls acquisition and expires in fiscal 2000 through fiscal 2003. The Company has recognized in fiscal
1999 a $3.4 million Puerto Rico deferred tax asset for estimated future utilization of the Puerto Rico net oper-
ating loss carryforward. Additional utilization of these net operating loss carryforwards is dependent upon
future earnings of the Company’s foreign subsidiaries.
   The Company’s worldwide effective tax rate was 38% for the fiscal year ended January 30, 1999, 41%
and 42% for fiscal years ended January 31, 1998 and January 25, 1997, respectively. The difference
between the U.S. federal statutory income tax rate and the Company’s worldwide effective income tax
rate is summarized as follows:
                                                                                   Fiscal Year Ended
                                                                     January 30,      January 31,      January 25,
                                                                           1999              1998            1997
U.S. federal statutory income tax rate                                       35%              35%              35%
Effective state income tax rate                                               4                5                5
Impact of foreign operations                                                 (1)               –                1
All other                                                                     –                1                1
Worldwide effective income tax rate                                          38%              41%              42%

H.   Pension   Plans    and   Other    Retirement      Benefits
The Company has a non-contributory defined benefit retirement plan covering the majority of full-time U.S.
employees. Effective in fiscal 1998, Marshalls associates are included in the plan with credit for service prior
to the acquisition. Employees who have attained twenty-one years of age and have completed one year of
service are covered under the plan. Benefits are based on compensation earned in each year of service. The
Company also has an unfunded supplemental retirement plan which covers certain key employees of the
Company and provides additional retirement benefits based on average compensation and an unfunded
postretirement medical plan which provides limited postretirement medical and life insurance benefits to


16
associates who participate in the Company’s retirement plan and who retire at age fifty-five or older with
ten or more years of service.
   Presented below is certain financial information relating to the Company’s retirement plans for the fiscal
years indicated:
                                                                    Pension                     Postretirement Medical
                                                      January 30,             January 31,   January 30,        January 31,
Dollars in Thousands                                        1999                    1998          1999                1998
Change      in    benefit        obligation:
     Benefit obligation at beginning of year          $127,148                $100,465       $21,172            $15,093
       Service cost                                     10,538                   8,372         1,405              1,133
       Interest cost                                     9,647                   8,398         1,610              1,649
       Amendments                                            –                     750             –              2,702
       Actuarial losses                                 11,027                  15,299         1,712              1,456
       Benefits paid                                    (5,497)                 (5,283)         (907)              (860)
       Expenses paid                                      (816)                   (853)            –                  –
     Benefit obligation at end of year                $152,047                $127,148       $24,992            $21,173

Change      in    plan        assets:
     Fair value of plan assets at beginning of year   $110,234                 $89,554       $      –           $      –
        Actual return on plan assets                     8,164                  22,494              –                  –
        Employer contribution                           11,106                   4,323            907                860
        Benefits paid                                   (5,497)                 (5,284)          (907)              (860)
        Expenses paid                                     (816)                   (853)             –                  –
     Fair value of plan assets at end of year         $123,191                $110,234       $      –           $      –

Reconciliation           of    funded   status:
     Benefit obligation at end of year                $152,047                $127,148       $24,992            $21,173
     Fair value of plan assets at end of year          123,191                 110,234             –                  –
     Funded status – obligation in excess of assets     28,856                  16,914        24,992             21,173
     Unrecognized transition obligation                    522                     596             –                  –
     Unrecognized prior service cost                       773                     861         1,616              1,953
     Unrecognized actuarial (gains) losses               4,909                  (5,243)        3,997              2,388
     Net accrued liability recognized                 $ 22,652                $ 20,700       $19,379            $16,832

Weighted         average       assumptions:
     Discount rate                                         6.63%                   7.00%         6.75%              7.00%
     Expected return on plan assets                        9.00%                   9.00%         N/A                N/A
     Rate of compensation increase                         4.00%                   4.00%         4.00%              4.00%

Components of net periodic benefit cost:
     Service cost                                     $ 10,538                $  8,372       $ 1,405            $ 1,366
     Interest cost                                       9,647                   8,398         1,610              1,649
     Expected return on plan assets                     (9,991)                 (7,937)            –                  –
     Amortization of transition obligation                  75                      75             –                  –
     Amortization of prior service cost                     87                     837           338                749
     Recognized actuarial losses                         2,702                     206           103                  –
     Net periodic benefit cost                        $ 13,058                $ 9,951        $ 3,456            $ 3,764

The net periodic benefit cost for the Company’s pension and postretirement medical plans for the fiscal year
ended January 25, 1997, was $5.9 million and $1.8 million, respectively. The projected benefit obligation
and accumulated benefit obligation of the Company’s unfunded supplemental retirement plan were $26.2
million and $20.1 million, respectively, as of January 30, 1999 and $19.7 million and $13.4 million, respec-
tively, as of January 31, 1998.


17
For measurement purposes of the postretirement medical plan, a 4% annual rate of increase in the per
capita cost of covered health care benefits was assumed and is gradually reduced to zero. The impact of
medical inflation eventually diminishes because of the $3,000 per capita annual limit on medical benefits.
An increase in the assumed health care cost trend rate of one percentage point for all future years would
increase the accumulated postretirement benefit obligation at January 30, 1999 by about $1.4 million, and
the total of the service cost and interest cost components of net periodic postretirement cost for fiscal 1999,
by about $180,000. Similarly, decreasing the trend rate by one percentage point for all future years would
decrease the accumulated postretirement benefit obligation at January 30, 1999 by about $1.3 million as well
as the total of the service cost and interest cost components of net periodic postretirement cost for fiscal
1999, by about $170,000.
   The Company also sponsors an employee savings plan under Section 401(k) of the Internal Revenue Code
for all eligible U.S. employees, including Marshalls associates effective January 1, 1997. Employees may
contribute up to 15% of eligible pay. The Company matches employee contributions up to 5% of eligible pay
at rates ranging from 25% to 50% based upon Company performance. The Company contributed for all
401(k) plans $6.4 million in fiscal 1999, $5.7 million in fiscal 1998 and $6.4 million in fiscal 1997. Prior to
January 1, 1997, Marshalls associates participated in a separate Section 401(k) savings plan consistent with
the plan Marshalls associates participated in prior to acquisition.
   In addition to the plans described above, the Company also maintains retirement/deferred savings plans
for all eligible associates at its foreign subsidiaries. The Company contributed for these plans $534,000,
$440,000 and $294,000 in fiscal years 1999, 1998 and 1997, respectively.

I.   Accrued   Expenses      and   Other    Current    Liabilities
The major components of accrued expenses and other current liabilities are as follows:
                                                                                       January 30,      January 31,
In Thousands                                                                                 1999             1998
Employee compensation and benefits                                                     $173,630         $142,945
Reserve for discontinued operations                                                      29,660           17,843
Store closing and restructuring reserve, continuing operations                           44,598           57,966
Insurance                                                                                44,654           58,070
Rent, utilities, advertising and other                                                  396,451          334,682
Accrued expenses and other current liabilities                                         $688,993         $611,506

The Company’s reserve for discontinued operations relates to obligations the Company retained or incurred
in connection with the sale of its former Zayre, Hit or Miss and Chadwick’s operations. During fiscal 1999,
the Company increased the reserve by $15 million for additional lease related obligations, primarily in
connection with its former Hit or Miss properties. The balance of the activity in the reserve for fiscal 1999,
a reduction of $3.2 million, is primarily for lease related obligations of the former Zayre stores. During fiscal
1998, the reserve decreased by $5.8 million primarily due to settlement costs associated with Chadwick’s
and for lease related costs associated with the former Zayre and Hit or Miss properties. The combined
remaining reserve balance of $29.7 million as of January 30, 1999 is expected to be used for lease related
obligations, primarily for former Zayre and Hit or Miss properties, which is expected to be paid out over the
next ten to fifteen years, as leases are settled or terminated.
   The reserve for store closings and restructurings is primarily for costs associated with the disposition and
settlement of leases for the T.J. Maxx and Marshalls closings anticipated as a result of the Marshalls acqui-
sition. The initial reserves established in fiscal 1996 were estimated at $244.1 million for a Marshalls store
closing and restructuring plan and $35 million for the closing of certain T.J. Maxx stores.
   The initial reserve established in the acquisition of Marshalls for the fiscal year-ended January 27, 1996, was
estimated at $244.1 million and included $44.1 million for inventory markdowns and $200 million for a store
closing and restructuring program. The initial store closing plan included the closing of 170 Marshalls stores
during fiscal 1997 and fiscal 1998. The Company reduced the total reserve by $85.9 million in fiscal 1997 and
by an additional $15.8 million in fiscal 1998, primarily due to fewer store closings and a reduction in the esti-
mated cost of settling the related lease obligations. This reserve was a component of the allocation of the
purchase price for Marshalls and the reserve adjustments in fiscal 1998 and 1997 resulted in a corresponding


18
reduction in the value assigned to the long-term assets acquired. The adjusted reserve balance included $70.8
million for lease related obligations for 70 store and other facility closings, $9.6 million for property write-offs,
$44.1 million for inventory markdowns and $17.9 million for severance, professional fees and all other costs
associated with the restructuring plan. Property write-offs were the only non-cash charge to the reserve.
   In connection with the Marshalls acquisition, the Company also established a reserve for the closing of
certain T.J. Maxx stores. The Company recorded an initial pre-tax charge to income from continuing opera-
tions of $35 million in fiscal 1996 and a pre-tax credit to income from continuing operations of $1.8 million
in fiscal 1999 and $8 million in fiscal 1997 to reflect a lower than anticipated cost of the T.J. Maxx closings.
An additional charge to continuing operations of $700,000 was recorded in fiscal 1998. The adjusted reserve
balance includes $13.8 million for lease related obligations of 32 store closings, non-cash charges of $9.8
million for property write-offs and $2.3 million for severance, professional fees and all other costs
associated with the closings.
   The following is a summary of the activity in the store closing and restructuring reserve for the last two
fiscal years:
                                                                                                Fiscal Year Ended
                                                                                         January 30,         January 31,
In Thousands                                                                                   1999                1998
Balance, beginning of year                                                                 $57,966           $ 95,867
Additions to the reserve                                                                     1,961                  –
Reserve adjustments:
  Adjust Marshalls restructuring reserve                                                            –         (15,843)
  Adjust T.J. Maxx store closing reserve                                                       (1,800)            700
Charges against the reserve:
  Lease related obligations                                                                (12,521)           (13,593)
  Severance and all other cash charges                                                        (927)            (1,876)
  Net activity relating to HomeGoods closings                                                  (81)            (1,887)
  Non-cash property write-offs                                                                   –             (5,402)
Balance, end of year                                                                       $44,598           $ 57,966

As of January 31, 1998, all the Marshalls and T.J. Maxx properties reserved for had been closed. The remain-
ing reserve balance as of January 30, 1999 of $44.6 million is almost entirely for the estimated cost of future
obligations of closed stores and other facility leases. It includes estimates and assumptions as to how the
leases will be disposed of, and could change; however, the Company believes it has adequate reserves to
deal with these obligations. The use of the reserve will reduce operating cash flows in varying amounts over
the next ten to fifteen years as the related leases expire or are settled.

J.   Supplemental       Cash    Flows    Information
The Company classifies the cash flows associated with the operating results of its discontinued operations
through the date of sale, as “net cash provided by discontinued operations.” The following is a reconciliation
of the “income from discontinued operations, net of income taxes” to the “net cash provided by discontinued
operations” for the fiscal years indicated. No cash flows from the operating results of the Company’s
discontinued operations were received during the year ended January 30, 1999.

                                                                                                Fiscal Year Ended
                                                                                         January 31,         January 25,
In Thousands                                                                                   1998                1997
                                                                                          (53 weeks)
Income from discontinued operations, net of income taxes                                   $        –        $ 29,361
Decrease in net assets of discontinued operations during the period:
    Net assets of discontinued operations – beginning of period                                54,451         128,586
  Less:
    Net assets of discontinued operations – sold during period                                   –             54,083
    Net assets of discontinued operations – end of period                                        –             54,451
Decrease in net assets of discontinued operations                                           54,451             20,052
  Net cash provided by discontinued operations                                             $54,451           $ 49,413


19
The Company is also responsible for certain leases related to, and other obligations arising from, the sale of
these operations, for which reserves have been provided in its reserve for discontinued operations, and is
included in accrued expenses. The cash flow impact of these obligations is reflected as a component of cash
provided by operating activities in the statements of cash flows.
   The Company’s cash payments for interest expense and income taxes, including discontinued operations,
and its non-cash investing and financing activities are as follows:
                                                                                   Fiscal Year Ended
                                                                     January 30,      January 31,      January 25,
In Thousands                                                               1999              1998            1997
                                                                                       (53 weeks)
Cash paid for:
  Interest                                                            $ 22,542          $ 26,359        $ 44,288
  Income taxes                                                         275,538           199,025         159,245
Non-cash investing and financing activities:
  Conversion of cumulative convertible preferred
     stock into common stock
        Series A                                                      $      –          $        –      $ 25,000
        Series C                                                             –                   –        82,500
        Series D                                                             –                   –        25,000
        Series E                                                        72,730              77,020             –
  Distribution of two-for-one stock split                              158,954              79,823             –
  Note receivable from sale of Chadwick’s of Boston                          –                   –        20,000

K.   Discontinued      Operations      and   Related    Contingent        Liabilities
In October 1988, the Company completed the sale of its former Zayre Stores division to Ames Department
Stores, Inc. (“Ames”). In April 1990, Ames filed for protection under Chapter 11 of the Federal Bankruptcy
Code and in December 1992, Ames emerged from bankruptcy under a plan of reorganization.
   The Company remains contingently liable for the leases of most of the former Zayre stores still operated
by Ames. The Company believes that the Company’s contingent liability on these leases will not have a
material effect on the Company’s financial condition.
   The Company is also contingently liable on certain leases of its former warehouse club operations (BJ’s
Wholesale Club and HomeBase), which was spun off by the Company in fiscal 1990 as Waban Inc. During
fiscal 1998, Waban Inc. was renamed HomeBase, Inc. and spun-off from its BJ’s Wholesale Club division
(BJ’s Wholesale Club, Inc.). HomeBase, Inc., and BJ’s Wholesale Club, Inc. are primarily liable on their
respective leases and have indemnified the Company for any amounts the Company may have to pay with
respect to such leases. In addition, HomeBase, Inc., BJ’s Wholesale Club, Inc. and the Company have entered
into agreements under which BJ’s Wholesale Club, Inc. has substantial indemnification responsibility with
respect to such HomeBase, Inc. leases. The Company is also contingently liable on certain leases of BJ’s
Wholesale Club, Inc. for which both BJ’s Wholesale Club, Inc. and HomeBase, Inc. remain liable. The
Company believes that its contingent liability on the HomeBase, Inc. and BJ’s Wholesale Club, Inc. leases
will not have a material effect on the Company’s financial condition.
   The Company is also contingently liable on approximately 50 store leases and the office and warehouse
leases of its former Hit or Miss division which was sold by the Company in September 1995. During the
third quarter ended October 31, 1998, the Company increased its reserve for its discontinued operations by
$15 million ($9 million after tax), primarily for potential lease liabilities relating to guarantees on leases of
its former Hit or Miss division. The after tax cost of $9 million or, $.02 per diluted share, was recorded as a
loss on disposal of discontinued operations.


20
L.   Segment   Information
During 1997, the Financial Accounting Standards Board issued Statement of Financial Accounting
Standards (SFAS) No. 131, “Disclosure about Segments of an Enterprise and Related Information.” This
new standard did not result in any changes to the Company’s reportable segments or in the information
disclosed about its segments.
   The Company has two reportable segments. It’s off-price family apparel segment includes the T.J. Maxx,
Marshalls and A.J. Wright domestic store chains and the Company’s foreign store chains, Winners and T.K.
Maxx. The Company manages the results of its T.J. Maxx and Marshalls chains on a combined basis. The
other chains, whose operating results are managed separately, sell similar product categories and share simi-
lar economic and other characteristics of the T.J. Maxx and Marshalls operations and are aggregated with
the off-price family apparel segment. This segment generated 7.8% of its fiscal 1999 revenue from its foreign
operations. All of these stores offer apparel for the entire family with limited offerings of domestic goods.
The Company’s other segment, the off-price home fashions stores is made up of the Company’s HomeGoods
stores which offer a wide variety of home furnishings.
   The Company evaluates the performance of its segments based on pre-tax income before interest and
general corporate expenses. For data on business segments for fiscal years 1999, 1998 and 1997, see page 22.


21
The TJX Companies, Inc.

REPORT     OF   INDEPENDENT        ACCOUNTANTS


To   the   Board   of     Directors   of   The   TJX   Companies,       Inc.:
In our opinion, the accompanying consolidated balance sheets and the related consolidated statements of
income, stockholders’ equity and cash flows present fairly, in all material respects, the financial position
of The TJX Companies, Inc. and subsidiaries (the “Company”) at January 30, 1999 and January 31, 1998,
and the results of its operations and its cash flows for each of the three years in the period ended January 30,
1999, in conformity with generally accepted accounting principles. These financial statements are the
responsibility of the Company’s management; our responsibility is to express an opinion on these financial
statements based on our audits. We conducted our audits of these statements in accordance with generally
accepted auditing standards which require that we plan and perform the audit to obtain reasonable assurance
about whether the financial statements are free of material misstatement. An audit includes examining, on a
test basis, evidence supporting the amounts and disclosures in the financial statements, assessing the account-
ing principles used and significant estimates made by management, and evaluating the overall financial
statement presentation. We believe that our audits provide a reasonable basis for the opinion expressed above.

Boston, Massachusetts
March 2, 1999


REPORT     OF   MANAGEMENT


The financial statements and related financial information in this annual report have been prepared by
management which is responsible for their integrity, objectivity and consistency. The financial statements
were prepared in accordance with generally accepted accounting principles and necessarily include
amounts which are based upon judgments and estimates made by management.
   The Company maintains a system of internal controls designed to provide, at appropriate cost, reason-
able assurance that assets are safeguarded, transactions are executed in accordance with management’s
authorization and the accounting records may be relied upon for the preparation of financial statements.
The system of controls includes the careful selection and training of associates, and the communication
and application of formal policies and procedures that are consistent with high standards of accounting
and administrative practices. The accounting and control systems are continually reviewed, evaluated and
where appropriate, modified to accommodate changing business conditions and the recommendations of
the Company’s internal auditors and the independent public accountants.
   An Audit Committee, comprised of members of the Board of Directors who are neither officers nor employees
of the Company, meets periodically with management, internal auditors and the independent public accountants
to review matters relating to the Company’s financial reporting, the adequacy of internal accounting controls and
the scope and results of audit work. The Committee is responsible for reporting the results of its activities and for
recommending the selection of independent auditors to the full Board of Directors. The internal auditors and the
independent public accountants have free access to the Committee and the Board of Directors.
   The financial statements have been examined by PricewaterhouseCoopers LLP, whose report appears
separately. Their report expresses an opinion as to the fair presentation of the consolidated financial
statements and is based on an independent examination performed in accordance with generally accepted
auditing standards.


Bernard Cammarata                                      Donald G. Campbell
President and Chief Executive Officer                  Executive Vice President – Finance and
                                                       Chief Financial Officer
March 2, 1999


22
The TJX Companies, Inc.

SELECTED        FINANCIAL        DATA     (CONTINUING            OPERATIONS)


The following selected financial data includes the results of Marshalls for the periods following its acquisi-
tion on November 17, 1995. All prior year data has been restated to reflect Chadwick’s and Hit or Miss as
discontinued operations.
                                                                                   Fiscal Year Ended January
Dollars in Thousands Except Per Share Amounts             1999            1998                1997             1996                 1995
                                                                     (53 Weeks)
Income statement and per share data:
   Net sales                          $7,949,101 $7,389,069 $6,689,410 $3,975,115 $3,055,573
   Income from continuing
     operations before
                                                                            51,589(1)
     extraordinary item                  433,202     306,592     213,826                  84,480
   Weighted average common
     shares for diluted earnings
     per share computations          334,647,950 349,612,184 350,650,100 290,781,900 293,837,800
   Diluted earnings per share
     from continuing operations
                                                                                 .15(1) $
     before extraordinary item        $     1.29 $       .88 $       .61 $                   .26
   Dividends per share                       .12         .10         .07         .12         .14

Balance sheet data:
  Working capital                                $ 436,259        $ 464,974         $ 425,595          $ 332,864         $ 240,646
  Total assets                                    2,747,846        2,609,632         2,506,761          2,545,825         1,373,964
  Capital expenditures                              207,742          192,382           119,153            105,864           109,436
  Long-term debt                                    220,344          221,024           244,410            690,713           194,478
  Shareholders’ equity                            1,220,656        1,164,092         1,127,186            764,634           606,952

Stores in operation at year-end:
   T.J. Maxx                                              604              580                  578            587                  551
   Marshalls                                              475              461                  454            496                    –
   Winners                                                 87               76                   65             52                   37
   HomeGoods                                               35               23                   21             22                   15
   T.K. Maxx                                               39               31                   18              9                    5
   A.J. Wright                                              6                –                    –              –                    –

(1) Includes an after-tax charge of $21.0 million, or $.07 per share, for the estimated cost of closing certain T.J. Maxx stores in
    connection with the acquisition of Marshalls.


PRICE     RANGE      OF   COMMON        STOCK


The following per share data reflects the two-for-one stock splits distributed in June 1998 and June 1997.
  The common stock of the Company is listed on the New York Stock Exchange (Symbol: TJX). The
quarterly high and low trading stock prices for fiscal 1999 and fiscal 1998 are as follows:
                                                                                  Fiscal 1999                         Fiscal 1998
Quarter                                                                    High                 Low            High                 Low
                                                                              3                    3              1                    9
First                                                                      $23. ⁄4              $17. ⁄16       $12. ⁄32             $ 9. ⁄16
                                                                              7                    3              31                   1
Second                                                                      28. ⁄16              22. ⁄16        14. ⁄32              11. ⁄4
                                                                                                   1              7                    1
Third                                                                       28.                  15. ⁄2         16. ⁄16              13. ⁄8
                                                                              1                    3              9
Fourth                                                                      31. ⁄16              18. ⁄4         19. ⁄32              13.

The approximate number of common shareholders at January 30, 1999 was 47,300.
   The Company declared four quarterly dividends of $.03 per share for fiscal 1999 and $.025 per share
for fiscal 1998.


23
TJX Financial Statements

Mais conteúdo relacionado

Mais procurados

Q2 2004 Earnings Release Financial Tables
	Q2 2004 Earnings Release Financial Tables	Q2 2004 Earnings Release Financial Tables
Q2 2004 Earnings Release Financial Tablesfinance7
 
dover Q208_Supplement_r232g32g32g
dover Q208_Supplement_r232g32g32gdover Q208_Supplement_r232g32g32g
dover Q208_Supplement_r232g32g32gfinance30
 
RYDERFINAL Q207tables
RYDERFINAL Q207tablesRYDERFINAL Q207tables
RYDERFINAL Q207tablesfinance44
 
progress energy 07/25/2001
progress energy 07/25/2001progress energy 07/25/2001
progress energy 07/25/2001finance25
 
Maxim 2Q FISCAL 2009 RESULTS
Maxim 2Q FISCAL 2009 RESULTSMaxim 2Q FISCAL 2009 RESULTS
Maxim 2Q FISCAL 2009 RESULTSearningsreport
 
danaher 05-4Q-REL
danaher 05-4Q-RELdanaher 05-4Q-REL
danaher 05-4Q-RELfinance24
 
emerson electricl Proxy Statement for 2009 Annual Shareholders Meeting
emerson electricl Proxy Statement for 2009 Annual Shareholders Meeting  emerson electricl Proxy Statement for 2009 Annual Shareholders Meeting
emerson electricl Proxy Statement for 2009 Annual Shareholders Meeting finance12
 
updated3Q07PRTABLES%20v2
updated3Q07PRTABLES%20v2updated3Q07PRTABLES%20v2
updated3Q07PRTABLES%20v2finance44
 

Mais procurados (10)

Q2 2004 Earnings Release Financial Tables
	Q2 2004 Earnings Release Financial Tables	Q2 2004 Earnings Release Financial Tables
Q2 2004 Earnings Release Financial Tables
 
dover Q208_Supplement_r232g32g32g
dover Q208_Supplement_r232g32g32gdover Q208_Supplement_r232g32g32g
dover Q208_Supplement_r232g32g32g
 
Amd Q308 Financials
Amd Q308 FinancialsAmd Q308 Financials
Amd Q308 Financials
 
RYDERFINAL Q207tables
RYDERFINAL Q207tablesRYDERFINAL Q207tables
RYDERFINAL Q207tables
 
progress energy 07/25/2001
progress energy 07/25/2001progress energy 07/25/2001
progress energy 07/25/2001
 
Maxim 2Q FISCAL 2009 RESULTS
Maxim 2Q FISCAL 2009 RESULTSMaxim 2Q FISCAL 2009 RESULTS
Maxim 2Q FISCAL 2009 RESULTS
 
Amd Q307 Financials
Amd Q307 FinancialsAmd Q307 Financials
Amd Q307 Financials
 
danaher 05-4Q-REL
danaher 05-4Q-RELdanaher 05-4Q-REL
danaher 05-4Q-REL
 
emerson electricl Proxy Statement for 2009 Annual Shareholders Meeting
emerson electricl Proxy Statement for 2009 Annual Shareholders Meeting  emerson electricl Proxy Statement for 2009 Annual Shareholders Meeting
emerson electricl Proxy Statement for 2009 Annual Shareholders Meeting
 
updated3Q07PRTABLES%20v2
updated3Q07PRTABLES%20v2updated3Q07PRTABLES%20v2
updated3Q07PRTABLES%20v2
 

Semelhante a TJX Financial Statements

danaher 05-4Q-REL
danaher 05-4Q-RELdanaher 05-4Q-REL
danaher 05-4Q-RELfinance24
 
ppg industries 2Q06EarningsReleaseTablesPDF
ppg industries 2Q06EarningsReleaseTablesPDFppg industries 2Q06EarningsReleaseTablesPDF
ppg industries 2Q06EarningsReleaseTablesPDFfinance22
 
danaher 07_4Q_Release
danaher 07_4Q_Releasedanaher 07_4Q_Release
danaher 07_4Q_Releasefinance24
 
state street corp stt_finrev02
state street corp stt_finrev02state street corp stt_finrev02
state street corp stt_finrev02finance23
 
state street corp stt_finrev02
state street corp stt_finrev02state street corp stt_finrev02
state street corp stt_finrev02finance23
 
allstate Financial Section 2000
allstate Financial Section 2000allstate Financial Section 2000
allstate Financial Section 2000finance7
 
reliance steel & aluminum 2005_Annual_Report
reliance steel & aluminum  2005_Annual_Reportreliance steel & aluminum  2005_Annual_Report
reliance steel & aluminum 2005_Annual_Reportfinance32
 
danaher 06_4Q_Release
danaher 06_4Q_Releasedanaher 06_4Q_Release
danaher 06_4Q_Releasefinance24
 
ppg industries 3Q 06 Earning sTables
ppg industries 3Q 06 Earning sTables ppg industries 3Q 06 Earning sTables
ppg industries 3Q 06 Earning sTables finance22
 
advanced micro devices Q106Results
advanced micro devices Q106Resultsadvanced micro devices Q106Results
advanced micro devices Q106Resultsfinance34
 
helath net 98 AR
helath net 98 ARhelath net 98 AR
helath net 98 ARfinance18
 
Q1 2005 Earnings Release Financial Tables
 	Q1 2005 Earnings Release Financial Tables 	Q1 2005 Earnings Release Financial Tables
Q1 2005 Earnings Release Financial Tablesfinance7
 
Big_Lots_AR2001FSO
Big_Lots_AR2001FSOBig_Lots_AR2001FSO
Big_Lots_AR2001FSOfinance50
 
regions 1Q 08 SUPP
regions 1Q 08 SUPPregions 1Q 08 SUPP
regions 1Q 08 SUPPfinance25
 

Semelhante a TJX Financial Statements (20)

danaher 05-4Q-REL
danaher 05-4Q-RELdanaher 05-4Q-REL
danaher 05-4Q-REL
 
Q1 2009 Earning Report of Microsoft
Q1 2009 Earning Report of MicrosoftQ1 2009 Earning Report of Microsoft
Q1 2009 Earning Report of Microsoft
 
ppg industries 2Q06EarningsReleaseTablesPDF
ppg industries 2Q06EarningsReleaseTablesPDFppg industries 2Q06EarningsReleaseTablesPDF
ppg industries 2Q06EarningsReleaseTablesPDF
 
danaher 07_4Q_Release
danaher 07_4Q_Releasedanaher 07_4Q_Release
danaher 07_4Q_Release
 
state street corp stt_finrev02
state street corp stt_finrev02state street corp stt_finrev02
state street corp stt_finrev02
 
state street corp stt_finrev02
state street corp stt_finrev02state street corp stt_finrev02
state street corp stt_finrev02
 
allstate Financial Section 2000
allstate Financial Section 2000allstate Financial Section 2000
allstate Financial Section 2000
 
itw_10qq102
itw_10qq102itw_10qq102
itw_10qq102
 
itw_10qq102
itw_10qq102itw_10qq102
itw_10qq102
 
reliance steel & aluminum 2005_Annual_Report
reliance steel & aluminum  2005_Annual_Reportreliance steel & aluminum  2005_Annual_Report
reliance steel & aluminum 2005_Annual_Report
 
danaher 06_4Q_Release
danaher 06_4Q_Releasedanaher 06_4Q_Release
danaher 06_4Q_Release
 
ppg industries 3Q 06 Earning sTables
ppg industries 3Q 06 Earning sTables ppg industries 3Q 06 Earning sTables
ppg industries 3Q 06 Earning sTables
 
fr04_is
fr04_isfr04_is
fr04_is
 
advanced micro devices Q106Results
advanced micro devices Q106Resultsadvanced micro devices Q106Results
advanced micro devices Q106Results
 
helath net 98 AR
helath net 98 ARhelath net 98 AR
helath net 98 AR
 
Q1 2005 Earnings Release Financial Tables
 	Q1 2005 Earnings Release Financial Tables 	Q1 2005 Earnings Release Financial Tables
Q1 2005 Earnings Release Financial Tables
 
itw_10q2q02
itw_10q2q02itw_10q2q02
itw_10q2q02
 
itw_10q2q02
itw_10q2q02itw_10q2q02
itw_10q2q02
 
Big_Lots_AR2001FSO
Big_Lots_AR2001FSOBig_Lots_AR2001FSO
Big_Lots_AR2001FSO
 
regions 1Q 08 SUPP
regions 1Q 08 SUPPregions 1Q 08 SUPP
regions 1Q 08 SUPP
 

Mais de finance14

freeport-mcmoran copper& gold Certificate of Designations for Freeport-McMoR...
freeport-mcmoran copper& gold  Certificate of Designations for Freeport-McMoR...freeport-mcmoran copper& gold  Certificate of Designations for Freeport-McMoR...
freeport-mcmoran copper& gold Certificate of Designations for Freeport-McMoR...finance14
 
freeport-mcmoran copper& gold Amended & Restated Certificate of Incorporatio...
freeport-mcmoran copper& gold  Amended & Restated Certificate of Incorporatio...freeport-mcmoran copper& gold  Amended & Restated Certificate of Incorporatio...
freeport-mcmoran copper& gold Amended & Restated Certificate of Incorporatio...finance14
 
freeport-mcmoran copper& gold Public Policy Committee
freeport-mcmoran copper& gold  Public Policy Committeefreeport-mcmoran copper& gold  Public Policy Committee
freeport-mcmoran copper& gold Public Policy Committeefinance14
 
freeport-mcmoran copper& gold Nominating & Corporate Governance Committee
freeport-mcmoran copper& gold  Nominating & Corporate Governance Committeefreeport-mcmoran copper& gold  Nominating & Corporate Governance Committee
freeport-mcmoran copper& gold Nominating & Corporate Governance Committeefinance14
 
freeport-mcmoran copper& gold Corporate Personnel Committee
freeport-mcmoran copper& gold  Corporate Personnel Committeefreeport-mcmoran copper& gold  Corporate Personnel Committee
freeport-mcmoran copper& gold Corporate Personnel Committeefinance14
 
freeport-mcmoran copper& gold Audit Committee
freeport-mcmoran copper& gold  Audit Committeefreeport-mcmoran copper& gold  Audit Committee
freeport-mcmoran copper& gold Audit Committeefinance14
 
freeport-mcmoran copper& gold 2008ar
freeport-mcmoran copper& gold  2008arfreeport-mcmoran copper& gold  2008ar
freeport-mcmoran copper& gold 2008arfinance14
 
freeport-mcmoran copper& gold Proxy Statement 2004
freeport-mcmoran copper& gold Proxy Statement 2004freeport-mcmoran copper& gold Proxy Statement 2004
freeport-mcmoran copper& gold Proxy Statement 2004finance14
 
freeport-mcmoran copper& gold 2003ar
freeport-mcmoran copper& gold  2003arfreeport-mcmoran copper& gold  2003ar
freeport-mcmoran copper& gold 2003arfinance14
 
freeport-mcmoran copper& gold Proxy Statement 2005
freeport-mcmoran copper& gold Proxy Statement 2005freeport-mcmoran copper& gold Proxy Statement 2005
freeport-mcmoran copper& gold Proxy Statement 2005finance14
 
freeport-mcmoran copper& gold 2004 ar
freeport-mcmoran copper& gold 2004 arfreeport-mcmoran copper& gold 2004 ar
freeport-mcmoran copper& gold 2004 arfinance14
 
freeport-mcmoran copper& gold Proxy Statement 2006
freeport-mcmoran copper& gold Proxy Statement 2006freeport-mcmoran copper& gold Proxy Statement 2006
freeport-mcmoran copper& gold Proxy Statement 2006finance14
 
freeport-mcmoran copper& gold 2005 ar
freeport-mcmoran copper& gold 2005 arfreeport-mcmoran copper& gold 2005 ar
freeport-mcmoran copper& gold 2005 arfinance14
 
freeport-mcmoran copper& gold Proxy Statement 2007
freeport-mcmoran copper& gold Proxy Statement 2007freeport-mcmoran copper& gold Proxy Statement 2007
freeport-mcmoran copper& gold Proxy Statement 2007finance14
 
freeport-mcmoran copper& gold 2006 ar
freeport-mcmoran copper& gold 2006 arfreeport-mcmoran copper& gold 2006 ar
freeport-mcmoran copper& gold 2006 arfinance14
 
freeport-mcmoran copper& gold Proxy Statement 2008
freeport-mcmoran copper& gold Proxy Statement 2008freeport-mcmoran copper& gold Proxy Statement 2008
freeport-mcmoran copper& gold Proxy Statement 2008finance14
 
freeport-mcmoran copper& gold 2007 ar
freeport-mcmoran copper& gold 2007 arfreeport-mcmoran copper& gold 2007 ar
freeport-mcmoran copper& gold 2007 arfinance14
 
loews Highmount Parker
loews Highmount Parker loews Highmount Parker
loews Highmount Parker finance14
 
loews 2 CNA Lilienthal Mense
loews 2 CNA Lilienthal Mense loews 2 CNA Lilienthal Mense
loews 2 CNA Lilienthal Mense finance14
 
loews Q307_10Q
loews Q307_10Qloews Q307_10Q
loews Q307_10Qfinance14
 

Mais de finance14 (20)

freeport-mcmoran copper& gold Certificate of Designations for Freeport-McMoR...
freeport-mcmoran copper& gold  Certificate of Designations for Freeport-McMoR...freeport-mcmoran copper& gold  Certificate of Designations for Freeport-McMoR...
freeport-mcmoran copper& gold Certificate of Designations for Freeport-McMoR...
 
freeport-mcmoran copper& gold Amended & Restated Certificate of Incorporatio...
freeport-mcmoran copper& gold  Amended & Restated Certificate of Incorporatio...freeport-mcmoran copper& gold  Amended & Restated Certificate of Incorporatio...
freeport-mcmoran copper& gold Amended & Restated Certificate of Incorporatio...
 
freeport-mcmoran copper& gold Public Policy Committee
freeport-mcmoran copper& gold  Public Policy Committeefreeport-mcmoran copper& gold  Public Policy Committee
freeport-mcmoran copper& gold Public Policy Committee
 
freeport-mcmoran copper& gold Nominating & Corporate Governance Committee
freeport-mcmoran copper& gold  Nominating & Corporate Governance Committeefreeport-mcmoran copper& gold  Nominating & Corporate Governance Committee
freeport-mcmoran copper& gold Nominating & Corporate Governance Committee
 
freeport-mcmoran copper& gold Corporate Personnel Committee
freeport-mcmoran copper& gold  Corporate Personnel Committeefreeport-mcmoran copper& gold  Corporate Personnel Committee
freeport-mcmoran copper& gold Corporate Personnel Committee
 
freeport-mcmoran copper& gold Audit Committee
freeport-mcmoran copper& gold  Audit Committeefreeport-mcmoran copper& gold  Audit Committee
freeport-mcmoran copper& gold Audit Committee
 
freeport-mcmoran copper& gold 2008ar
freeport-mcmoran copper& gold  2008arfreeport-mcmoran copper& gold  2008ar
freeport-mcmoran copper& gold 2008ar
 
freeport-mcmoran copper& gold Proxy Statement 2004
freeport-mcmoran copper& gold Proxy Statement 2004freeport-mcmoran copper& gold Proxy Statement 2004
freeport-mcmoran copper& gold Proxy Statement 2004
 
freeport-mcmoran copper& gold 2003ar
freeport-mcmoran copper& gold  2003arfreeport-mcmoran copper& gold  2003ar
freeport-mcmoran copper& gold 2003ar
 
freeport-mcmoran copper& gold Proxy Statement 2005
freeport-mcmoran copper& gold Proxy Statement 2005freeport-mcmoran copper& gold Proxy Statement 2005
freeport-mcmoran copper& gold Proxy Statement 2005
 
freeport-mcmoran copper& gold 2004 ar
freeport-mcmoran copper& gold 2004 arfreeport-mcmoran copper& gold 2004 ar
freeport-mcmoran copper& gold 2004 ar
 
freeport-mcmoran copper& gold Proxy Statement 2006
freeport-mcmoran copper& gold Proxy Statement 2006freeport-mcmoran copper& gold Proxy Statement 2006
freeport-mcmoran copper& gold Proxy Statement 2006
 
freeport-mcmoran copper& gold 2005 ar
freeport-mcmoran copper& gold 2005 arfreeport-mcmoran copper& gold 2005 ar
freeport-mcmoran copper& gold 2005 ar
 
freeport-mcmoran copper& gold Proxy Statement 2007
freeport-mcmoran copper& gold Proxy Statement 2007freeport-mcmoran copper& gold Proxy Statement 2007
freeport-mcmoran copper& gold Proxy Statement 2007
 
freeport-mcmoran copper& gold 2006 ar
freeport-mcmoran copper& gold 2006 arfreeport-mcmoran copper& gold 2006 ar
freeport-mcmoran copper& gold 2006 ar
 
freeport-mcmoran copper& gold Proxy Statement 2008
freeport-mcmoran copper& gold Proxy Statement 2008freeport-mcmoran copper& gold Proxy Statement 2008
freeport-mcmoran copper& gold Proxy Statement 2008
 
freeport-mcmoran copper& gold 2007 ar
freeport-mcmoran copper& gold 2007 arfreeport-mcmoran copper& gold 2007 ar
freeport-mcmoran copper& gold 2007 ar
 
loews Highmount Parker
loews Highmount Parker loews Highmount Parker
loews Highmount Parker
 
loews 2 CNA Lilienthal Mense
loews 2 CNA Lilienthal Mense loews 2 CNA Lilienthal Mense
loews 2 CNA Lilienthal Mense
 
loews Q307_10Q
loews Q307_10Qloews Q307_10Q
loews Q307_10Q
 

Último

The Economic History of the U.S. Lecture 19.pdf
The Economic History of the U.S. Lecture 19.pdfThe Economic History of the U.S. Lecture 19.pdf
The Economic History of the U.S. Lecture 19.pdfGale Pooley
 
06_Joeri Van Speybroek_Dell_MeetupDora&Cybersecurity.pdf
06_Joeri Van Speybroek_Dell_MeetupDora&Cybersecurity.pdf06_Joeri Van Speybroek_Dell_MeetupDora&Cybersecurity.pdf
06_Joeri Van Speybroek_Dell_MeetupDora&Cybersecurity.pdfFinTech Belgium
 
The Economic History of the U.S. Lecture 26.pdf
The Economic History of the U.S. Lecture 26.pdfThe Economic History of the U.S. Lecture 26.pdf
The Economic History of the U.S. Lecture 26.pdfGale Pooley
 
20240429 Calibre April 2024 Investor Presentation.pdf
20240429 Calibre April 2024 Investor Presentation.pdf20240429 Calibre April 2024 Investor Presentation.pdf
20240429 Calibre April 2024 Investor Presentation.pdfAdnet Communications
 
Top Rated Pune Call Girls Viman Nagar ⟟ 6297143586 ⟟ Call Me For Genuine Sex...
Top Rated  Pune Call Girls Viman Nagar ⟟ 6297143586 ⟟ Call Me For Genuine Sex...Top Rated  Pune Call Girls Viman Nagar ⟟ 6297143586 ⟟ Call Me For Genuine Sex...
Top Rated Pune Call Girls Viman Nagar ⟟ 6297143586 ⟟ Call Me For Genuine Sex...Call Girls in Nagpur High Profile
 
High Class Call Girls Nashik Maya 7001305949 Independent Escort Service Nashik
High Class Call Girls Nashik Maya 7001305949 Independent Escort Service NashikHigh Class Call Girls Nashik Maya 7001305949 Independent Escort Service Nashik
High Class Call Girls Nashik Maya 7001305949 Independent Escort Service NashikCall Girls in Nagpur High Profile
 
Log your LOA pain with Pension Lab's brilliant campaign
Log your LOA pain with Pension Lab's brilliant campaignLog your LOA pain with Pension Lab's brilliant campaign
Log your LOA pain with Pension Lab's brilliant campaignHenry Tapper
 
Dharavi Russian callg Girls, { 09892124323 } || Call Girl In Mumbai ...
Dharavi Russian callg Girls, { 09892124323 } || Call Girl In Mumbai ...Dharavi Russian callg Girls, { 09892124323 } || Call Girl In Mumbai ...
Dharavi Russian callg Girls, { 09892124323 } || Call Girl In Mumbai ...Pooja Nehwal
 
The Economic History of the U.S. Lecture 17.pdf
The Economic History of the U.S. Lecture 17.pdfThe Economic History of the U.S. Lecture 17.pdf
The Economic History of the U.S. Lecture 17.pdfGale Pooley
 
03_Emmanuel Ndiaye_Degroof Petercam.pptx
03_Emmanuel Ndiaye_Degroof Petercam.pptx03_Emmanuel Ndiaye_Degroof Petercam.pptx
03_Emmanuel Ndiaye_Degroof Petercam.pptxFinTech Belgium
 
The Economic History of the U.S. Lecture 18.pdf
The Economic History of the U.S. Lecture 18.pdfThe Economic History of the U.S. Lecture 18.pdf
The Economic History of the U.S. Lecture 18.pdfGale Pooley
 
(ANIKA) Budhwar Peth Call Girls Just Call 7001035870 [ Cash on Delivery ] Pun...
(ANIKA) Budhwar Peth Call Girls Just Call 7001035870 [ Cash on Delivery ] Pun...(ANIKA) Budhwar Peth Call Girls Just Call 7001035870 [ Cash on Delivery ] Pun...
(ANIKA) Budhwar Peth Call Girls Just Call 7001035870 [ Cash on Delivery ] Pun...ranjana rawat
 
The Economic History of the U.S. Lecture 20.pdf
The Economic History of the U.S. Lecture 20.pdfThe Economic History of the U.S. Lecture 20.pdf
The Economic History of the U.S. Lecture 20.pdfGale Pooley
 
Pooja 9892124323 : Call Girl in Juhu Escorts Service Free Home Delivery
Pooja 9892124323 : Call Girl in Juhu Escorts Service Free Home DeliveryPooja 9892124323 : Call Girl in Juhu Escorts Service Free Home Delivery
Pooja 9892124323 : Call Girl in Juhu Escorts Service Free Home DeliveryPooja Nehwal
 
Booking open Available Pune Call Girls Shivane 6297143586 Call Hot Indian Gi...
Booking open Available Pune Call Girls Shivane  6297143586 Call Hot Indian Gi...Booking open Available Pune Call Girls Shivane  6297143586 Call Hot Indian Gi...
Booking open Available Pune Call Girls Shivane 6297143586 Call Hot Indian Gi...Call Girls in Nagpur High Profile
 
Basic concepts related to Financial modelling
Basic concepts related to Financial modellingBasic concepts related to Financial modelling
Basic concepts related to Financial modellingbaijup5
 

Último (20)

The Economic History of the U.S. Lecture 19.pdf
The Economic History of the U.S. Lecture 19.pdfThe Economic History of the U.S. Lecture 19.pdf
The Economic History of the U.S. Lecture 19.pdf
 
06_Joeri Van Speybroek_Dell_MeetupDora&Cybersecurity.pdf
06_Joeri Van Speybroek_Dell_MeetupDora&Cybersecurity.pdf06_Joeri Van Speybroek_Dell_MeetupDora&Cybersecurity.pdf
06_Joeri Van Speybroek_Dell_MeetupDora&Cybersecurity.pdf
 
The Economic History of the U.S. Lecture 26.pdf
The Economic History of the U.S. Lecture 26.pdfThe Economic History of the U.S. Lecture 26.pdf
The Economic History of the U.S. Lecture 26.pdf
 
20240429 Calibre April 2024 Investor Presentation.pdf
20240429 Calibre April 2024 Investor Presentation.pdf20240429 Calibre April 2024 Investor Presentation.pdf
20240429 Calibre April 2024 Investor Presentation.pdf
 
Top Rated Pune Call Girls Viman Nagar ⟟ 6297143586 ⟟ Call Me For Genuine Sex...
Top Rated  Pune Call Girls Viman Nagar ⟟ 6297143586 ⟟ Call Me For Genuine Sex...Top Rated  Pune Call Girls Viman Nagar ⟟ 6297143586 ⟟ Call Me For Genuine Sex...
Top Rated Pune Call Girls Viman Nagar ⟟ 6297143586 ⟟ Call Me For Genuine Sex...
 
High Class Call Girls Nashik Maya 7001305949 Independent Escort Service Nashik
High Class Call Girls Nashik Maya 7001305949 Independent Escort Service NashikHigh Class Call Girls Nashik Maya 7001305949 Independent Escort Service Nashik
High Class Call Girls Nashik Maya 7001305949 Independent Escort Service Nashik
 
Log your LOA pain with Pension Lab's brilliant campaign
Log your LOA pain with Pension Lab's brilliant campaignLog your LOA pain with Pension Lab's brilliant campaign
Log your LOA pain with Pension Lab's brilliant campaign
 
Dharavi Russian callg Girls, { 09892124323 } || Call Girl In Mumbai ...
Dharavi Russian callg Girls, { 09892124323 } || Call Girl In Mumbai ...Dharavi Russian callg Girls, { 09892124323 } || Call Girl In Mumbai ...
Dharavi Russian callg Girls, { 09892124323 } || Call Girl In Mumbai ...
 
VIP Independent Call Girls in Andheri 🌹 9920725232 ( Call Me ) Mumbai Escorts...
VIP Independent Call Girls in Andheri 🌹 9920725232 ( Call Me ) Mumbai Escorts...VIP Independent Call Girls in Andheri 🌹 9920725232 ( Call Me ) Mumbai Escorts...
VIP Independent Call Girls in Andheri 🌹 9920725232 ( Call Me ) Mumbai Escorts...
 
The Economic History of the U.S. Lecture 17.pdf
The Economic History of the U.S. Lecture 17.pdfThe Economic History of the U.S. Lecture 17.pdf
The Economic History of the U.S. Lecture 17.pdf
 
03_Emmanuel Ndiaye_Degroof Petercam.pptx
03_Emmanuel Ndiaye_Degroof Petercam.pptx03_Emmanuel Ndiaye_Degroof Petercam.pptx
03_Emmanuel Ndiaye_Degroof Petercam.pptx
 
The Economic History of the U.S. Lecture 18.pdf
The Economic History of the U.S. Lecture 18.pdfThe Economic History of the U.S. Lecture 18.pdf
The Economic History of the U.S. Lecture 18.pdf
 
(ANIKA) Budhwar Peth Call Girls Just Call 7001035870 [ Cash on Delivery ] Pun...
(ANIKA) Budhwar Peth Call Girls Just Call 7001035870 [ Cash on Delivery ] Pun...(ANIKA) Budhwar Peth Call Girls Just Call 7001035870 [ Cash on Delivery ] Pun...
(ANIKA) Budhwar Peth Call Girls Just Call 7001035870 [ Cash on Delivery ] Pun...
 
The Economic History of the U.S. Lecture 20.pdf
The Economic History of the U.S. Lecture 20.pdfThe Economic History of the U.S. Lecture 20.pdf
The Economic History of the U.S. Lecture 20.pdf
 
VIP Call Girl Service Andheri West ⚡ 9920725232 What It Takes To Be The Best ...
VIP Call Girl Service Andheri West ⚡ 9920725232 What It Takes To Be The Best ...VIP Call Girl Service Andheri West ⚡ 9920725232 What It Takes To Be The Best ...
VIP Call Girl Service Andheri West ⚡ 9920725232 What It Takes To Be The Best ...
 
Pooja 9892124323 : Call Girl in Juhu Escorts Service Free Home Delivery
Pooja 9892124323 : Call Girl in Juhu Escorts Service Free Home DeliveryPooja 9892124323 : Call Girl in Juhu Escorts Service Free Home Delivery
Pooja 9892124323 : Call Girl in Juhu Escorts Service Free Home Delivery
 
VIP Independent Call Girls in Bandra West 🌹 9920725232 ( Call Me ) Mumbai Esc...
VIP Independent Call Girls in Bandra West 🌹 9920725232 ( Call Me ) Mumbai Esc...VIP Independent Call Girls in Bandra West 🌹 9920725232 ( Call Me ) Mumbai Esc...
VIP Independent Call Girls in Bandra West 🌹 9920725232 ( Call Me ) Mumbai Esc...
 
Booking open Available Pune Call Girls Shivane 6297143586 Call Hot Indian Gi...
Booking open Available Pune Call Girls Shivane  6297143586 Call Hot Indian Gi...Booking open Available Pune Call Girls Shivane  6297143586 Call Hot Indian Gi...
Booking open Available Pune Call Girls Shivane 6297143586 Call Hot Indian Gi...
 
(INDIRA) Call Girl Mumbai Call Now 8250077686 Mumbai Escorts 24x7
(INDIRA) Call Girl Mumbai Call Now 8250077686 Mumbai Escorts 24x7(INDIRA) Call Girl Mumbai Call Now 8250077686 Mumbai Escorts 24x7
(INDIRA) Call Girl Mumbai Call Now 8250077686 Mumbai Escorts 24x7
 
Basic concepts related to Financial modelling
Basic concepts related to Financial modellingBasic concepts related to Financial modelling
Basic concepts related to Financial modelling
 

TJX Financial Statements

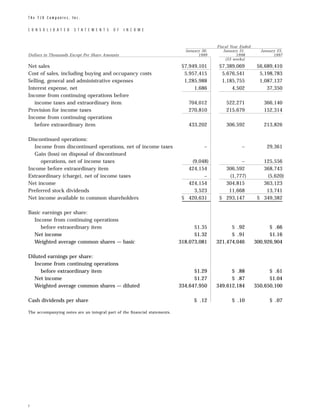
  • 1. The TJX Companies, Inc. CONSOLIDATED STATEMENTS OF INCOME Fiscal Year Ended January 30, January 31, January 25, Dollars in Thousands Except Per Share Amounts 1999 1998 1997 (53 weeks) Net sales $7,949,101 $7,389,069 $6,689,410 Cost of sales, including buying and occupancy costs 5,957,415 5,676,541 5,198,783 Selling, general and administrative expenses 1,285,988 1,185,755 1,087,137 Interest expense, net 1,686 4,502 37,350 Income from continuing operations before income taxes and extraordinary item 704,012 522,271 366,140 Provision for income taxes 270,810 215,679 152,314 Income from continuing operations before extraordinary item 433,202 306,592 213,826 Discontinued operations: Income from discontinued operations, net of income taxes – – 29,361 Gain (loss) on disposal of discontinued operations, net of income taxes (9,048) – 125,556 Income before extraordinary item 424,154 306,592 368,743 Extraordinary (charge), net of income taxes – (1,777) (5,620) Net income 424,154 304,815 363,123 Preferred stock dividends 3,523 11,668 13,741 Net income available to common shareholders $ 420,631 $ 293,147 $ 349,382 Basic earnings per share: Income from continuing operations before extraordinary item $1.35 $0.92 $ .66 Net income $1.32 $0.91 $1.16 Weighted average common shares — basic 318,073,081 321,474,046 300,926,904 Diluted earnings per share: Income from continuing operations before extraordinary item $1.29 $0.88 $ .61 Net income $1.27 $0.87 $1.04 Weighted average common shares — diluted 334,647,950 349,612,184 350,650,100 Cash dividends per share $ .12 $0.10 $ .07 The accompanying notes are an integral part of the financial statements. 2
  • 2. The TJX Companies, Inc. CONSOLIDATED BALANCE SHEETS January 30, January 31, In Thousands 1999 1998 Assets Current assets: Cash and cash equivalents $ 461,244 $ 404,369 Accounts receivable 67,345 60,735 Merchandise inventories 1,186,068 1,190,170 Prepaid expenses 28,448 27,357 Total current assets 1,743,105 1,682,631 Property at cost: Land and buildings 115,485 108,729 Leasehold costs and improvements 547,099 480,964 Furniture, fixtures and equipment 711,320 611,470 1,373,904 1,201,163 Less: accumulated depreciation and amortization 617,302 515,027 756,602 686,136 Other assets 27,436 36,645 Deferred income taxes 22,386 – Goodwill and tradename, net of amortization 198,317 204,220 Total Assets $2,747,846 $2,609,632 Liabilities Current liabilities: Current installments of long-term debt $ 694 $ 23,360 Accounts payable 617,159 582,791 Accrued expenses and other current liabilities 688,993 611,506 Total current liabilities 1,306,846 1,217,657 Long-term debt, exclusive of current installments 220,344 221,024 Deferred income taxes – 6,859 Shareholders’ Equity Preferred stock at face value, authorized 5,000,000 shares, par value $1, issued and outstanding cumulative convertible stock of 727,300 shares of 7% Series E at January 31, 1998 – 72,730 Common stock, authorized 600,000,000 shares, par value $1, issued and outstanding 322,140,770 and 159,901,247 shares 322,141 159,901 Additional paid-in capital – 198,736 Accumulated other comprehensive income (loss) (1,529) 3,317 Retained earnings 900,044 729,408 Total shareholders’ equity 1,220,656 1,164,092 Total Liabilities and Shareholders’ Equity $2,747,846 $2,609,632 The accompanying notes are an integral part of the financial statements. 3
  • 3. The TJX Companies, Inc. CONSOLIDATED STATEMENTS OF CASH FLOWS Fiscal Year Ended January 30, January 31, January 25, In Thousands 1999 1998 1997 (53 weeks) Cash flows from operating activities: Net income $ 424,154 $ 304,815 $ 363,123 Adjustments to reconcile net income to net cash provided by operating activities: (Income) from discontinued operations, net of income taxes – – (29,361) Loss (gain) on disposal of discontinued operations 9,048 – (125,556) Extraordinary charge – 1,777 5,620 Depreciation and amortization 136,531 124,891 126,830 Property disposals and asset write-downs 6,037 18,778 25,399 Other, net (6,296) (3,928) (732) Changes in assets and liabilities, excluding effect of acquisitions and dispositions: (Increase) in accounts receivable (6,610) (3,460) (2,131) (Increase) decrease in merchandise inventories 4,102 (130,665) 198,983 (Increase) decrease in prepaid expenses (1,091) (10,978) 27 Increase in accounts payable 34,368 48,846 95,677 Increase in accrued expenses and other current liabilities 62,491 39,184 11,928 (Decrease) in deferred income taxes (19,965) (3,793) (5,344) Net cash provided by operating activities 642,769 385,467 664,463 Cash flows from investing activities: Property additions (207,742) (192,382) (119,153) Proceeds from sale of other assets 9,421 15,697 – Acquisition of Marshalls, net of cash acquired – – (49,327) Proceeds from (adjustments to) sale of discontinued operations – (33,190) 222,800 Net cash provided by (used in) investing activities (198,321) (209,875) 54,320 Cash flows from financing activities: Principal payments on long-term debt (23,360) (27,179) (46,506) Prepayment of long-term debt – – (455,560) Proceeds from sale and issuance of common stock, net 27,763 15,471 34,395 Stock repurchased (350,319) (245,198) – Cash dividends (41,657) (43,500) (35,019) Net cash (used in) financing activities (387,573) (300,406) (502,690) Net cash provided by (used in) continuing operations 56,875 (124,814) 216,093 Net cash provided by discontinued operations – 54,451 49,413 Net increase (decrease) in cash and cash equivalents 56,875 (70,363) 265,506 Cash and cash equivalents at beginning of year 404,369 474,732 209,226 Cash and cash equivalents at end of year $ 461,244 $ 404,369 $ 474,732 The accompanying notes are an integral part of the financial statements. 4
  • 4. The TJX Companies, Inc. CONSOLIDATED STATEMENTS OF SHAREHOLDERS’ EQUITY Accumulated Preferred Common Additional Other Stock Stock, Par Paid-in Comprehensive Retained In Thousands Face Value Value $1 Capital Income (Loss) Earnings Total Balance, January 27, 1996 $282,500 $ 72,486 $ 270,839 $(1,680) $ 140,489 $ 764,634 Comprehensive income: Net income – – – – 363,123 363,123 Foreign currency translation – – – 642 – 642 Total comprehensive income 363,765 Cash dividends: Preferred stock – – – – (13,741) (13,741) Common stock – – – – (21,278) (21,278) Conversion of cumulative preferred stock into common stock: Series A (25,000) 1,190 23,810 – – – Series C (82,500) 3,178 79,322 – – – Series D (25,000) 1,350 23,650 – – – Issuance of common stock under stock incentive plans and related tax benefits – 1,372 32,786 – – 34,158 Other – – (352) – – (352) Balance, January 25, 1997 150,000 79,576 430,055 (1,038) 468,593 1,127,186 Comprehensive income: Net income – – – – 304,815 304,815 Foreign currency translation – – – (643) – (643) Unrealized gains on securities – – – 4,998 – 4,998 Total comprehensive income 309,170 Cash dividends: Preferred stock – – – – (11,668) (11,668) Common stock – – – – (31,832) (31,832) Conversion of cumulative Series E preferred stock into common stock (77,020) 8,315 68,705 – – – Stock repurchased: Preferred (250) – – – (500) (750) Common – (8,528) (235,920) – – (244,448) Stock split, two-for-one – 79,823 (79,823) – – – Issuance of common stock under stock incentive plans and related tax benefits – 715 15,719 – – 16,434 Balance, January 31, 1998 72,730 159,901 198,736 3,317 729,408 1,164,092 Comprehensive income: Net income – – – – 424,154 424,154 Foreign currency translation – – – 152 – 152 Reclassification of unrealized gains – – – (4,998) – (4,998) Total comprehensive income 419,308 Cash dividends: Preferred stock – – – – (3,523) (3,523) Common stock – – – – (38,134) (38,134) Conversion of cumulative Series E preferred stock into common stock (72,730) 14,682 58,048 – – – Common stock repurchased – (12,998) (187,859) – (149,462) (350,319) Stock split, two-for-one – 158,954 (96,555) – (62,399) – Issuance of common stock under stock incentive plans and related tax benefits – 1,602 27,630 – – 29,232 Balance, January 30, 1999 $ – $322,141 $ – $(1,529) $ 900,044 $1,220,656 The accompanying notes are an integral part of the financial statements. 5
  • 5. The TJX Companies, Inc. SELECTED INFORMATION BY MAJOR BUSINESS SEGMENT Fiscal Year Ended January 30, January 31, January 25, In Thousands 1999 1998 1997 (53 weeks) Net sales: Off-price family apparel stores $7,816,563 $7,290,959 $6,602,391 Off-price home fashion stores 132,538 98,110 87,019 $7,949,101 $7,389,069 $6,689,410 Operating income (loss): Off-price family apparel stores $ 782,706 $ 596,908 $ 463,419 Off-price home fashion stores (1) (4,950) (8,615) (14,018) 777,756 588,293 449,401 General corporate expense (2) 69,449 58,906 43,297 Goodwill amortization 2,609 2,614 2,614 Interest expense, net 1,686 4,502 37,350 Income from continuing operations before income taxes and extraordinary item $ 704,012 $ 522,271 $ 366,140 Identifiable assets: Off-price family apparel stores $2,093,879 $2,033,945 $1,801,779 Off-price home fashion stores 49,515 39,074 36,493 (3) Corporate, primarily cash, goodwill and deferred taxes 604,452 536,613 668,489 $2,747,846 $2,609,632 $2,506,761 Capital expenditures: Off-price family apparel stores $ 202,054 $ 190,720 $ 104,955 Off-price home fashion stores 5,688 1,662 731 Corporate (3) – – 13,467 $ 207,742 $ 192,382 $ 119,153 Depreciation and amortization: Off-price family apparel stores $ 130,325 $ 115,967 $ 113,479 Off-price home fashion stores 3,302 3,186 2,104 Corporate, including goodwill (3) 2,904 5,738 11,247 $ 136,531 $ 124,891 $ 126,830 (1) The periods ended January 30, 1999, January 31, 1998, and January 25, 1997 include a charge of $2.2 million, $1.5 million and $3.1 million, respectively, for certain store closings and other restructuring costs relating to HomeGoods. (2) General corporate expense for the fiscal year ended January 30, 1999 includes a pre-tax charge of $6.3 million for costs associated with a fiscal 1998 executive deferred compensation award and a $7.5 million charitable donation to The TJX Foun- dation. General corporate expense for the fiscal year ended January 31, 1998 includes a pre-tax charge of $15.2 million for costs associated with the foregoing executive deferred compensation award and a pre-tax gain of $6 million for the sale of Brylane, Inc. common stock. General corporate expense for the fiscal year ended January 25, 1997 includes the net operating results of T.K. Maxx. Fiscal years 1999 and 1998 include the operating results of T.K. Maxx in the off-price family apparel stores segment. (3) The period ended January 25, 1997 includes assets and activity of T.K. Maxx. Fiscal years 1999 and 1998 include T.K. Maxx in the off-price family apparel stores segment. 6
  • 6. The TJX Companies, Inc. NOTES TO CONSOLIDATED FINANCIAL STATEMENTS Summary of Accounting Policies The Company’s fiscal year ends on the last Saturday in January. The fiscal year ended Janu- Fiscal Year: ary 31, 1998 (fiscal 1998) included 53 weeks. The fiscal years ended January 30, 1999 and January 25, 1997 each included 52 weeks. o f P r e s e n t a t i o n : The consolidated financial statements of The TJX Companies, Inc. include Basis the financial statements of all the Company’s wholly-owned subsidiaries, including its foreign subsidiaries. The financial statements for the applicable periods present the Company’s former Chad- wick’s and Hit or Miss divisions as discontinued operations. The notes pertain to continuing operations except where otherwise noted. The preparation of the financial statements, in conformity with generally accepted accounting principles, requires management to make estimates and assumptions that affect the reported amounts of assets and liabilities, and disclosure of contingent liabilities, at the date of the financial statements as well as the reported amounts of revenues and expenses during the reporting period. Actual results could differ from those estimates. E q u i v a l e n t s : The Company generally considers highly liquid investments with an initial matu- Cash rity of three months or less to be cash equivalents. The Company’s investments are primarily high grade commercial paper, institutional money market funds and time deposits with major banks. The fair value of cash equivalents approximates carrying value. I n v e n t o r i e s : Inventories are stated at the lower of cost or market. The Company uses Merchandise the retail method for valuing inventories on the first-in first-out basis. a n d A m o r t i z a t i o n : For financial reporting purposes, the Company provides for Depreciation depreciation and amortization of property principally by the use of the straight-line method over the esti- mated useful lives of the assets. Buildings are depreciated over 33 years, leasehold costs and improvements are generally amortized over the lease term or their estimated useful life, whichever is shorter, and furni- ture, fixtures and equipment are depreciated over 3 to 10 years. Maintenance and repairs are charged to expense as incurred. Upon retirement or sale, the cost of disposed assets and the related depreciation are eliminated and any gain or loss is included in net income. Debt discount and related issue expenses are amortized over the lives of the related debt issues. Pre-opening costs are expensed as incurred. G o o d w i l l a n d T r a d e n a m e : Goodwill is primarily the excess of the purchase price incurred over the carrying value of the minority interest in the Company’s former 83%-owned subsidiary. The minority interest was acquired pursuant to the Company’s fiscal 1990 restructuring. In addition, goodwill includes the excess of cost over the estimated fair market value of the net assets of Winners Apparel Ltd., acquired by the Company effective May 31, 1990. Goodwill totaled $79.3 million, net of amortization, as of January 30, 1999 and is being amortized over 40 years. Annual amortization of goodwill was $2.6 million in fiscal years 1999, 1998 and 1997. Cumulative amortization as of January 30, 1999 and January 31, 1998 was $25.1 million and $22.5 million, respectively. 7
  • 7. Tradename is the value assigned to the name “Marshalls” as a result of the Company’s acquisition of the Marshalls chain on November 17, 1995. The final allocation of the purchase price of Marshalls, pursuant to the purchase accounting method, resulted in $130.0 million being allocated to the tradename. The value of the tradename was determined by the discounted present value of assumed after-tax royalty payments, offset by a reduction for its pro-rata share of the total negative goodwill acquired (see Note A). The tradename is deemed to have an indefinite life and accordingly is being amortized over 40 years. Amortization expense was $3.2 million, $3.4 million and $3.7 million for fiscal years 1999, 1998 and 1997, respectively. Cumulative amortization as of January 30, 1999 and January 31, 1998 was $11.0 million and $7.8 million, respectively. I m p a i r m e n t o f L o n g - L i v e d A s s e t s : The Company periodically reviews the value of its property and intangible assets in relation to the current and expected operating results of the related business segments in order to assess whether there has been a permanent impairment of their carrying values. During the fiscal year ended January 25, 1997, the Company recorded a $12.2 million impairment charge, relating to the T.J. Maxx distribution facilities, which has been included in selling, general and administrative expenses. The Company expenses advertising costs during the fiscal year incurred. Advertising Costs: P e r S h a r e : Statement of Financial Accounting Standards (SFAS) No. 128 “Earnings per Earnings Share” requires the presentation of “basic” and “diluted” earnings per share. Basic earnings per share is based on a simple weighted average of common stock outstanding. Diluted earnings per share includes the dilutive effect of convertible securities and other common stock equivalents. See Note F for a computation of basic and diluted earnings per share. All earnings per share amounts discussed refer to diluted earnings per share unless otherwise indicated. Prior period earnings per share amounts have been restated for the June 1998 and June 1997 two-for-one stock splits. F o r e i g n C u r r e n c y T r a n s l a t i o n : The Company’s foreign assets and liabilities are translated at the year-end exchange rate and income statement items are translated at the average exchange rates prevailing during the year. A large portion of the Company’s net investment in foreign operations is hedged with foreign currency swap agreements and forward contracts. The translation adjustment associated with the foreign operations and the related hedging instruments are included in shareholders’ equity as a component of comprehensive income (loss). Cumulative foreign currency translation adjustments included in shareholders’ equity amounted to losses of $1.5 million as of January 30, 1999 and $1.7 million as of January 31, 1998. During 1997, the Financial Accounting Standards Board (FASB) New Accounting Standards: issued Statement of Financial Accounting Standards (SFAS) No. 130, “Reporting Comprehensive Income.” This Statement specifies the computation, presentation and disclosures for components of comprehensive income. The Company adopted SFAS No. 130 in the first quarter ended May 2, 1998 and presents compre- hensive income as a component of shareholders’ equity. Also during 1997, the FASB issued SFAS No. 131, “Disclosure about Segments of an Enterprise and Related Information.” This new standard did not result in any changes to the Company’s reportable segments or in the information disclosed about its segments (see Note L). During 1998, the FASB issued SFAS No. 133, “Accounting for Derivative Instruments and Hedging Activities.” This Statement established accounting and reporting standards for derivative instruments, including certain derivative instruments embedded in other contracts, and for hedging activities. This State- ment requires that an entity recognize all derivatives as either assets or liabilities in the statements of finan- cial position and measure those instruments at fair value. The Company believes that the impact of implementation of this new standard will be immaterial. The Company will adopt SFAS No. 133 in its fiscal year ending January 27, 2001 or earlier. Certain amounts in prior years’ financial statements have been reclassified for comparative purposes. Other: 8
  • 8. A. Dispositions and Acquisitions o f C h a d w i c k ’ s o f B o s t o n : During the fourth quarter of fiscal 1997, the Company sold its Sale Chadwick’s of Boston catalog division to Brylane, L.P. (Brylane). Proceeds of approximately $300 million included cash, a 10 year $20 million Convertible Subordinated Note at 6% interest (the “Brylane note”) and Chadwick’s consumer credit card receivables. During fiscal 1998, the Company paid Brylane $33.2 million as a final settlement of the sale proceeds based upon the final closing balance sheet of Chadwick’s as of December 7, 1996. Also, pursuant to the disposition, the Company agreed to purchase certain amounts of excess inventory from Chadwick’s through fiscal 2000. This arrangement has subsequently been amended and extended through fiscal 2002. The results of Chadwick’s for all periods prior to December 7, 1996 have been reclassified to discontinued operations. The cash provided by discontinued operations for fiscal 1998 represents the collection of the remaining balance of the Chadwick’s consumer credit card receivables outstanding as of January 25, 1997. During fiscal 1998, the Company converted a portion of the Brylane note into 352,908 shares of Brylane, Inc. common stock which it sold for $15.7 million. This sale resulted in an after-tax gain of $3.6 million, or $.01 per share. During fiscal 1999 the balance of the note was converted into shares of Brylane common stock. A portion of the shares were donated to the Company’s charitable founda- tion, and the remaining shares were sold. The net pre-tax impact of these transactions was immaterial. The Chadwick’s of Boston catalog division had net sales of $464.8 million and recorded income from opera- tions of $29.4 million, net of income taxes of $20.9 million, for the fiscal year ended January 25, 1997, which represents this division’s results through December 7, 1996, the effective date of the transaction. The results of Chadwick’s for all periods prior to December 7, 1996 have been reclassified to discontinued operations. The sale of the division resulted in a gain on disposal of $125.6 million, net of income taxes of $15.2 million, or $.36 per share. This gain allowed the Company to utilize its $139 million capital loss carry forward. Interest expense was allocated to discontinued operations based on their respective proportion of assets to total assets. o f H i t o r M i s s : Effective September 30, 1995, the Company sold its Hit or Miss division to Sale members of Hit or Miss management and outside investors. The Company received $3 million in cash and a 7 year $10 million note with interest at 10%. During fiscal 1998, the Company forgave a portion of this note and was released from certain obligations and guarantees which reduced the note to $5.5 million. During fiscal 1999 the Company settled the note for $2.0 million, the balance of $3.5 million was charged to selling, general and administrative expenses. o f M a r s h a l l s : On November 17, 1995, the Company acquired the Marshalls family Acquisition apparel chain from Melville Corporation. The Company paid $424.3 million in cash and $175 million in junior convertible preferred stock. The total purchase price of Marshalls, including acquisition costs of $6.7 million, was $606 million. The acquisition has been accounted for using the purchase method of accounting and accordingly, the purchase price has been allocated to the assets purchased and the liabilities assumed based upon their fair values at the date of acquisition. The purchase accounting method allows a one year period to finalize the fair values of the net assets acquired. No further adjustments to fair market values are made after that point. The final allocation of purchase price resulted in the fair value of the net assets acquired exceeding the purchase price, creating negative goodwill of $86.4 million. The negative goodwill was allocated to the long- term assets acquired. During fiscal 1998, the store closing and restructuring reserve established in the final allocation of the purchase price was reduced by an additional $15.8 million as the Company closed fewer stores than initially planned. The $15.8 million reserve reduction was offset by a reduction of $10.0 million to property, plant and equipment and a reduction of $5.8 million to tradename. The final allocation of purchase price, as adjusted for the reserve adjustment in fiscal 1998, is summarized below: In Thousands Current assets $ 718,627 Property, plant and equipment 227,071 Tradename 130,046 Current liabilities (469,744) Total purchase price $ 606,000 The operating results of Marshalls have been included in the consolidated results of the Company from the date of acquisition on November 17, 1995. 9
  • 9. B. Long-Term Debt and Credit Lines At January 30, 1999 and January 31, 1998, long-term debt, exclusive of current installments, consisted of the following: January 30, January 31, In Thousands 1999 1998 Equipment notes, interest at 11% to 11.25% maturing December 12, 2000 to December 30, 2001 $ 433 $ 1,127 General corporate debt: Medium term notes, interest at 5.87% to 7.97%, $15 million maturing on October 21, 2003 and $5 million on September 20, 2004 20,000 20,000 65⁄8% unsecured notes, maturing June 15, 2000 100,000 100,000 7% unsecured notes, maturing June 15, 2005 (effective interest rate of 7.02% after reduction of the unamortized debt discount of $89,000 and $103,000 in fiscal 1999 and 1998, respectively) 99,911 99,897 Total general corporate debt 219,911 219,897 Long-term debt, exclusive of current installments $220,344 $221,024 The aggregate maturities of long-term debt, exclusive of current installments, at January 30, 1999 are as follows: General Equipment Corporate In Thousands Notes Debt Total Fiscal Year 2001 $348 $100,000 $100,348 2002 85 – 85 2003 – – – 2004 – 15,000 15,000 Later years – 104,911 104,911 Aggregate maturities of long-term debt, exclusive of current installments $433 $219,911 $220,344 On September 16, 1996, pursuant to a call for redemption, the Company prepaid $88.8 million of its 91⁄2% sinking fund debentures. The Company recorded an after-tax extraordinary charge of $2.9 million, or $.01 per common share, related to the early retirement of this debt. The Company paid the outstanding balance of $8.5 million during fiscal 1998 utilizing an optional sinking fund payment under the indenture. In June 1995, the Company filed a shelf registration statement with the Securities and Exchange Commission which provided for the issuance of up to $250 million of long-term debt. This shelf registration statement was replaced by a new shelf registration statement filed in fiscal 1997 which currently provides for the issuance of up to $600 million of debt, common stock or preferred stock. In June 1995, the Company issued $200 million of long-term notes under the original registration statement; $100 million of 6 5⁄8% notes due June 15, 2000 and $100 million of 7% notes due June 15, 2005. The proceeds were used in part to repay short-term borrowings and for general corporate purposes, including the repayment of scheduled maturities of other outstanding long-term debt and for new store and other capital expenditures. On November 17, 1995, the Company entered into an unsecured $875 million bank credit agreement under which the Company borrowed $375 million on a term loan basis to fund the cash portion of the Marshalls purchase price. During the fourth quarter of the fiscal year ended January 25, 1997, the Company prepaid the outstanding balance of the $375 million term loan and recorded an after-tax extraordinary charge of $2.7 million, or $.01 per share, for the early retirement of this debt. The agreement also allowed the Company to borrow up to an additional $500 million on a revolving loan basis to fund the working capi- tal needs of the Company. In September 1997, the Company replaced this $500 million revolving credit agreement with a new five year $500 million revolving credit facility. The Company recorded an extraordi- nary charge of $1.8 million associated with the write-off of deferred financing costs of the former agreement. 10
  • 10. The new agreement provides for reduced commitment fees on the unused portion of the line, as well as lower borrowing costs and has certain financial covenants which include a minimum net worth requirement, and certain leverage and fixed charge covenants. As of January 30, 1999, all $500 million of the revolving credit facility was available for use. Interest is payable on borrowings at rates equal to or less than prime. The revolving credit facility is used as backup to the Company’s commercial paper program. The Company had no short-term borrowings under this facil- ity or its commercial paper program during fiscal 1999 or 1998. Excluding the Company’s foreign subsidiaries, the weighted average interest rate on the Company’s short-term borrowings under the former agreement was 5.81% in fiscal 1997. The Company does not have any compensating balance requirements under these arrangements. The Company also has C$40 million of credit lines for its Canadian operation, all of which were available as of January 30, 1999. C. Financial Instruments The Company periodically enters into forward foreign exchange contracts to hedge firm U.S. dollar merchandise purchase commitments made by its foreign subsidiaries. As of January 30, 1999, the Company had $18.8 million of such contracts outstanding for its Canadian subsidiary and $3.3 million for its subsidiary in the United Kingdom. The contracts cover certain commitments for the first quarter of fiscal 2000 and any gains or losses on the contracts will ultimately be reflected in the cost of the merchandise. Deferred gains and losses on the contracts as of January 30, 1999 were immaterial. The Company also has entered into several foreign currency swap and forward contracts in both Cana- dian dollars and British pounds sterling. Both the swap and forward agreements are accounted for as a hedge against the Company’s investment in foreign subsidiaries; thus, foreign exchange gains and losses on the agreements are recognized in shareholders’ equity thereby offsetting translation adjustments associated with the Company’s investment in foreign operations. The gains and losses on this hedging activity as of January 30, 1999 are immaterial. The Canadian swap and forward agreements will require the Company to pay C$41.7 million in exchange for $31.2 million in U.S. currency between October 2003 and September 2004. The British pounds sterling swap and forward agreements will require the Company to pay £59.9 million between October 1999 and September 2002 in exchange for $94.1 million in U.S. currency. The agreements contain rights of offset which minimize the Company’s exposure to credit loss in the event of nonperformance by one of the counterparties. The interest rates payable on the foreign currency swap agreements are slightly higher than the interest rates receivable on the currency exchanged, resulting in deferred interest costs which are being amortized to interest expense over the term of the related agree- ments. The premium costs or discounts associated with the forward contracts are being amortized over the term of the related agreements and are included with the gains or losses of the hedging instrument. The unamortized balance of the net deferred costs was $3.2 million and $4.3 million as of January 30, 1999 and January 31, 1998, respectively. The counterparties to the exchange contracts and swap agreements are major international financial institutions. The Company periodically monitors its position and the credit ratings of the counterparties and does not anticipate losses resulting from the nonperformance of these institutions. The fair value of the Company’s long-term debt, including current installments, is estimated using discounted cash flow analysis based upon the Company’s current incremental borrowing rates for similar types of borrowing arrangements. The fair value of long-term debt, including current installments, at January 30, 1999 is estimated to be $234.7 million compared to a carrying value of $221.0 million. These estimates do not necessarily reflect certain provisions or restrictions in the various debt agreements which might affect the Company’s ability to settle these obligations. 11
  • 11. D. Commitments The Company is committed under long-term leases related to its continuing operations for the rental of real estate, and fixtures and equipment. T.J. Maxx leases are generally for a ten year initial term with options to extend for one or more five year periods. Marshalls leases, acquired in fiscal 1996, have remaining terms ranging up to twenty-five years. In addition, the Company is generally required to pay insurance, real estate taxes and other operating expenses including, in some cases, rentals based on a percentage of sales. Following is a schedule of future minimum lease payments for continuing operations as of January 30, 1999: In Thousands Operating Leases Fiscal Year 2000 $ 328,187 2001 311,247 2002 284,097 2003 260,927 2004 229,949 Later years 1,040,217 Total future minimum lease payments $2,454,624 The rental expense under operating leases for continuing operations amounted to $318.1 million, $301.9 million and $293.5 million for fiscal years 1999, 1998 and 1997, respectively. The present value of the Company’s operating lease obligations approximates $1,693.3 million as of January 30, 1999, including $199.0 million payable in fiscal 2000. The Company had outstanding letters of credit in the amount of $40.4 million as of January 30, 1999. Letters of credit are issued by the Company primarily for the purchase of inventory. E. Stock Compensation Plans In the following note, all references to historical awards, outstanding awards and availability of shares for future grants under the Company’s Stock Incentive Plan and related prices per share have been restated, for comparability purposes, for the two-for-one stock splits distributed in June 1998 and June 1997. The Company has a Stock Incentive Plan under which options and other stock awards may be granted to certain officers and key employees. The Stock Incentive Plan, as amended, provides for the issuance of up to 42 million shares with 15.7 million shares available for future grants as of January 30, 1999. The Company also has a Directors’ Stock Option Plan under which stock options are granted to directors who are not otherwise employed by the Company. This plan provides for the issuance of up to 200,000 shares. There are 94,000 shares available for future grants under this plan as of January 30, 1999. Under its stock option plans, the Company has granted options for the purchase of common stock, gener- ally within ten years from the grant date at option prices of 100% of market price on the grant date. Most options outstanding are exercisable at various percentages starting one year after the grant, while certain options are exercisable in their entirety three years after the grant date. Options granted to directors become fully exercisable one year after the date of grant. A summary of the status of the Company’s stock options and related Weighted Average Exercise Prices (“WAEP”), adjusted for the two-for-one stock splits distributed in June 1998 and June 1997 is presented below (shares in thousands): Fiscal Year Ended January 30, 1999 January 31, 1998 January 25, 1997 Shares WAEP Shares WAEP Shares WAEP Outstanding, beginning of year 10,507 $ 9.04 8,192 $ 6.10 11,248 $4.59 Granted 1,964 21.77 4,338 12.97 2,852 8.72 Exercised (2,215) 6.31 (1,756) 5.31 (5,448) 4.45 Canceled (151) 13.35 (267) 7.31 (460) 4.95 Outstanding, end of year 10,105 $12.04 10,507 $ 9.04 8,192 $6.10 Options exercisable, end of year 4,796 3,932 3,412 12
  • 12. The Company realizes an income tax benefit from the exercise of stock options. This benefit results in a decrease in current income taxes payable and an increase in additional paid-in capital. Such benefits amounted to $13.8 million, $6.1 million and $10.2 million for the fiscal years ended January 30, 1999, January 31, 1998 and January 25, 1997, respectively. The Company has adopted the disclosure-only provisions of Statement of Financial Accounting Standards (SFAS) No. 123, “Accounting for Stock-Based Compensation,” and continues to apply the provisions of APB Opinion No. 25, “Accounting for Stock Issued to Employees,” in accounting for compensation expense under its stock option plans. The Company grants options at fair market value on the date of the grant; accord- ingly, no compensation expense has been recognized for the stock options issued during fiscal years 1999, 1998 or 1997. Had compensation expense been determined in accordance with SFAS No. 123, the Company’s income from continuing operations, net income and related earnings per share amounts would have been reduced to the unaudited pro forma amounts indicated below: Unaudited Pro Forma Fiscal Year Ended January 30, January 31, January 25, Dollars in Thousands Except Per Share Amounts 1999 1998 1997 (53 weeks) Income from continuing operations before extraordinary item $424,512 $301,129 $211,893 Per diluted share $ 1.27 $ .86 $ .60 Net income $415,464 $299,352 $361,190 Per diluted share $ 1.24 $ .85 $ 1.03 For purposes of applying the provisions of SFAS No. 123 for the pro forma calculations, the fair value of each option grant issued during fiscal 1999, 1998 and 1997 is estimated on the date of grant using the Black- Scholes option pricing model with the following assumptions: dividend yield 1% in 1999, 1998 and 1997, expected volatility of 40% in fiscal 1999 and 38% in both fiscal 1998 and 1997, a risk-free interest rate of 5.0% in fiscal 1999, 5.8% in fiscal 1998 and 6.7% in fiscal 1997, and expected holding periods of six years in all fiscal periods. The weighted average fair value of options granted during fiscal 1999, 1998 and 1997 was $9.28, $5.52 and $3.88 per share, respectively. The effects of applying SFAS No. 123 in this pro forma disclosure are not indicative of future amounts. SFAS No. 123 does not apply to awards prior to 1995, and additional awards in future years are anticipated. The following table summarizes information about stock options outstanding as of January 30, 1999 (shares in thousands): Options Outstanding Options Exercisable Weighted Average Range of Remaining Weighted Average Weighted Average Exercise Prices Shares Contract Life Exercise Price Shares Exercise Price $ 2.5625–$ 6.3125 2,209 5.3 Years $ 4.73 2,209 $ 4.73 $ 6.3126–$10.6875 3,255 7.7 Years 9.56 1,847 9.36 $10.6876–$14.4688 2,694 8.5 Years 14.01 740 14.42 $14.4689–$23.9375 1,947 9.6 Years 21.77 – – Total 10,105 7.8 Years $12.04 4,796 $ 8.01 During fiscal 1998, a special deferred compensation award was granted to the Company’s Chief Executive Officer initially denominated in 900,000 shares of the Company’s stock with a fair value of $10.69 per share at the date of grant. The shares vested at the time of the grant and the Company recorded a deferred compensation charge of $9.6 million at the time of the grant. The executive may elect to have such grant denominated into other investments. The Company does not anticipate that the shares will be issued and therefore does not consider them for diluted earnings per share calculations and adjusts the compensation charge for changes in the market value of the stock through the date an election is made to denominate into other investments. The Company recorded additional expense of $6.3 and $5.6 million in fiscal 1999 and 1998, respectively, due to the increase in market value of the shares of Company stock from date of grant. During fiscal 1999 elections were made to denominate 650,000 shares of Company stock into other invest- ments. The Company separately transfers funds to a trust in an amount equal to the value of the executive’s new investment elections. The trust assets, included with other assets on the balance sheet, are invested in a manner that matches the elections made by the executive. 13
  • 13. The Company has also issued restricted stock and performance based stock awards under the Stock Incentive Plan. Restricted stock awards are issued at par value, or at no cost, and have restrictions which generally lapse over three to five years from date of grant. At January 31, 1998, the performance based stock awards had either vested or been forfeited. The market value in excess of cost is charged to income ratably over the period during which these awards vest, such pre-tax charges amounted to $600,000, $2.7 million and $2.5 million in fiscal years 1999, 1998 and 1997, respectively. The market value of the awards is determined at date of grant for restricted stock awards, and at the date shares are earned for performance based awards. There has been a combined total of 4,000 shares, 1,023,834 shares and 70,000 shares for deferred, restricted and performance based awards issued for the fiscal years ended January 1999, 1998 and 1997, respectively. There were 300,000 shares forfeited for the fiscal year ended January 1998, no shares were forfeited during fiscal years ended January 1999 or 1997. The weighted average market value per share of these stock awards at grant date was $18.03, $10.89 and $5.99 for fiscal 1999, 1998 and 1997, respectively. During fiscal 1998, the Company formed a deferred stock compensation plan for its outside directors which replaced the Company’s retirement plan for directors. Each director’s deferred stock account has been credited with deferred stock to compensate for the value of such director’s accrued retirement benefit. Additional share awards valued at $10,000 are issued annually to each eligible director. Currently there are 24,966 deferred shares outstanding, actual shares will be issued at retirement. The Company has 100,000 shares held in treasury from which the Company will issue such shares. F. Capital Stock and Earnings Per Share The Company distributed a two-for-one stock split, effected in the form of a 100% stock Capital Stock: dividend, on June 25, 1998 to shareholders of record on June 11, 1998, which resulted in the issuance of 158.9 million shares of common stock and corresponding decreases of $96.5 million in additional paid-in capital and $62.4 million in retained earnings. Similar transfers were made between additional paid-in capital and common stock in the amount of $79.8 million, reflecting the two-for-one stock split of June 26, 1997 to shareholders of record on June 11, 1997. All historical earnings per share amounts have been restated to reflect both two- for-one stock splits. Reference to common stock activity before the distribution of the related split has not been restated unless otherwise noted. All activity after the distribution date reflects the two-for-one stock splits. In April 1992, the Company issued 250,000 shares of Series A cumulative convertible preferred stock in a private offering. As of June 1996, pursuant to a call for redemption, the Series A preferred stock was converted into 1,190,475 shares of common stock. In August 1992, the Company issued 1,650,000 shares of Series C cumulative convertible preferred stock in a public offering. As of September 1996, pursuant to a call for redemption, the Series C preferred stock was converted into 3,177,844 shares of common stock. On November 17, 1995, the Company issued its Series D and Series E convertible preferred stock as part of the purchase price for Marshalls. The 250,000 shares of Series D preferred stock, with a face value of $25 million, carried an annual dividend rate of $1.81 per share and was automatically converted into 1,349,527 shares of common stock on November 17, 1996. The shares of Series E preferred stock, with 1,500,000 shares initially issued at a face value of $150 million, carried an annual dividend rate of $7.00 per share. During fiscal 1998, 770,200 shares of the Series E preferred stock were voluntarily converted into 8.3 million shares of common stock and 2,500 shares were repurchased. During fiscal 1999, 357,300 shares of Series E were voluntarily converted into 6.7 million shares of common stock. On November 18, 1998, the remaining 370,000 shares of the Series E preferred stock were mandatorily converted into 8.0 million shares of common stock in accordance with its terms. Inducement fees of $130,000 and $3.8 million were paid on the Series E voluntary conversions in fiscal 1999 and fiscal 1998, respectively. The Company recorded aggregate dividends, including inducement fees, on its preferred stock of $3.5 million in fiscal 1999, $11.7 million in fiscal 1998 and $13.7 million in fiscal 1997. The preferred dividends reduce net income in computing net income available to common shareholders. During fiscal 1997, the Company replaced the June 1995 shelf registration statement with another shelf registration statement which currently provides for the issuance of up to $600 million of debt, common stock or preferred stock. In June 1997, the Company announced a $250 million stock buyback program. During fiscal 1998, the Company repurchased 17.1 million shares of common stock (adjusted for stock splits) for a cost of 14
  • 14. $245.2 million. The program was completed in February 1998 at which time the Company announced a second $250 million stock repurchase program. In October 1998, the Company completed the second $250 million stock repurchase program and announced its intentions to repurchase an additional $750 million of common stock over the next several years. The Company has spent $95.5 million through January 30, 1999 on this current repurchase program. In total, during fiscal 1999, the Company repurchased a combined total of 15.6 million shares of common stock (adjusted for stock splits) at a total cost of $350.3 million. P e r S h a r e : The Company calculates earnings per share in accordance with SFAS No. 128 Earnings which requires the presentation of basic and diluted earnings per share. The following schedule presents the calculation of basic and diluted earnings per share for income from continuing operations: Fiscal Year Ended January 30, January 31, January 25, Dollars in Thousands Except Per Share Amounts 1999 1998 1997 (53 weeks) Basic earnings per share: Income from continuing operations before extraordinary item $433,202 $306,592 $213,826 Less: preferred stock dividends 3,523 11,668 13,741 Income from continuing operations before extraordinary item available to common shareholders $429,679 $294,924 $200,085 Weighted average common stock outstanding for basic earnings per share 318,073,081 321,474,046 300,926,904 Basic earnings per share $1.35 $.92 $.66 Diluted earnings per share: Income from continuing operations before extraordinary item available to common shareholders $429,679 $294,924 $200,085 Add back: preferred stock dividends 3,523 11,668 13,741 Income from continuing operations before extraordinary item for diluted earnings per share calculation $433,202 $306,592 $213,826 Weighted average common stock outstanding for basic earnings per share 318,073,081 321,474,046 300,926,904 Assumed conversion of: Convertible preferred stock 10,914,354 24,032,172 46,331,584 Stock options and awards 5,660,515 4,105,966 3,391,612 Weighted average common shares for diluted earnings per share calculation 334,647,950 349,612,184 350,650,100 Diluted earnings per share $1.29 $.88 $.61 G. Income Taxes The provision for income taxes includes the following: Fiscal Year Ended January 30, January 31, January 25, In Thousands 1999 1998 1997 (53 weeks) Current: Federal $231,811 $172,026 $116,848 State 45,117 39,200 27,160 Foreign 13,784 8,117 8,079 Deferred: Federal (13,084) (3,432) 33 State (2,306) (326) 462 Foreign (4,512) 94 (268) Provision for income taxes $270,810 $215,679 $152,314 15
  • 15. The Company had a net deferred tax (asset) liability as follows: January 30, January 31, In Thousands 1999 1998 Deferred tax assets: Foreign net operating loss carryforward $ 30,660 $ 34,554 Reserve for discontinued operations 12,074 6,723 Reserve for closed store and restructuring costs 19,767 23,571 Insurance costs not currently deductible for tax purposes 7,496 15,049 Pension, postretirement and employee benefits 48,556 34,173 Leases 13,379 9,350 Other 24,255 18,789 Valuation allowance (27,321) (34,603) Total deferred tax assets 128,866 107,606 Deferred tax liabilities: Property, plant and equipment 17,056 14,736 Safe harbor leases 31,738 37,945 Tradename 47,373 48,659 Other 10,313 13,125 Total deferred tax liabilities 106,480 114,465 Net deferred tax (asset) liability $ (22,386) $ 6,859 The Company has elected to repatriate the fiscal 1999 earnings of its Canadian subsidiary. During fiscal 1999 the majority of the earnings of its Canadian subsidiary were repatriated and deferred foreign tax credits have been provided for on the undistributed portion of fiscal 1999 earnings. Prior earnings of its Canadian subsidiary and all the earnings of the Company’s other foreign subsidiaries are indefinitely reinvested and no deferred taxes have been provided for on those earnings. The Company has a United Kingdom net operating loss carryforward of approximately $50 million for tax and financial reporting purposes. The United Kingdom net operating loss does not expire under current United Kingdom tax law. The Company also has a Puerto Rico net operating loss carryforward of approxi- mately $39 million at January 30, 1999, for tax and financial reporting purposes, which was acquired in the Marshalls acquisition and expires in fiscal 2000 through fiscal 2003. The Company has recognized in fiscal 1999 a $3.4 million Puerto Rico deferred tax asset for estimated future utilization of the Puerto Rico net oper- ating loss carryforward. Additional utilization of these net operating loss carryforwards is dependent upon future earnings of the Company’s foreign subsidiaries. The Company’s worldwide effective tax rate was 38% for the fiscal year ended January 30, 1999, 41% and 42% for fiscal years ended January 31, 1998 and January 25, 1997, respectively. The difference between the U.S. federal statutory income tax rate and the Company’s worldwide effective income tax rate is summarized as follows: Fiscal Year Ended January 30, January 31, January 25, 1999 1998 1997 U.S. federal statutory income tax rate 35% 35% 35% Effective state income tax rate 4 5 5 Impact of foreign operations (1) – 1 All other – 1 1 Worldwide effective income tax rate 38% 41% 42% H. Pension Plans and Other Retirement Benefits The Company has a non-contributory defined benefit retirement plan covering the majority of full-time U.S. employees. Effective in fiscal 1998, Marshalls associates are included in the plan with credit for service prior to the acquisition. Employees who have attained twenty-one years of age and have completed one year of service are covered under the plan. Benefits are based on compensation earned in each year of service. The Company also has an unfunded supplemental retirement plan which covers certain key employees of the Company and provides additional retirement benefits based on average compensation and an unfunded postretirement medical plan which provides limited postretirement medical and life insurance benefits to 16
  • 16. associates who participate in the Company’s retirement plan and who retire at age fifty-five or older with ten or more years of service. Presented below is certain financial information relating to the Company’s retirement plans for the fiscal years indicated: Pension Postretirement Medical January 30, January 31, January 30, January 31, Dollars in Thousands 1999 1998 1999 1998 Change in benefit obligation: Benefit obligation at beginning of year $127,148 $100,465 $21,172 $15,093 Service cost 10,538 8,372 1,405 1,133 Interest cost 9,647 8,398 1,610 1,649 Amendments – 750 – 2,702 Actuarial losses 11,027 15,299 1,712 1,456 Benefits paid (5,497) (5,283) (907) (860) Expenses paid (816) (853) – – Benefit obligation at end of year $152,047 $127,148 $24,992 $21,173 Change in plan assets: Fair value of plan assets at beginning of year $110,234 $89,554 $ – $ – Actual return on plan assets 8,164 22,494 – – Employer contribution 11,106 4,323 907 860 Benefits paid (5,497) (5,284) (907) (860) Expenses paid (816) (853) – – Fair value of plan assets at end of year $123,191 $110,234 $ – $ – Reconciliation of funded status: Benefit obligation at end of year $152,047 $127,148 $24,992 $21,173 Fair value of plan assets at end of year 123,191 110,234 – – Funded status – obligation in excess of assets 28,856 16,914 24,992 21,173 Unrecognized transition obligation 522 596 – – Unrecognized prior service cost 773 861 1,616 1,953 Unrecognized actuarial (gains) losses 4,909 (5,243) 3,997 2,388 Net accrued liability recognized $ 22,652 $ 20,700 $19,379 $16,832 Weighted average assumptions: Discount rate 6.63% 7.00% 6.75% 7.00% Expected return on plan assets 9.00% 9.00% N/A N/A Rate of compensation increase 4.00% 4.00% 4.00% 4.00% Components of net periodic benefit cost: Service cost $ 10,538 $ 8,372 $ 1,405 $ 1,366 Interest cost 9,647 8,398 1,610 1,649 Expected return on plan assets (9,991) (7,937) – – Amortization of transition obligation 75 75 – – Amortization of prior service cost 87 837 338 749 Recognized actuarial losses 2,702 206 103 – Net periodic benefit cost $ 13,058 $ 9,951 $ 3,456 $ 3,764 The net periodic benefit cost for the Company’s pension and postretirement medical plans for the fiscal year ended January 25, 1997, was $5.9 million and $1.8 million, respectively. The projected benefit obligation and accumulated benefit obligation of the Company’s unfunded supplemental retirement plan were $26.2 million and $20.1 million, respectively, as of January 30, 1999 and $19.7 million and $13.4 million, respec- tively, as of January 31, 1998. 17
  • 17. For measurement purposes of the postretirement medical plan, a 4% annual rate of increase in the per capita cost of covered health care benefits was assumed and is gradually reduced to zero. The impact of medical inflation eventually diminishes because of the $3,000 per capita annual limit on medical benefits. An increase in the assumed health care cost trend rate of one percentage point for all future years would increase the accumulated postretirement benefit obligation at January 30, 1999 by about $1.4 million, and the total of the service cost and interest cost components of net periodic postretirement cost for fiscal 1999, by about $180,000. Similarly, decreasing the trend rate by one percentage point for all future years would decrease the accumulated postretirement benefit obligation at January 30, 1999 by about $1.3 million as well as the total of the service cost and interest cost components of net periodic postretirement cost for fiscal 1999, by about $170,000. The Company also sponsors an employee savings plan under Section 401(k) of the Internal Revenue Code for all eligible U.S. employees, including Marshalls associates effective January 1, 1997. Employees may contribute up to 15% of eligible pay. The Company matches employee contributions up to 5% of eligible pay at rates ranging from 25% to 50% based upon Company performance. The Company contributed for all 401(k) plans $6.4 million in fiscal 1999, $5.7 million in fiscal 1998 and $6.4 million in fiscal 1997. Prior to January 1, 1997, Marshalls associates participated in a separate Section 401(k) savings plan consistent with the plan Marshalls associates participated in prior to acquisition. In addition to the plans described above, the Company also maintains retirement/deferred savings plans for all eligible associates at its foreign subsidiaries. The Company contributed for these plans $534,000, $440,000 and $294,000 in fiscal years 1999, 1998 and 1997, respectively. I. Accrued Expenses and Other Current Liabilities The major components of accrued expenses and other current liabilities are as follows: January 30, January 31, In Thousands 1999 1998 Employee compensation and benefits $173,630 $142,945 Reserve for discontinued operations 29,660 17,843 Store closing and restructuring reserve, continuing operations 44,598 57,966 Insurance 44,654 58,070 Rent, utilities, advertising and other 396,451 334,682 Accrued expenses and other current liabilities $688,993 $611,506 The Company’s reserve for discontinued operations relates to obligations the Company retained or incurred in connection with the sale of its former Zayre, Hit or Miss and Chadwick’s operations. During fiscal 1999, the Company increased the reserve by $15 million for additional lease related obligations, primarily in connection with its former Hit or Miss properties. The balance of the activity in the reserve for fiscal 1999, a reduction of $3.2 million, is primarily for lease related obligations of the former Zayre stores. During fiscal 1998, the reserve decreased by $5.8 million primarily due to settlement costs associated with Chadwick’s and for lease related costs associated with the former Zayre and Hit or Miss properties. The combined remaining reserve balance of $29.7 million as of January 30, 1999 is expected to be used for lease related obligations, primarily for former Zayre and Hit or Miss properties, which is expected to be paid out over the next ten to fifteen years, as leases are settled or terminated. The reserve for store closings and restructurings is primarily for costs associated with the disposition and settlement of leases for the T.J. Maxx and Marshalls closings anticipated as a result of the Marshalls acqui- sition. The initial reserves established in fiscal 1996 were estimated at $244.1 million for a Marshalls store closing and restructuring plan and $35 million for the closing of certain T.J. Maxx stores. The initial reserve established in the acquisition of Marshalls for the fiscal year-ended January 27, 1996, was estimated at $244.1 million and included $44.1 million for inventory markdowns and $200 million for a store closing and restructuring program. The initial store closing plan included the closing of 170 Marshalls stores during fiscal 1997 and fiscal 1998. The Company reduced the total reserve by $85.9 million in fiscal 1997 and by an additional $15.8 million in fiscal 1998, primarily due to fewer store closings and a reduction in the esti- mated cost of settling the related lease obligations. This reserve was a component of the allocation of the purchase price for Marshalls and the reserve adjustments in fiscal 1998 and 1997 resulted in a corresponding 18
  • 18. reduction in the value assigned to the long-term assets acquired. The adjusted reserve balance included $70.8 million for lease related obligations for 70 store and other facility closings, $9.6 million for property write-offs, $44.1 million for inventory markdowns and $17.9 million for severance, professional fees and all other costs associated with the restructuring plan. Property write-offs were the only non-cash charge to the reserve. In connection with the Marshalls acquisition, the Company also established a reserve for the closing of certain T.J. Maxx stores. The Company recorded an initial pre-tax charge to income from continuing opera- tions of $35 million in fiscal 1996 and a pre-tax credit to income from continuing operations of $1.8 million in fiscal 1999 and $8 million in fiscal 1997 to reflect a lower than anticipated cost of the T.J. Maxx closings. An additional charge to continuing operations of $700,000 was recorded in fiscal 1998. The adjusted reserve balance includes $13.8 million for lease related obligations of 32 store closings, non-cash charges of $9.8 million for property write-offs and $2.3 million for severance, professional fees and all other costs associated with the closings. The following is a summary of the activity in the store closing and restructuring reserve for the last two fiscal years: Fiscal Year Ended January 30, January 31, In Thousands 1999 1998 Balance, beginning of year $57,966 $ 95,867 Additions to the reserve 1,961 – Reserve adjustments: Adjust Marshalls restructuring reserve – (15,843) Adjust T.J. Maxx store closing reserve (1,800) 700 Charges against the reserve: Lease related obligations (12,521) (13,593) Severance and all other cash charges (927) (1,876) Net activity relating to HomeGoods closings (81) (1,887) Non-cash property write-offs – (5,402) Balance, end of year $44,598 $ 57,966 As of January 31, 1998, all the Marshalls and T.J. Maxx properties reserved for had been closed. The remain- ing reserve balance as of January 30, 1999 of $44.6 million is almost entirely for the estimated cost of future obligations of closed stores and other facility leases. It includes estimates and assumptions as to how the leases will be disposed of, and could change; however, the Company believes it has adequate reserves to deal with these obligations. The use of the reserve will reduce operating cash flows in varying amounts over the next ten to fifteen years as the related leases expire or are settled. J. Supplemental Cash Flows Information The Company classifies the cash flows associated with the operating results of its discontinued operations through the date of sale, as “net cash provided by discontinued operations.” The following is a reconciliation of the “income from discontinued operations, net of income taxes” to the “net cash provided by discontinued operations” for the fiscal years indicated. No cash flows from the operating results of the Company’s discontinued operations were received during the year ended January 30, 1999. Fiscal Year Ended January 31, January 25, In Thousands 1998 1997 (53 weeks) Income from discontinued operations, net of income taxes $ – $ 29,361 Decrease in net assets of discontinued operations during the period: Net assets of discontinued operations – beginning of period 54,451 128,586 Less: Net assets of discontinued operations – sold during period – 54,083 Net assets of discontinued operations – end of period – 54,451 Decrease in net assets of discontinued operations 54,451 20,052 Net cash provided by discontinued operations $54,451 $ 49,413 19
  • 19. The Company is also responsible for certain leases related to, and other obligations arising from, the sale of these operations, for which reserves have been provided in its reserve for discontinued operations, and is included in accrued expenses. The cash flow impact of these obligations is reflected as a component of cash provided by operating activities in the statements of cash flows. The Company’s cash payments for interest expense and income taxes, including discontinued operations, and its non-cash investing and financing activities are as follows: Fiscal Year Ended January 30, January 31, January 25, In Thousands 1999 1998 1997 (53 weeks) Cash paid for: Interest $ 22,542 $ 26,359 $ 44,288 Income taxes 275,538 199,025 159,245 Non-cash investing and financing activities: Conversion of cumulative convertible preferred stock into common stock Series A $ – $ – $ 25,000 Series C – – 82,500 Series D – – 25,000 Series E 72,730 77,020 – Distribution of two-for-one stock split 158,954 79,823 – Note receivable from sale of Chadwick’s of Boston – – 20,000 K. Discontinued Operations and Related Contingent Liabilities In October 1988, the Company completed the sale of its former Zayre Stores division to Ames Department Stores, Inc. (“Ames”). In April 1990, Ames filed for protection under Chapter 11 of the Federal Bankruptcy Code and in December 1992, Ames emerged from bankruptcy under a plan of reorganization. The Company remains contingently liable for the leases of most of the former Zayre stores still operated by Ames. The Company believes that the Company’s contingent liability on these leases will not have a material effect on the Company’s financial condition. The Company is also contingently liable on certain leases of its former warehouse club operations (BJ’s Wholesale Club and HomeBase), which was spun off by the Company in fiscal 1990 as Waban Inc. During fiscal 1998, Waban Inc. was renamed HomeBase, Inc. and spun-off from its BJ’s Wholesale Club division (BJ’s Wholesale Club, Inc.). HomeBase, Inc., and BJ’s Wholesale Club, Inc. are primarily liable on their respective leases and have indemnified the Company for any amounts the Company may have to pay with respect to such leases. In addition, HomeBase, Inc., BJ’s Wholesale Club, Inc. and the Company have entered into agreements under which BJ’s Wholesale Club, Inc. has substantial indemnification responsibility with respect to such HomeBase, Inc. leases. The Company is also contingently liable on certain leases of BJ’s Wholesale Club, Inc. for which both BJ’s Wholesale Club, Inc. and HomeBase, Inc. remain liable. The Company believes that its contingent liability on the HomeBase, Inc. and BJ’s Wholesale Club, Inc. leases will not have a material effect on the Company’s financial condition. The Company is also contingently liable on approximately 50 store leases and the office and warehouse leases of its former Hit or Miss division which was sold by the Company in September 1995. During the third quarter ended October 31, 1998, the Company increased its reserve for its discontinued operations by $15 million ($9 million after tax), primarily for potential lease liabilities relating to guarantees on leases of its former Hit or Miss division. The after tax cost of $9 million or, $.02 per diluted share, was recorded as a loss on disposal of discontinued operations. 20
  • 20. L. Segment Information During 1997, the Financial Accounting Standards Board issued Statement of Financial Accounting Standards (SFAS) No. 131, “Disclosure about Segments of an Enterprise and Related Information.” This new standard did not result in any changes to the Company’s reportable segments or in the information disclosed about its segments. The Company has two reportable segments. It’s off-price family apparel segment includes the T.J. Maxx, Marshalls and A.J. Wright domestic store chains and the Company’s foreign store chains, Winners and T.K. Maxx. The Company manages the results of its T.J. Maxx and Marshalls chains on a combined basis. The other chains, whose operating results are managed separately, sell similar product categories and share simi- lar economic and other characteristics of the T.J. Maxx and Marshalls operations and are aggregated with the off-price family apparel segment. This segment generated 7.8% of its fiscal 1999 revenue from its foreign operations. All of these stores offer apparel for the entire family with limited offerings of domestic goods. The Company’s other segment, the off-price home fashions stores is made up of the Company’s HomeGoods stores which offer a wide variety of home furnishings. The Company evaluates the performance of its segments based on pre-tax income before interest and general corporate expenses. For data on business segments for fiscal years 1999, 1998 and 1997, see page 22. 21
  • 21. The TJX Companies, Inc. REPORT OF INDEPENDENT ACCOUNTANTS To the Board of Directors of The TJX Companies, Inc.: In our opinion, the accompanying consolidated balance sheets and the related consolidated statements of income, stockholders’ equity and cash flows present fairly, in all material respects, the financial position of The TJX Companies, Inc. and subsidiaries (the “Company”) at January 30, 1999 and January 31, 1998, and the results of its operations and its cash flows for each of the three years in the period ended January 30, 1999, in conformity with generally accepted accounting principles. These financial statements are the responsibility of the Company’s management; our responsibility is to express an opinion on these financial statements based on our audits. We conducted our audits of these statements in accordance with generally accepted auditing standards which require that we plan and perform the audit to obtain reasonable assurance about whether the financial statements are free of material misstatement. An audit includes examining, on a test basis, evidence supporting the amounts and disclosures in the financial statements, assessing the account- ing principles used and significant estimates made by management, and evaluating the overall financial statement presentation. We believe that our audits provide a reasonable basis for the opinion expressed above. Boston, Massachusetts March 2, 1999 REPORT OF MANAGEMENT The financial statements and related financial information in this annual report have been prepared by management which is responsible for their integrity, objectivity and consistency. The financial statements were prepared in accordance with generally accepted accounting principles and necessarily include amounts which are based upon judgments and estimates made by management. The Company maintains a system of internal controls designed to provide, at appropriate cost, reason- able assurance that assets are safeguarded, transactions are executed in accordance with management’s authorization and the accounting records may be relied upon for the preparation of financial statements. The system of controls includes the careful selection and training of associates, and the communication and application of formal policies and procedures that are consistent with high standards of accounting and administrative practices. The accounting and control systems are continually reviewed, evaluated and where appropriate, modified to accommodate changing business conditions and the recommendations of the Company’s internal auditors and the independent public accountants. An Audit Committee, comprised of members of the Board of Directors who are neither officers nor employees of the Company, meets periodically with management, internal auditors and the independent public accountants to review matters relating to the Company’s financial reporting, the adequacy of internal accounting controls and the scope and results of audit work. The Committee is responsible for reporting the results of its activities and for recommending the selection of independent auditors to the full Board of Directors. The internal auditors and the independent public accountants have free access to the Committee and the Board of Directors. The financial statements have been examined by PricewaterhouseCoopers LLP, whose report appears separately. Their report expresses an opinion as to the fair presentation of the consolidated financial statements and is based on an independent examination performed in accordance with generally accepted auditing standards. Bernard Cammarata Donald G. Campbell President and Chief Executive Officer Executive Vice President – Finance and Chief Financial Officer March 2, 1999 22
  • 22. The TJX Companies, Inc. SELECTED FINANCIAL DATA (CONTINUING OPERATIONS) The following selected financial data includes the results of Marshalls for the periods following its acquisi- tion on November 17, 1995. All prior year data has been restated to reflect Chadwick’s and Hit or Miss as discontinued operations. Fiscal Year Ended January Dollars in Thousands Except Per Share Amounts 1999 1998 1997 1996 1995 (53 Weeks) Income statement and per share data: Net sales $7,949,101 $7,389,069 $6,689,410 $3,975,115 $3,055,573 Income from continuing operations before 51,589(1) extraordinary item 433,202 306,592 213,826 84,480 Weighted average common shares for diluted earnings per share computations 334,647,950 349,612,184 350,650,100 290,781,900 293,837,800 Diluted earnings per share from continuing operations .15(1) $ before extraordinary item $ 1.29 $ .88 $ .61 $ .26 Dividends per share .12 .10 .07 .12 .14 Balance sheet data: Working capital $ 436,259 $ 464,974 $ 425,595 $ 332,864 $ 240,646 Total assets 2,747,846 2,609,632 2,506,761 2,545,825 1,373,964 Capital expenditures 207,742 192,382 119,153 105,864 109,436 Long-term debt 220,344 221,024 244,410 690,713 194,478 Shareholders’ equity 1,220,656 1,164,092 1,127,186 764,634 606,952 Stores in operation at year-end: T.J. Maxx 604 580 578 587 551 Marshalls 475 461 454 496 – Winners 87 76 65 52 37 HomeGoods 35 23 21 22 15 T.K. Maxx 39 31 18 9 5 A.J. Wright 6 – – – – (1) Includes an after-tax charge of $21.0 million, or $.07 per share, for the estimated cost of closing certain T.J. Maxx stores in connection with the acquisition of Marshalls. PRICE RANGE OF COMMON STOCK The following per share data reflects the two-for-one stock splits distributed in June 1998 and June 1997. The common stock of the Company is listed on the New York Stock Exchange (Symbol: TJX). The quarterly high and low trading stock prices for fiscal 1999 and fiscal 1998 are as follows: Fiscal 1999 Fiscal 1998 Quarter High Low High Low 3 3 1 9 First $23. ⁄4 $17. ⁄16 $12. ⁄32 $ 9. ⁄16 7 3 31 1 Second 28. ⁄16 22. ⁄16 14. ⁄32 11. ⁄4 1 7 1 Third 28. 15. ⁄2 16. ⁄16 13. ⁄8 1 3 9 Fourth 31. ⁄16 18. ⁄4 19. ⁄32 13. The approximate number of common shareholders at January 30, 1999 was 47,300. The Company declared four quarterly dividends of $.03 per share for fiscal 1999 and $.025 per share for fiscal 1998. 23