
Recomendados
Recomendados
Mais conteúdo relacionado
Mais procurados
Mais procurados (18)
Destaque
Destaque (7)
Semelhante a u.s.bancorp2Q 2003 Earnings Release and Supplemental Analyst Schedules
Semelhante a u.s.bancorp2Q 2003 Earnings Release and Supplemental Analyst Schedules (20)
Mais de finance13
Mais de finance13 (20)
Último
Último (20)
u.s.bancorp2Q 2003 Earnings Release and Supplemental Analyst Schedules
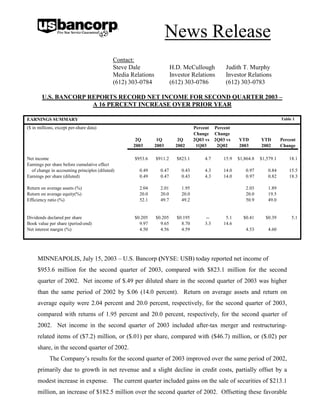
- 1. News Release Contact: Steve Dale H.D. McCullough Judith T. Murphy Media Relations Investor Relations Investor Relations (612) 303-0784 (612) 303-0786 (612) 303-0783 U.S. BANCORP REPORTS RECORD NET INCOME FOR SECOND QUARTER 2003 – A 16 PERCENT INCREASE OVER PRIOR YEAR Table 1 EARNINGS SUMMARY ($ in millions, except per-share data) Percent Percent Change Change 2Q 1Q 2Q 2Q03 vs 2Q03 vs YTD YTD Percent 2003 2003 2002 1Q03 2Q02 2003 2002 Change Net income $953.6 $911.2 $823.1 4.7 15.9 $1,864.8 $1,579.1 18.1 Earnings per share before cumulative effect of change in accounting principles (diluted) 0.49 0.47 0.43 4.3 14.0 0.97 0.84 15.5 Earnings per share (diluted) 0.49 0.47 0.43 4.3 14.0 0.97 0.82 18.3 Return on average assets (%) 2.04 2.01 1.95 2.03 1.89 Return on average equity(%) 20.0 20.0 20.0 20.0 19.5 Efficiency ratio (%) 52.1 49.7 49.2 50.9 49.0 Dividends declared per share $0.205 $0.205 $0.195 -- 5.1 $0.41 $0.39 5.1 Book value per share (period-end) 9.97 9.65 8.70 3.3 14.6 Net interest margin (%) 4.50 4.56 4.59 4.53 4.60 MINNEAPOLIS, July 15, 2003 – U.S. Bancorp (NYSE: USB) today reported net income of $953.6 million for the second quarter of 2003, compared with $823.1 million for the second quarter of 2002. Net income of $.49 per diluted share in the second quarter of 2003 was higher than the same period of 2002 by $.06 (14.0 percent). Return on average assets and return on average equity were 2.04 percent and 20.0 percent, respectively, for the second quarter of 2003, compared with returns of 1.95 percent and 20.0 percent, respectively, for the second quarter of 2002. Net income in the second quarter of 2003 included after-tax merger and restructuring- related items of ($7.2) million, or ($.01) per share, compared with ($46.7) million, or ($.02) per share, in the second quarter of 2002. The Company’s results for the second quarter of 2003 improved over the same period of 2002, primarily due to growth in net revenue and a slight decline in credit costs, partially offset by a modest increase in expense. The current quarter included gains on the sale of securities of $213.1 million, an increase of $182.5 million over the second quarter of 2002. Offsetting these favorable
- 2. U.S. Bancorp Reports Second Quarter 2003 Results July 15, 2003 Page 2 gains was the recognition of $196.3 million of mortgage servicing rights (“MSR”) impairment, driven by lower interest rates and related prepayments. U.S. Bancorp Chairman, President and Chief Executive Officer Jerry A. Grundhofer said, “Our second quarter results bring us one step closer to reaching our financial objectives for 2003. Our businesses produced solid revenue growth over the prior quarter, while maintaining control of their operating expenses. Our credit quality, although not at the level we want it to be, improved over the prior quarter, and we expect that improvement to continue. Without the distraction of a major integration during the past six months, our management team has been free to focus on our business strategies, markets and customers. We have identified tremendous growth opportunities through the cross-selling of our products and services to our own customer base. We announced several changes to our business unit reporting structures in the middle market commercial lending, transaction services and corporate payment services businesses in June. These changes position our Company to recognize and capitalize on opportunities to better serve and deliver products and services to those valuable customer segments. I am also very pleased with the new account growth and customer retention our branches have experienced over the past six months. We continue to emphasize our Five Star Service Guarantee throughout the franchise, and this new account growth and retention is an indicator that providing superior products and services and delivering them in a superior way is what differentiates us from our competition. Service is our brand. I am very proud of what we have accomplished and am excited to see the potential of our Company unfold in 2003 and beyond.” Total net revenue on a taxable-equivalent basis for the second quarter of 2003 grew by $338.3 million (10.8 percent) over the second quarter of 2002. This growth was primarily due to increases in net interest income, payment services revenue, mortgage banking activities, growth in consumer banking, gains on the sale of securities, and acquisitions. Approximately $44.8 million of the increase in net revenue year-over-year was due to acquisitions, including the 57 branches of Bay View Bank in California and the corporate trust business of State Street Bank and Trust Company (“State Street Corporate Trust”). Total noninterest expense in the second quarter of 2003 was higher than the second quarter of 2002 by $169.6 million (11.1 percent), primarily reflecting the $182.0 million increase in MSR impairment. Since the end of the first quarter of 2003, the yield on 10-year Treasury Notes declined 69 basis points to 3.11 percent by mid-June before recovering 41 basis points to end the (MORE)
- 3. U.S. Bancorp Reports Second Quarter 2003 Results July 15, 2003 Page 3 month at a rate of 3.52 percent. The yield on 30-year financial instruments declined 39 basis points during the same timeframe. Driven by the decline in longer-term interest rates, the mortgage industry experienced an increase in refinancing activities, resulting in higher prepayments. Also contributing to the increase in expense in the second quarter of 2003 were acquisitions, which accounted for approximately $27.6 million of expense growth year-over-year. Partially offsetting these increases in expense over the second quarter of 2002 were a reduction in merger and restructuring-related charges of $60.8 million and cost savings related to the recently completed integration efforts. Provision for credit losses for the second quarter of 2003 was $323.0 million, a decrease of $12.0 million from the second quarter of 2002. Net charge-offs in the second quarter of 2003 were $322.9 million, compared with the first quarter of 2003 net charge-offs of $333.8 million and second quarter of 2002 net charge-offs of $330.5 million. Net charge-offs in the second quarter of 2003 reflected continuing weakness in the communications, transportation and manufacturing sectors, as well as the impact of the economy on highly leveraged enterprise value financings. Total nonperforming assets declined slightly from $1,362.6 million at March 31, 2003, to $1,359.7 million at June 30, 2003. The ratio of allowance for credit losses to nonperforming loans was 194 percent at June 30, 2003, compared with 194 percent at March 31, 2003, and 241 percent at June 30, 2002. During the second quarter of 2003, the Company’s effective tax rate declined to 34.0 percent, compared with the effective tax rate of 34.4 percent in the first quarter of 2003 and 34.8 percent a year ago. The improvement in the effective tax rate primarily reflected a change in unitary state tax apportionment factors driven by a shift in business mix as a result of the impact of acquisitions, market demographics and the mix of product revenue. During the first quarter of 2003, the Company announced that its Board of Directors approved a plan to effect a spin-off of its capital markets business unit, including the investment banking and brokerage activities primarily conducted by its wholly-owned subsidiary, U.S. Bancorp Piper Jaffray Inc. On June 25, 2003, U.S. Bancorp Piper Jaffray Inc. announced the filing of a Form 10 registration statement with the Securities and Exchange Commission to register shares of Piper Jaffray Companies, the new holding company for the Piper Jaffray businesses. It is anticipated that the transaction will be completed by the end of 2003. (MORE)
- 4. U.S. Bancorp Reports Second Quarter 2003 Results July 15, 2003 Page 4 Table 2 INCOME STATEMENT HIGHLIGHTS (Taxable-equivalent basis, $ in millions, Percent Percent except per-share data) Change Change 2Q 1Q 2Q 2Q03 vs 2Q03 vs YTD YTD Percent 2003 2003 2002 1Q03 2Q02 2003 2002 Change Net interest income $1,805.9 $1,783.8 $1,689.8 1.2 6.9 $3,589.7 $3,360.2 6.8 Noninterest income 1,666.0 1,522.9 1,443.8 9.4 15.4 3,188.9 2,776.8 14.8 Total net revenue 3,471.9 3,306.7 3,133.6 5.0 10.8 6,778.6 6,137.0 10.5 Noninterest expense 1,696.5 1,574.1 1,526.9 7.8 11.1 3,270.6 2,969.8 10.1 Provision for credit losses 323.0 335.0 335.0 (3.6) (3.6) 658.0 670.0 (1.8) Income before income taxes and cumulative effect of change in accounting principles 1,452.4 1,397.6 1,271.7 3.9 14.2 2,850.0 2,497.2 14.1 Taxable-equivalent adjustment 7.6 8.3 9.0 (8.4) (15.6) 15.9 18.1 (12.2) Applicable income taxes 491.2 478.1 439.6 2.7 11.7 969.3 862.8 12.3 Income before cumulative effect of change in accounting principles 953.6 911.2 823.1 4.7 15.9 1,864.8 1,616.3 15.4 Cumulative effect of change in accounting principles (after-tax) -- -- -- -- -- -- (37.2) nm Net income $953.6 $911.2 $823.1 4.7 15.9 $1,864.8 $1,579.1 18.1 Diluted earnings per share: Income before cumulative effect of change in accounting principles $0.49 $0.47 $0.43 4.3 14.0 $0.97 $0.84 15.5 Cumulative effect of change in accounting principles -- -- -- -- -- -- (0.02) nm Net income $0.49 $0.47 $0.43 4.3 14.0 $0.97 $0.82 18.3 Net Interest Income Second quarter net interest income on a taxable-equivalent basis was $1,805.9 million, compared with $1,689.8 million recorded in the second quarter of 2002. Average earning assets for the period increased over the second quarter of 2002 by $13.2 billion (9.0 percent), primarily driven by increases in investment securities, residential mortgages, retail loans and loans held for sale, partially offset by a decline in commercial loans. The net interest margin in the second quarter of 2003 was 4.50 percent, compared with 4.56 percent in the first quarter of 2003 and 4.59 percent in the second quarter of 2002. The decline in the net interest margin in the second quarter of 2003 from the second quarter of 2002 primarily reflected the growth in lower-yielding investment securities as a percent of total earning assets, a change in loan mix and a decline in the margin benefit from net free funds due to lower rates. The decline in the net interest margin in the (MORE)
- 5. U.S. Bancorp Reports Second Quarter 2003 Results July 15, 2003 Page 5 second quarter of 2003 from the first quarter of 2003 also reflected a similar change in earning asset mix driven, in part, by the downward shift in longer-term interest rates. The Company expects the net interest margin to decline in the third quarter of 2003 as cashflows generated by the business lines are re-deployed to purchase lower-yielding investment securities in the absence of material commercial loan demand. Despite the decline in the net interest margin, net interest income on a taxable-equivalent basis in the second quarter of 2003 was higher than the first quarter of 2003, by $22.1 million (1.2 percent), primarily due to a $3.1 billion increase in average earning assets, driven by growth in investment securities and residential mortgages, in addition to loan prepayment fees. NET INTEREST INCOME Table 3 (Taxable-equivalent basis; $ in millions) Change Change 2Q 1Q 2Q 2Q03 vs 2Q03 vs YTD YTD 2003 2003 2002 1Q03 2Q02 2003 2002 Change Components of net interest income Income on earning assets $2,347.2 $2,351.0 $2,384.6 $ (3.8) $ (37.4) $4,698.2 $4,756.3 $ (58.1) Expense on interest-bearing liabilities 541.3 567.2 694.8 (25.9) (153.5) 1,108.5 1,396.1 (287.6) Net interest income $1,805.9 $1,783.8 $1,689.8 $ 22.1 $ 116.1 $3,589.7 $3,360.2 $ 229.5 Average yields and rates paid Earning assets yield 5.85 % 6.02 % 6.47 % (0.17) % (0.62) % 5.93 % 6.52 % (0.59) % Rate paid on interest-bearing liabilities 1.69 1.83 2.32 (0.14) (0.63) 1.76 2.36 (0.60) Gross interest margin 4.16 % 4.19 % 4.15 % (0.03) % 0.01 % 4.17 % 4.16 % 0.01 % Net interest margin 4.50 % 4.56 % 4.59 % (0.06) % (0.09) % 4.53 % 4.60 % (0.07) % Average balances Investment securities $36,142 $34,220 $28,016 $1,922 $8,126 $35,187 $27,325 $7,862 Loans 117,803 116,312 114,017 1,491 3,786 117,062 113,866 3,196 Earning assets 160,859 157,751 147,641 3,108 13,218 159,314 146,797 12,517 Interest-bearing liabilities 128,664 125,746 119,851 2,918 8,813 127,213 119,119 8,094 Net free funds* 32,195 32,005 27,790 190 4,405 32,101 27,678 4,423 * Represents noninterest-bearing deposits, allowance for credit losses, unrealized gain (loss) on available-for-sale securities, non-earning assets, other non-interest bearing liabilities and equity (MORE)
- 6. U.S. Bancorp Reports Second Quarter 2003 Results July 15, 2003 Page 6 Table 4 AVERAGE LOANS ($ in millions) Percent Percent Change Change 2Q 1Q 2Q 2Q03 vs 2Q03 vs YTD YTD Percent 2003 2003 2002 1Q03 2Q02 2003 2002 Change Commercial $36,581 $36,340 $38,826 0.7 (5.8) $36,461 $39,232 (7.1) Lease financing 5,121 5,251 5,601 (2.5) (8.6) 5,186 5,670 (8.5) Total commercial 41,702 41,591 44,427 0.3 (6.1) 41,647 44,902 (7.2) Commercial mortgages 20,105 20,241 18,783 (0.7) 7.0 20,173 18,732 7.7 Construction and development 6,984 6,542 6,446 6.8 8.3 6,764 6,475 4.5 Total commercial real estate 27,089 26,783 25,229 1.1 7.4 26,937 25,207 6.9 Residential mortgages 11,012 10,124 8,194 8.8 34.4 10,570 8,078 30.8 Credit card 5,388 5,389 5,627 -- (4.2) 5,389 5,633 (4.3) Retail leasing 5,762 5,750 5,337 0.2 8.0 5,756 5,190 10.9 Home equity and second mortgages 13,316 13,470 13,144 (1.1) 1.3 13,392 12,830 4.4 Other retail 13,534 13,205 12,059 2.5 12.2 13,371 12,026 11.2 Total retail 38,000 37,814 36,167 0.5 5.1 37,908 35,679 6.2 Total loans $117,803 $116,312 $114,017 1.3 3.3 $117,062 $113,866 2.8 Average loans for the second quarter of 2003 were $3.8 billion (3.3 percent) higher than the second quarter of 2002. Growth in average retail loans of $1.8 billion (5.1 percent) and residential mortgages of $2.8 billion (34.4 percent) year-over-year was partially offset by an overall decline in commercial and commercial real estate loans of $865 million (1.2 percent), driven by the current credit market and soft economic conditions through early 2003. Included in the change in the average of both commercial and commercial real estate loans outstanding in the second quarter of 2003 from the second quarter of 2002 was a reclassification of approximately $1.1 billion of commercial loans to other loan categories, including the commercial real estate category ($.8 billion) and residential mortgages ($.3 billion), in connection with conforming loan classifications at the time of system conversions completed primarily during the third quarter of 2002. Prior quarters were not restated, as it was impractical to determine the extent of reclassification for all (MORE)
- 7. U.S. Bancorp Reports Second Quarter 2003 Results July 15, 2003 Page 7 periods presented. Average loans for the second quarter of 2003 were higher than the first quarter of 2003 by $1.5 billion (1.3 percent), reflecting growth in residential mortgages and commercial loans. The impact of loan reclassifications relative to the first quarter was not significant. Average investment securities in the second quarter of 2003 were $8.1 billion (29.0 percent) higher than the second quarter of 2002, reflecting reinvestment of proceeds from loan sales, declines in commercial loan balances and deposits assumed in connection with the Bay View Bank branch acquisition. Investment securities at June 30, 2003, were $4.9 billion higher than at June 30, 2002, and $5.1 billion higher than the balance at March 31, 2003. During the second quarter of 2003, the Company sold $6.2 billion of fixed-rate securities. Table 5 AVERAGE DEPOSITS ($ in millions) Percent Percent Change Change 2Q 1Q 2Q 2Q03 vs 2Q03 vs YTD YTD Percent 2003 2003 2002 1Q03 2Q02 2003 2002 Change Noninterest-bearing deposits $32,515 $32,824 $27,267 (0.9) 19.2 $32,669 $27,375 19.3 Interest-bearing deposits Interest checking 18,090 17,536 15,318 3.2 18.1 17,814 15,236 16.9 Money market accounts 31,134 28,683 24,384 8.5 27.7 29,915 24,589 21.7 Savings accounts 5,614 5,272 4,957 6.5 13.3 5,444 4,866 11.9 Savings products 54,838 51,491 44,659 6.5 22.8 53,173 44,691 19.0 Time certificates of deposit less than $100,000 15,790 17,218 19,653 (8.3) (19.7) 16,500 20,056 (17.7) Time deposits greater than $100,000 13,008 14,282 10,871 (8.9) 19.7 13,642 10,110 34.9 Total interest-bearing deposits 83,636 82,991 75,183 0.8 11.2 83,315 74,857 11.3 Total deposits $116,151 $115,815 $102,450 0.3 13.4 $115,984 $102,232 13.5 Average noninterest-bearing deposits in the second quarter of 2003 were higher than the second quarter of 2002 by $5.2 billion (19.2 percent), primarily due to higher business and government banking demand deposit balances. Average interest-bearing deposits increased by $8.5 billion (11.2 percent) over the second quarter of 2002. Approximately $3.7 billion of the increase in average interest-bearing deposits was due to acquisitions, while the remaining $4.8 billion of growth was driven by increases in savings products balances and the Company’s funding decision to increase time deposits greater than $100,000. (MORE)
- 8. U.S. Bancorp Reports Second Quarter 2003 Results July 15, 2003 Page 8 Total deposits in the second quarter of 2003 were $336 million (.3 percent) higher on average than the first quarter of 2003. Noninterest-bearing deposits at June 30, 2003, were $10.0 billion higher than at March 31, 2003, and $13.2 billion higher than at June 30, 2002. The majority of the increase was due to the timing of seasonal corporate trust and government deposits. Due to the short duration of these deposits, the impact on the average balance of noninterest-bearing deposits in the second quarter of 2003 was not material and is not expected to significantly increase average deposits in the third quarter of 2003. These short-term deposits also contributed to the $12.7 billion increase in total assets from March 31, 2003, to June 30, 2003, as the funds were invested in short-term money market investments. The Company expects total assets at September 30, 2003, to decline from $194.9 billion at June 30, 2003. (MORE)
- 9. U.S. Bancorp Reports Second Quarter 2003 Results July 15, 2003 Page 9 Table 6 NONINTEREST INCOME ($ in millions) Percent Percent Change Change 2Q 1Q 2Q 2Q03 vs 2Q03 vs YTD YTD Percent 2003 2003 2002 1Q03 2Q02 2003 2002 Change Credit and debit card revenue $142.3 $127.4 $131.2 11.7 8.5 $269.7 $240.5 12.1 Corporate payment products revenue 90.9 86.0 82.5 5.7 10.2 176.9 157.7 12.2 ATM processing services 36.0 36.9 33.5 (2.4) 7.5 72.9 64.4 13.2 Merchant processing services 141.8 127.3 144.4 11.4 (1.8) 269.1 278.0 (3.2) Trust and investment management fees 241.9 230.3 234.9 5.0 3.0 472.2 459.2 2.8 Deposit service charges 184.9 168.7 173.3 9.6 6.7 353.6 329.0 7.5 Cash management fees 111.8 112.0 104.3 (0.2) 7.2 223.8 208.5 7.3 Commercial products revenue 100.0 104.2 123.7 (4.0) (19.2) 204.2 245.9 (17.0) Mortgage banking revenue 90.3 95.4 78.0 (5.3) 15.8 185.7 130.0 42.8 Trading account profits and commissions 67.6 60.9 49.5 11.0 36.6 128.5 99.4 29.3 Investment products fees and commissions 109.2 100.3 107.4 8.9 1.7 209.5 218.5 (4.1) Investment banking revenue 56.8 37.6 70.5 51.1 (19.4) 94.4 123.7 (23.7) Securities gains, net 213.1 140.7 30.6 51.5 nm 353.8 74.7 nm Other 79.4 95.2 80.0 (16.6) (0.8) 174.6 147.3 18.5 Total noninterest income $1,666.0 $1,522.9 $1,443.8 9.4 15.4 $3,188.9 $2,776.8 14.8 Noninterest Income Second quarter noninterest income was $1,666.0 million, an increase of $222.2 million (15.4 percent) over the same quarter of 2002, and a $143.1 million (9.4 percent) increase from the first quarter of 2003. The growth in noninterest income over the second quarter of 2002 was driven by payment services, deposit service charges, mortgage banking activity, net securities gains, and acquisitions, including the branches of Bay View Bank, and State Street Corporate Trust, which contributed approximately $26.0 million in noninterest income in the second quarter of 2003. Credit and debit card revenue, corporate payment products revenue and ATM processing services revenue in the Payment Services line of business were higher in the second quarter of 2003 than the second quarter of 2002 by $22.0 million (8.9 percent), primarily reflecting growth in sales and card usage. Merchant processing services revenue was lower by $2.6 million (1.8 percent) year- over-year, primarily due to lower processing spreads resulting from changes in the mix of merchants. The favorable variance in trust and investment management fees of $7.0 million (3.0 percent) in the second quarter of 2003 over the same period of 2002 was driven by the acquisition of State Street Corporate Trust, which contributed $21.1 million in fees during the second quarter (MORE)
- 10. U.S. Bancorp Reports Second Quarter 2003 Results July 15, 2003 Page 10 of 2003, partially offset by the impact of a decline in equity valuations. Deposit service charges increased by $11.6 million (6.7 percent) over the second quarter of 2002, primarily due to volume and fee enhancements within the Consumer Banking line of business. Cash management fees grew by $7.5 million (7.2 percent) in the second quarter of 2003 over the same period of 2002, with the majority of the change within the Wholesale Banking line of business. The increase in cash management fees over the second quarter of 2002 was driven by growth in sales, product enhancements and lower earning credit rates to customers. Mortgage banking revenue in the Consumer Banking line of business increased by $12.3 million (15.8 percent) in the second quarter of 2003 over the second quarter of 2002 due to higher mortgage originations and servicing and secondary market sales. Offsetting these favorable variances was a decline in commercial products revenue of $23.7 million (19.2 percent). The decline in commercial products revenue reflected lower fees related to the loan conduit. Investment products fees and commissions grew by $1.8 million in the second quarter of 2003 over the second quarter of 2002. Although the Capital Markets group’s fees declined year-over-year, the overall increase in investment products fees and commissions was due to the $7.2 million year-over-year increase within the Consumer Banking line of business, reflecting the expansion of investment product sales programs throughout the branch network. Noninterest income increased in the second quarter of 2003 by $143.1 million (9.4 percent) over the first quarter of 2003, primarily due to higher credit and debit card revenue, merchant processing services revenue, trust and investment management fees and deposit service charges, as well as higher capital markets related revenue and net securities gains. Offsetting these positive variances were declines in commercial products revenue, mortgage banking revenue and other income. The unfavorable variance in commercial products revenue was the result of a decline in loan conduit revenues. Mortgage banking revenue in the current quarter declined from the previous quarter due to a reduction in gains on loan sales. Other fees were lower relative to the first quarter, principally due to a decline in earnings from equity investments. (MORE)
- 11. U.S. Bancorp Reports Second Quarter 2003 Results July 15, 2003 Page 11 Table 7 NONINTEREST EXPENSE ($ in millions) Percent Percent Change Change 2Q 1Q 2Q 2Q03 vs 2Q03 vs YTD YTD Percent 2003 2003 2002 1Q03 2Q02 2003 2002 Change Salaries $625.3 $601.8 $607.6 3.9 2.9 $1,227.1 $1,195.9 2.6 Employee benefits 95.0 109.2 91.1 (13.0) 4.3 204.2 187.5 8.9 Net occupancy 101.1 102.2 101.8 (1.1) (0.7) 203.3 201.9 0.7 Furniture and equipment 72.0 73.4 77.0 (1.9) (6.5) 145.4 153.9 (5.5) Capitalized software 38.2 37.3 37.7 2.4 1.3 75.5 76.1 (0.8) Communication 50.5 51.2 44.1 (1.4) 14.5 101.7 89.8 13.3 Postage 45.9 45.4 44.4 1.1 3.4 91.3 91.0 0.3 Other intangible assets 312.3 235.1 104.7 32.8 nm 547.4 184.9 nm Merger and restructuring-related charges 10.8 17.6 71.6 (38.6) (84.9) 28.4 145.8 (80.5) Other 345.4 300.9 346.9 14.8 (0.4) 646.3 643.0 0.5 Total noninterest expense $1,696.5 $1,574.1 $1,526.9 7.8 11.1 $3,270.6 $2,969.8 10.1 Noninterest Expense Second quarter noninterest expense totaled $1,696.5 million, an increase of $169.6 million (11.1 percent) over the second quarter of 2002. The increase in expense year-over-year was primarily due to an increase in MSR impairment of $182.0 million and the impact of recent acquisitions, including the branches of Bay View Bank and State Street Corporate Trust, which accounted for approximately $27.6 million of the increase. The unfavorable variance year-over- year also included approximately $12.5 million of incremental pension and retirement expense, primarily the result of changes in pension assumptions, including a lower long-term rate of return on pension plan assets. Partially offsetting these increases were a $60.8 million reduction in merger and restructuring-related charges and cost savings from the recently completed integration efforts. Noninterest expense in the second quarter of 2003 was higher than the first quarter of 2003 by $122.4 million (7.8 percent). The unfavorable variance was primarily due to an increase in MSR impairment of $75.4 million (62.4 percent) and a $44.5 million increase in other expense, which included increases in marketing and public relations, legal and professional services, travel and entertainment, and litigation. (MORE)
- 12. U.S. Bancorp Reports Second Quarter 2003 Results July 15, 2003 Page 12 Table 8 ALLOWANCE FOR CREDIT LOSSES ($ in millions) 2Q 1Q 4Q 3Q 2Q 2003 2003 2002 2002 2002 Balance, beginning of period $2,408.5 $2,422.0 $2,460.5 $2,466.4 $2,461.5 Net charge-offs Commercial 122.9 137.9 136.7 124.0 110.6 Lease financing 26.9 23.0 58.2 23.4 35.2 Total commercial 149.8 160.9 194.9 147.4 145.8 Commercial mortgages 9.3 2.9 13.5 3.5 6.0 Construction and development 2.5 1.0 (0.9) 6.0 0.4 Total commercial real estate 11.8 3.9 12.6 9.5 6.4 Residential mortgages 6.5 5.9 6.6 5.9 3.9 Credit card 64.5 68.7 69.1 70.8 73.4 Retail leasing 12.6 13.9 10.7 9.4 8.3 Home equity and second mortgages 23.9 25.4 24.4 21.5 25.3 Other retail 53.8 55.1 60.2 64.5 67.4 Total retail 154.8 163.1 164.4 166.2 174.4 Total net charge-offs 322.9 333.8 378.5 329.0 330.5 Provision for credit losses 323.0 335.0 349.0 330.0 335.0 Acquisitions and other changes (41.0) (14.7) (9.0) (6.9) 0.4 Balance, end of period $2,367.6 $2,408.5 $2,422.0 $2,460.5 $2,466.4 Net charge-offs to average loans (%) 1.10 1.16 1.30 1.14 1.16 Allowance as a percentage of: Period-end loans 1.98 2.06 2.08 2.12 2.15 Nonperforming loans 194 194 196 204 241 Nonperforming assets 174 177 176 183 215 Credit Quality The allowance for credit losses was $2,367.6 million at June 30, 2003, compared with the allowance for credit losses of $2,408.5 million at March 31, 2003. The ratio of allowance for credit losses to nonperforming loans was 194 percent at June 30, 2003, equal to the ratio at March 31, 2003. The ratio of allowance for credit losses to period-end loans was 1.98 percent at June 30, 2003, compared with 2.06 percent at March 31, 2003. Total net charge-offs in the second quarter (MORE)
- 13. U.S. Bancorp Reports Second Quarter 2003 Results July 15, 2003 Page 13 of 2003 were $322.9 million, compared with the first quarter of 2003 net charge-offs of $333.8 million and the second quarter of 2002 net charge-offs of $330.5 million. Commercial and commercial real estate loan net charge-offs were $161.6 million for the first quarter of 2003, or .94 percent of average loans outstanding, compared with $164.8 million, or .98 percent of average loans outstanding, in the first quarter of 2003 and $152.2 million, or .88 percent of average loans outstanding, in the second quarter of 2002. Retail loan net charge-offs of $154.8 million in the second quarter of 2003 were lower than the first quarter of 2003 by $8.3 million (5.1 percent) and $19.6 million (11.2 percent) lower than the second quarter of 2002. Retail loan net charge-offs as a percent of average loans outstanding were 1.63 percent in the second quarter of 2003, compared with 1.75 percent and 1.93 percent in the first quarter of 2003 and second quarter of 2002, respectively. Lower levels of retail loan net charges-offs principally reflected seasonal improvements relative to the first quarter of 2003 and the Company’s improvement in ongoing collection efforts and risk management from a year ago. (MORE)
- 14. U.S. Bancorp Reports Second Quarter 2003 Results July 15, 2003 Page 14 Table 9 CREDIT RATIOS (Percent) 2Q 1Q 4Q 3Q 2Q 2003 2003 2002 2002 2002 Net charge-offs ratios* 1.35 1.54 1.47 1.31 1.14 Commercial 2.11 1.78 4.27 1.67 2.52 Lease financing 1.44 1.57 1.83 1.35 1.32 Total commercial 0.19 0.06 0.27 0.07 0.13 Commercial mortgages 0.14 0.06 (0.05) 0.37 0.02 Construction and development 0.17 0.06 0.19 0.15 0.10 Total commercial real estate 0.24 0.24 0.29 0.27 0.19 Residential mortgages 4.80 5.17 4.84 5.01 5.23 Credit card 0.88 0.98 0.75 0.67 0.62 Retail leasing 0.72 0.76 0.71 0.63 0.77 Home equity and second mortgages 1.59 1.69 1.90 2.07 2.24 Other retail 1.63 1.75 1.74 1.78 1.93 Total retail 1.10 1.16 1.30 1.14 1.16 Total net charge-offs Delinquent loan ratios - 90 days or more past due excluding nonperforming loans** 0.09 0.10 0.14 0.15 0.10 Commercial 0.02 0.03 0.04 0.04 0.15 Commercial real estate 0.65 0.82 0.90 0.93 0.87 Residential mortgages 0.63 0.71 0.72 0.63 0.64 Retail 0.30 0.34 0.37 0.33 0.34 Total loans Delinquent loan ratios - 90 days or more past due including nonperforming loans** 2.27 2.33 2.35 2.24 1.79 Commercial 0.82 0.85 0.90 0.82 0.85 Commercial real estate 1.13 1.37 1.44 1.62 1.64 Residential mortgages 0.70 0.77 0.79 0.70 0.74 Retail 1.32 1.40 1.43 1.38 1.24 Total loans * annualized and calculated on average loan balances ** ratios are expressed as a percent of ending loan balances The level of net charge-offs in the second quarter of 2003 reflected current economic conditions and weakness in the communications, transportation and manufacturing sectors, as well as the impact of the economy on highly leveraged enterprise value financings. However, assuming no further deterioration in the economy, the Company expects net charge-offs to trend lower. (MORE)
- 15. U.S. Bancorp Reports Second Quarter 2003 Results July 15, 2003 Page 15 Table 10 ASSET QUALITY ($ in millions) Jun 30 Mar 31 Dec 31 Sep 30 Jun 30 2003 2003 2002 2002 2002 Nonperforming loans Commercial $795.2 $808.4 $760.4 $745.2 $549.9 Lease financing 126.6 129.4 166.7 170.6 202.0 Total commercial 921.8 937.8 927.1 915.8 751.9 Commercial mortgages 182.0 174.6 174.6 157.6 133.6 Construction and development 35.3 46.1 57.5 49.1 43.4 Commercial real estate 217.3 220.7 232.1 206.7 177.0 Residential mortgages 56.0 57.4 52.0 57.7 62.0 Retail 24.2 23.9 26.1 27.1 34.3 Total nonperforming loans 1,219.3 1,239.8 1,237.3 1,207.3 1,025.2 Other real estate 71.5 66.2 59.5 63.3 49.8 Other nonperforming assets 68.9 56.6 76.7 73.8 72.7 Total nonperforming assets* $1,359.7 $1,362.6 $1,373.5 $1,344.4 $1,147.7 Accruing loans 90 days past due $360.7 $403.5 $426.4 $387.9 $392.6 Nonperforming assets to loans plus ORE (%) 1.14 1.16 1.18 1.16 1.00 *does not include accruing loans 90 days past due Nonperforming assets at June 30, 2003, totaled $1,359.7 million, compared with $1,362.6 million at March 31, 2003, and $1,147.7 million at June 30, 2002. The ratio of nonperforming assets to loans and other real estate was 1.14 percent at June 30, 2003, compared with 1.16 percent at March 31, 2003, and 1.00 percent at June 30, 2002. The Company expects nonperforming assets to remain stable given current market conditions, but expects them to trend lower as the economy improves. (MORE)
- 16. U.S. Bancorp Reports Second Quarter 2003 Results July 15, 2003 Page 16 Table 11 CAPITAL POSITION ($ in millions) Jun 30 Mar 31 Dec 31 Sep 30 Jun 30 2003 2003 2002 2002 2002 Total shareholders' equity $19,180 $18,520 $18,101 $17,518 $16,650 Tier 1 capital 13,609 12,873 12,606 13,172 12,628 Total risk-based capital 21,051 19,900 19,753 20,420 19,937 Common equity to assets 9.8 % 10.2 % 10.1 % 10.1 % 9.6 % Tangible common equity to assets 5.8 5.8 5.6 6.1 5.7 Tier 1 capital ratio 8.3 8.0 7.8 8.1 7.9 Total risk-based capital ratio 12.8 12.4 12.2 12.6 12.5 Leverage ratio 7.6 7.4 7.5 7.9 7.8 Total shareholders’ equity was $19.2 billion at June 30, 2003, compared with $16.7 billion at June 30, 2002. The increase was the result of corporate earnings offset primarily by dividends. Tangible common equity to assets was 5.8 percent at June 30, 2003, and at March 31, 2003, compared with 5.7 percent at June 30, 2002. The ratio of tangible common equity to average assets for the second quarter of 2003 was 6.1 percent, compared with 5.8 for the first quarter of 2003 and 5.9 for the second quarter of 2002. This ratio was higher than the tangible common equity to assets ratio at June 30, 2003, principally due to higher than expected deposits at quarter- end from a seasonal increase in corporate trust activities. The tier 1 capital ratio was 8.3 percent at June 30, 2003, compared with 8.0 percent at March 31, 2003, and 7.9 percent at June 30, 2002. The total risk-based capital ratio was 12.8 percent at June 30, 2003, compared with 12.4 percent at March 31, 2003, and 12.5 percent at June 30, 2002. The leverage ratio was 7.6 percent at June 30, 2003, compared with 7.4 percent at March 31, 2003, and 7.8 percent at June 30, 2002. All regulatory ratios continue to be in excess of stated “well capitalized” requirements. (MORE)
- 17. U.S. Bancorp Reports Second Quarter 2003 Results July 15, 2003 Page 17 Table 12 COMMON SHARES (Millions) 2Q 1Q 4Q 3Q 2Q 2003 2003 2002 2002 2002 Beginning shares outstanding 1,919.0 1,917.0 1,914.7 1,914.2 1,915.1 Shares issued for stock option and stock purchase plans, acquisitions and other corporate purposes 5.5 2.0 2.3 0.9 3.9 Shares repurchased -- -- -- (0.4) (4.8) Ending shares outstanding 1,924.5 1,919.0 1,917.0 1,914.7 1,914.2 On December 18, 2001, the board of directors of U.S. Bancorp approved an authorization to repurchase 100 million shares of outstanding common stock through 2003. There are approximately 91.5 million shares remaining to be repurchased under this authorization. (MORE)
- 18. U.S. Bancorp Reports Second Quarter 2003 Results July 15, 2003 Page 18 Table 13 LINE OF BUSINESS FINANCIAL PERFORMANCE* ($ in millions) Operating Earnings** Percent Change 2Q 2003 2Q 1Q 2Q 2Q03 vs 2Q03 vs YTD YTD Percent Earnings Business Line 2003 2003 2002 1Q03 2Q02 2003 2002 Change Composition Wholesale Banking $311.2 $305.6 $288.2 1.8 8.0 $616.8 $576.4 7.0 32 % Consumer Banking 400.5 386.9 365.4 3.5 9.6 787.4 702.0 12.2 42 Private Client, Trust and Asset Management 126.4 115.3 118.4 9.6 6.8 241.7 231.7 4.3 13 Payment Services 181.1 169.1 158.4 7.1 14.3 350.2 298.2 17.4 19 Capital Markets 10.0 5.9 6.7 69.5 49.3 15.9 18.2 (12.6) 1 Treasury and Corporate Support (68.4) (60.1) (67.3) (13.8) (1.6) (128.5) (115.1) (11.6) (7) Consolidated Company $960.8 $922.7 $869.8 4.1 10.5 $1,883.5 $1,711.4 10.1 100 % * preliminary data ** excluding merger and restructuring-related items and cumulative effect of change in accounting principles Lines of Business Within the Company, financial performance is measured by major lines of business which include Wholesale Banking, Consumer Banking, Private Client, Trust and Asset Management, Payment Services, Capital Markets, and Treasury and Corporate Support. Business line results are derived from the Company’s business unit profitability reporting systems. Designations, assignments and allocations may change from time to time as management systems are enhanced, methods of evaluating performance or product lines change or business segments are realigned to better respond to our diverse customer base. During 2003, certain organization and methodology changes were made and, accordingly, results for 2003 and 2002 have been restated and presented on a comparable basis. Wholesale Banking offers lending, depository, treasury management and other financial services to middle-market, large corporate and public sector clients. Wholesale Banking contributed $311.2 million of the Company’s operating earnings in the second quarter of 2003, an 8.0 percent increase over the same period of 2002 and a 1.8 percent increase over the first quarter of 2003. The increase in Wholesale Banking’s second quarter 2003 contribution over the second (MORE)
- 19. U.S. Bancorp Reports Second Quarter 2003 Results July 15, 2003 Page 19 quarter of 2002 was the result of higher net revenue (5.4 percent) and lower noninterest expense (11.9 percent), partly offset by a higher provision for credit losses (13.0 percent). Total net revenue in the second quarter of 2003 was higher than the second quarter of 2002, with favorable variances in both net interest income (5.6 percent) and noninterest income (4.9 percent). The increase in net interest income was primarily due to a significant increase in average deposits (46.1 percent). Wholesale Banking’s favorable variance in noninterest income year-over-year was driven by higher cash management fees and other income, partially offset by lower commercial products revenue, which was primarily the result of lower revenue from the loan conduit. The increase in Wholesale Banking’s contribution to operating earnings in the second quarter of 2003 over the first quarter of 2003 was the result of a slight favorable variance in net revenue (.3 percent), lower noninterest expense (2.9 percent) and a decline in the provision for credit losses (3.0 percent). Net revenue in the second quarter of 2003 was higher than the previous quarter primarily due to an increase net interest income (1.1 percent), while a decrease in salaries and employee benefits and net charge-offs drove the favorable variances in noninterest expense and the provision for credit losses, respectively. Consumer Banking delivers products and services to the broad consumer market and small businesses through banking offices, telemarketing, on-line services, direct mail and automated teller machines (“ATMs”). It encompasses community banking, metropolitan banking, small business banking, consumer lending, mortgage banking, workplace banking, student banking, 24- hour banking, and investment product and insurance sales. Consumer Banking contributed $400.5 million of the Company’s operating earnings in the second quarter of 2003, a 9.6 percent increase over the same period of 2002 and a 3.5 percent increase over the first quarter of 2003. The increase in Consumer Banking’s second quarter 2003 contribution over the second quarter of 2002 was the result of higher net revenue (22.9 percent) and a lower provision for credit losses (4.1 percent), partially offset by an increase in noninterest expense (45.0 percent). Net interest income improved year-over-year by $57.3 million (7.1 percent), the result of an increase in residential mortgages, retail loans and average deposits, as well as acquisitions. The growth in noninterest income was primarily due to increases in gains on the sale of securities, mortgage banking revenue, deposit service charges, and investment products fees and commissions. The $196.3 million of gains on the sale of securities recognized by the business line in the second quarter of 2003 represent an economic hedge to the MSR impairment of $196.3 million caused by (MORE)
- 20. U.S. Bancorp Reports Second Quarter 2003 Results July 15, 2003 Page 20 declining interest rates and related prepayments. Noninterest expense in the second quarter of 2003 was higher than the second quarter of 2002 (45.0 percent), primarily due to the increase in MSR impairment and the impact of acquisitions. The improvement in Consumer Banking’s contribution in the second quarter of 2003 over the first quarter of 2003 was the result of higher net revenue (8.4 percent) and a lower provision for credit losses (4.5 percent), partially offset by an increase in noninterest expense (15.7 percent). The favorable variance in noninterest income and unfavorable variance in noninterest expense were the result of the gains on sale of securities and MSR impairment, respectively. Private Client, Trust and Asset Management provides mutual fund processing services, trust, private banking and financial advisory services through four businesses, including: the Private Client Group, Corporate Trust, Institutional Trust and Custody, and Fund Services, LLC. The business segment also offers investment management services to several client segments including mutual funds, institutional customers, and private asset management. Private Client, Trust and Asset Management contributed $126.4 million of the Company’s operating earnings in the second quarter of 2003, 6.8 percent higher than the same period of 2002 and 9.6 percent higher than the first quarter of 2003. The favorable variance in the business line’s contribution in the second quarter of 2003 over the second quarter of 2002, was the result of a favorable variance in net revenue of $24.7 million (8.1 percent), partly offset by an unfavorable variance in noninterest expense of $11.7 million (9.9 percent). The increase in net revenue was primarily due to the acquisition of State Street Corporate Trust, which added approximately $28.8 million of net revenue in the second quarter of 2003, offset by lower equity market valuations for assets under management given equity capital market conditions. The unfavorable variance in expense was, also, primarily due to the acquisition of State Street Corporate Trust, partly offset by business line cost savings year-over-year. The $11.1 million (9.6 percent) increase in the business line’s contribution in the second quarter of 2003 over the first quarter of 2003 was the result of higher net revenue (5.1 percent) and lower noninterest expense (1.5 percent). The increase in net revenue was driven by an improvement in equity valuations associated with assets under management since the first quarter and seasonal trust fees. Payment Services includes consumer and business credit cards, corporate and purchasing card services, consumer lines of credit, ATM processing, merchant processing, and debit cards. Payment Services contributed $181.1 million of the Company’s operating earnings in the second (MORE)
- 21. U.S. Bancorp Reports Second Quarter 2003 Results July 15, 2003 Page 21 quarter of 2003, a 14.3 percent increase over the same period of 2002 and a 7.1 percent increase over the first quarter of 2003. The increase in Payment Services’ contribution in the second quarter of 2003 over the second quarter of 2002 was the result of higher net revenue (1.9 percent), a decline in noninterest expense (3.6 percent) and a lower provision for credit losses (14.5 percent). The growth in net revenue year-over-year was primarily due to growth in credit and debit card revenue, corporate payment products revenue and ATM processing services (8.6 percent), offset by a slight decrease in merchant processing revenue (1.8 percent). Noninterest expense declined by $7.2 million (3.6 percent) in the second quarter of 2003 from the second quarter of 2002, primarily due to reduced fraud losses and third-party merchant processing costs. The increase in Payment Services’ contribution in the second quarter of 2003 from the previous quarter was primarily due to seasonally higher net revenue (3.7 percent) and a lower provision for credit losses, partially offset by higher noninterest expense (3.1 percent). The increase in noninterest expense on a linked quarter basis was principally due to higher marketing expense in the retail card division. Capital Markets engages in equity and fixed income trading activities, offers investment banking and underwriting services for corporate and public sector customers and provides financial advisory services and securities, mutual funds, annuities and insurance products to consumers and regionally based businesses through a network of brokerage offices. Capital Markets contributed $10.0 million of the Company’s operating earnings in the second quarter of 2003, compared with a contribution of $6.7 million in the second quarter of 2002 and $5.9 million in the first quarter of 2003. The business line’s contribution was higher in the second quarter of 2003 than the same quarter of 2002, primarily due to an increase in net revenue (4.1 percent), partially offset by an increase in noninterest expense. The increase in Capital Markets’ contribution in the second quarter of 2003 over the previous quarter was primarily the result of an increase in noninterest income (20.6 percent), driven by continued strong fixed income business and an improvement in equity capital markets activities. Partly offsetting the favorable variance in noninterest income was an increase in noninterest expense (17.4 percent), which was principally due to higher commission based salaries and incentives related to higher capital markets revenue, as well as incremental litigation expense. Treasury and Corporate Support includes the Company’s investment portfolios, funding, capital management and asset securitization activities, interest rate risk management, the net effect of transfer pricing related to average balances and business activities managed on a corporate basis, (MORE)
- 22. U.S. Bancorp Reports Second Quarter 2003 Results July 15, 2003 Page 22 including enterprise-wide operations and administrative support functions. Treasury and Corporate Support recorded an operating loss of $68.4 million in the second quarter of 2003, compared with operating losses of $67.3 million in the second quarter of 2002 and $60.1 million in the first quarter of 2003. The increase in the loss year-over-year was the result of a slight decrease in net revenue of $6.1 million (2.6 percent) and a $22.6 million (6.2 percent) increase in noninterest expense, partially offset by a benefit from the change in the effective tax rate year-over-year. The increase in net revenue over the second quarter of 2002 was primarily due to higher net interest income (12.5 percent), driven by the investment securities portfolio, offset by a reduction in gains on the sale of securities and miscellaneous other income. The unfavorable variance in noninterest expense year-over-year was principally due to salaries and employee benefits, including pension costs. The increase in the business line’s loss in the second quarter of 2003 over the first quarter of 2003 was the result of unfavorable variances in net revenue (7.6 percent) and noninterest expense (1.7 percent). The change in net revenue was due to the net effect of higher net interest income (9.3 percent), offset by a reduction in gains from the sale of securities and equity investment valuations, while noninterest expense rose from the prior quarter primarily due to marketing and public relations expense. Additional schedules containing more detailed information about the Company’s business line results are available on the web at usbank.com or by calling Investor Relations at 612-303-0781. (MORE)
- 23. U.S. Bancorp Reports Second Quarter 2003 Results July 15, 2003 Page 23 VICE CHAIRMAN AND CHIEF FINANCIAL OFFICER DAVID M. MOFFETT WILL HOST A CONFERENCE CALL TO REVIEW THE FINANCIAL RESULTS ON TUESDAY, July 15, 2003, AT 1:00 p.m. (CDT). To access the conference call, please dial 800- 223-9488 and ask for the U.S. Bancorp earnings conference call. Participants calling from outside the United States, please call 785-832-1508. For those unable to participate during the live call, a recording of the call will be available from 5:00 p.m. (CDT) on Tuesday, July 15, 2003 through 11:00 p.m. (CDT) on Tuesday, July 22, 2003. To access the recorded message dial 888-566-0150. If calling from outside the United States, please dial 402-220-9185. Minneapolis-based U.S. Bancorp (“USB”), with $195 billion in assets, is the 8th largest financial services holding company in the United States. The company operates 2,199 banking offices and 4,575 ATMs, and provides a comprehensive line of banking, brokerage, insurance, investment, mortgage, and trust and payment services products to consumers, businesses and institutions. U.S. Bancorp is the parent company of U.S. Bank. Visit U.S. Bancorp on the web at usbank.com. (MORE)
- 24. U.S. Bancorp Reports Second Quarter 2003 Results July 15, 2003 Page 24 Forward-Looking Statements This press release contains forward-looking statements. Statements that are not historical or current facts, including statements about beliefs and expectations, are forward-looking statements. These statements often include the words “may,” “could,” “would,” “should,” “believes,” “expects,” “anticipates,” “estimates,” “intends,” “plans,” “targets,” “potentially,” “probably,” “projects,” “outlook” or similar expressions. These forward-looking statements cover, among other things, anticipated future revenue and expenses, and the future prospects of the Company. Forward-looking statements involve inherent risks and uncertainties, and important factors could cause actual results to differ materially from those anticipated, including the following, in addition to those contained in the Company's reports on file with the SEC: (i) general economic or industry conditions could be less favorable than expected, resulting in a deterioration in credit quality, a change in the allowance for credit losses, or a reduced demand for credit or fee- based products and services; (ii) changes in the domestic interest rate environment could reduce net interest income and could increase credit losses; (iii) inflation, changes in securities market conditions and monetary fluctuations could adversely affect the value or credit quality of the Company's assets, or the availability and terms of funding necessary to meet the Company's liquidity needs; (iv) changes in the extensive laws, regulations and policies governing financial services companies could alter the Company's business environment or affect operations; (v) the potential need to adapt to industry changes in information technology systems, on which the Company is highly dependent, could present operational issues or require significant capital spending; (vi) competitive pressures could intensify and affect the Company's profitability, including as a result of continued industry consolidation, the increased availability of financial services from non-banks, technological developments, or bank regulatory reform; (vii) changes in consumer spending and savings habits could adversely affect the Company’s results of operations; (viii) changes in the financial performance and condition of the Company’s borrowers could negatively affect repayment of such borrowers’ loans; (ix) acquisitions may not produce revenue enhancements or cost savings at levels or within time frames originally anticipated, or may result in unforeseen integration difficulties; (x) capital investments in the Company's businesses may not produce expected growth in earnings anticipated at the time of the expenditure; and (xi) acts or threats of terrorism, and/or political and military actions taken by the U.S. or other governments in response to acts or threats of terrorism or otherwise could adversely affect general economic or industry conditions. Forward-looking statements speak only as of the date they are made, and the Company undertakes no obligation to update them in light of new information or future events. ### (MORE)
- 25. U.S. Bancorp Consolidated Statement Of Income Three Months Ended Six Months Ended (Dollars and Shares in Millions, Except Per Share Data) June 30, June 30, (Unaudited) 2003 2002 2003 2002 Interest Income Loans $1,821.0 $1,936.9 $3,657.8 $3,868.8 Loans held for sale 51.8 36.6 111.4 75.8 Investment securities Taxable 422.4 346.1 818.5 693.9 Non-taxable 7.5 11.7 16.4 24.9 Money market investments 2.6 2.2 6.6 5.5 Trading securities 7.3 9.4 15.3 17.6 Other interest income 27.0 32.7 56.3 51.7 Total interest income 2,339.6 2,375.6 4,682.3 4,738.2 Interest Expense Deposits 288.5 375.8 595.1 771.3 Short-term borrowings 42.8 68.3 86.2 147.2 Long-term debt 185.5 216.8 371.3 408.9 Company-obligated mandatorily redeemable preferred securities of subsidiary trusts holding solely the junior subordinated debentures of the parent company 24.5 33.9 55.9 68.7 Total interest expense 541.3 694.8 1,108.5 1,396.1 Net interest income 1,798.3 1,680.8 3,573.8 3,342.1 Provision for credit losses 323.0 335.0 658.0 670.0 Net interest income after provision for credit losses 1,475.3 1,345.8 2,915.8 2,672.1 Noninterest Income Credit and debit card revenue 142.3 131.2 269.7 240.5 Corporate payment products revenue 90.9 82.5 176.9 157.7 ATM processing services 36.0 33.5 72.9 64.4 Merchant processing services 141.8 144.4 269.1 278.0 Trust and investment management fees 241.9 234.9 472.2 459.2 Deposit service charges 184.9 173.3 353.6 329.0 Cash management fees 111.8 104.3 223.8 208.5 Commercial products revenue 100.0 123.7 204.2 245.9 Mortgage banking revenue 90.3 78.0 185.7 130.0 Trading account profits and commissions 67.6 49.5 128.5 99.4 Investment products fees and commissions 109.2 107.4 209.5 218.5 Investment banking revenue 56.8 70.5 94.4 123.7 Securities gains, net 213.1 30.6 353.8 74.7 Other 79.4 80.0 174.6 147.3 Total noninterest income 1,666.0 1,443.8 3,188.9 2,776.8 Noninterest Expense Salaries 625.3 607.6 1,227.1 1,195.9 Employee benefits 95.0 91.1 204.2 187.5 Net occupancy 101.1 101.8 203.3 201.9 Furniture and equipment 72.0 77.0 145.4 153.9 Capitalized software 38.2 37.7 75.5 76.1 Communication 50.5 44.1 101.7 89.8 Postage 45.9 44.4 91.3 91.0 Other intangible assets 312.3 104.7 547.4 184.9 Merger and restructuring-related charges 10.8 71.6 28.4 145.8 Other 345.4 346.9 646.3 643.0 Total noninterest expense 1,696.5 1,526.9 3,270.6 2,969.8 Income before income taxes and cumulative effect of change in accounting principles 1,444.8 1,262.7 2,834.1 2,479.1 Applicable income taxes 491.2 439.6 969.3 862.8 Income before cumulative effect of change in accounting principles 953.6 823.1 1,864.8 1,616.3 Cumulative effect of change in accounting principles -- -- -- (37.2) Net income $953.6 $823.1 $1,864.8 $1,579.1 Earnings Per Share Income before cumulative effect of change in accounting principles $.50 $.43 $.97 $.84 Cumulative effect of change in accounting principles -- -- -- (.02) Net income $.50 $.43 $.97 $.82 Diluted Earnings Per Share Income before cumulative effect of change in accounting principles $.49 $.43 $.97 $.84 Cumulative effect of change in accounting principles -- -- -- (.02) Net income $.49 $.43 $.97 $.82 Dividends declared per share $.205 $.195 $.41 $.39 Average common shares 1,922.3 1,913.2 1,920.6 1,916.5 Average diluted common shares 1,932.8 1,926.9 1,929.7 1,928.5 Page 25
- 26. U.S. Bancorp Consolidated Ending Balance Sheet June 30, December 31, June 30, (Dollars in Millions) 2003 2002 2002 Assets (Unaudited) (Unaudited) Cash and due from banks $11,795 $10,758 $7,531 Money market investments 3,213 434 1,113 Trading securities 1,039 898 703 Investment securities Held-to-maturity 188 233 290 Available-for-sale 35,390 28,255 30,384 Loans held for sale 3,791 4,159 1,930 Loans Commercial 42,238 41,944 44,491 Commercial real estate 27,259 26,867 25,300 Residential mortgages 11,712 9,746 8,107 Retail 38,214 37,694 36,672 Total loans 119,423 116,251 114,570 Less allowance for credit losses (2,368) (2,422) (2,466) Net loans 117,055 113,829 112,104 Premises and equipment 2,064 1,697 1,718 Customers' liability on acceptances 148 140 157 Goodwill 6,329 6,325 5,442 Other intangible assets 1,984 2,321 2,176 Other assets 11,903 10,978 9,408 Total assets $194,899 $180,027 $172,956 Liabilities and Shareholders' Equity Deposits Noninterest-bearing $44,465 $35,106 $31,272 Interest-bearing 72,315 68,214 63,172 Time deposits greater than $100,000 9,547 12,214 10,612 Total deposits 126,327 115,534 105,056 Short-term borrowings 7,387 7,806 9,156 Long-term debt 31,379 28,588 33,008 Company-obligated mandatorily redeemable preferred securities of subsidiary trusts holding solely the junior subordinated debentures of the parent company 2,652 2,994 2,894 Acceptances outstanding 148 140 157 Other liabilities 7,826 6,864 6,035 Total liabilities 175,719 161,926 156,306 Shareholders' equity Common stock 20 20 20 Capital surplus 4,821 4,850 4,875 Retained earnings 14,795 13,719 12,756 Less treasury stock (1,092) (1,272) (1,341) Other comprehensive income 636 784 340 Total shareholders' equity 19,180 18,101 16,650 Total liabilities and shareholders' equity $194,899 $180,027 $172,956 Page 26
- 27. Supplemental Analyst Schedules 2Q 2003
- 28. U.S. Bancorp Income Statement Highlights Financial Results and Ratios on an Operating Basis (Excluding Merger and Restructuring-Related Items) Three Months Ended Percent Change v. June 30, 2003 (Dollars in Millions, Except Per Share Data) June 30, March 31, June 30, March 31, June 30, (Unaudited) 2003 2003 2002 2003 2002 Net interest income (taxable-equivalent basis) $1,805.9 $1,783.8 $1,689.8 1.2 % 6.9 % Noninterest income 1,666.0 1,522.9 1,443.8 9.4 15.4 Total net revenue 3,471.9 3,306.7 3,133.6 5.0 10.8 Noninterest expense 1,685.7 1,556.5 1,455.3 8.3 15.8 Operating income before merger and restructuring- related items 1,786.2 1,750.2 1,678.3 2.1 6.4 Provision for credit losses 323.0 335.0 335.0 (3.6) (3.6) Income before taxes and merger and restructuring-related items 1,463.2 1,415.2 1,343.3 3.4 8.9 Taxable-equivalent adjustment 7.6 8.3 9.0 (8.4) (15.6) Applicable income taxes 494.8 484.2 464.5 2.2 6.5 Income before merger and restructuring-related items 960.8 922.7 869.8 4.1 10.5 Merger and restructuring-related items (after-tax) (7.2) (11.5) (46.7) * * Net income in accordance with GAAP $953.6 $911.2 $823.1 4.7 15.9 Diluted earnings per share Earnings, before merger and restructuring-related items $.50 $.48 $.45 4.2 11.1 Net income .49 .47 .43 4.3 14.0 Financial Ratios Net interest margin** 4.50 % 4.56 % 4.59 % Interest yield on average loans ** 6.21 6.41 6.82 Rate paid on interest-bearing liabilities 1.69 1.83 2.32 Return on average assets 2.06 2.04 2.06 Return on average equity 20.2 20.3 21.2 Efficiency ratio *** 51.7 49.2 46.9 Tangible efficiency ratio **** 42.1 41.7 43.5 * Not meaningful ** On a taxable-equivalent basis *** Computed as noninterest expense divided by the sum of net interest income on a taxable-equivalent basis and noninterest income excluding securities gains (losses), net **** Computed as noninterest expense divided by the sum of net interest income on a taxable-equivalent basis and noninterest income excluding securities gains (losses), net and intangible amortization Page 28
- 29. U.S. Bancorp Income Statement Highlights Financial Results and Ratios on an Operating Basis (Excluding Merger and Restructuring-Related Items and Cumulative Effect of Change in Accounting Principles) Six Months Ended (Dollars in Millions, Except Per Share Data) June 30, June 30, Percent (Unaudited) 2003 2002 Change Net interest income (taxable-equivalent basis) $3,589.7 $3,360.2 6.8 % Noninterest income 3,188.9 2,776.8 14.8 Total net revenue 6,778.6 6,137.0 10.5 Noninterest expense 3,242.2 2,824.0 14.8 Operating income before merger and restructuring- related items and cumulative effect of change in accounting principles 3,536.4 3,313.0 6.7 Provision for credit losses 658.0 670.0 (1.8) Income before taxes, merger and restructuring-related items and cumulative effect of change in accounting principles 2,878.4 2,643.0 8.9 Taxable-equivalent adjustment 15.9 18.1 (12.2) Applicable income taxes 979.0 913.5 7.2 Income before merger and restructuring-related items and cumulative effect of change in accounting principles 1,883.5 1,711.4 10.1 Merger and restructuring-related items (after-tax) (18.7) (95.1) * Cumulative effect of change in accounting principles (after-tax) -- (37.2) * Net income in accordance with GAAP $1,864.8 $1,579.1 18.1 Diluted earnings per share Earnings, before merger and restructuring-related items and cumulative effect of change in accounting principles $.98 $.89 10.1 Net income .97 .82 18.3 Financial Ratios Net interest margin** 4.53 % 4.60 % Interest yield on average loans ** 6.31 6.86 Rate paid on interest-bearing liabilities 1.76 2.36 Return on average assets 2.05 2.05 Return on average equity 20.2 21.1 Efficiency ratio *** 50.5 46.6 Tangible efficiency ratio **** 41.9 43.5 * Not meaningful ** On a taxable-equivalent basis *** Computed as noninterest expense divided by the sum of net interest income on a taxable-equivalent basis and noninterest income excluding securities gains (losses), net **** Computed as noninterest expense divided by the sum of net interest income on a taxable-equivalent basis and noninterest income excluding securities gains (losses), net and intangible amortization Page 29