
Recomendados
Mais conteúdo relacionado
Mais procurados
Mais procurados (14)
Semelhante a delta air line Reconciliations 2003
Semelhante a delta air line Reconciliations 2003 (20)
Mais de finance13
Mais de finance13 (20)
Último
Último (20)
delta air line Reconciliations 2003
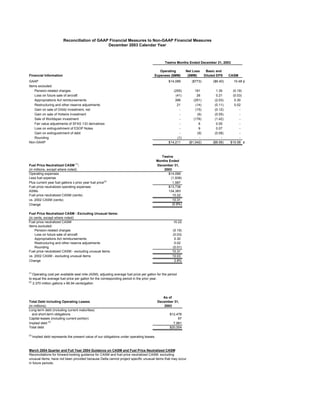
- 1. Reconciliation of GAAP Financial Measures to Non-GAAP Financial Measures December 2003 Calendar Year Twelve Months Ended December 31, 2003 Operating Net Loss Basic and Financial Information Expenses ($MM) ($MM) Diluted EPS CASM ($6.40) 10.48 ¢ GAAP $14,089 ($773) Items excluded: Pension-related charges (255) 161 1.30 (0.19) Loss on future sale of aircraft (41) 26 0.21 (0.03) Appropriations Act reimbursements 398 (251) (2.03) 0.30 Restructuring and other reserve adjustments 21 (14) (0.11) 0.02 Gain on sale of Orbitz investment, net - (15) (0.12) - Gain on sale of Hotwire investment - (6) (0.05) - Sale of Worldspan investment - (176) (1.42) - Fair value adjustments of SFAS 133 derivatives - 6 0.05 - Loss on extinguishment of ESOP Notes - 9 0.07 - Gain on extinguishment of debt - (9) (0.08) - Rounding (1) - - - Non-GAAP $14,211 ($1,042) ($8.58) $10.58 ¢ Twelve Months Ended (1) Fuel Price Neutralized CASM : December 31, (in millions, except where noted) 2003 Operating expenses $14,089 Less fuel expense (1,938) Plus current year fuel gallons x prior year fuel price(2) 1,587 Fuel price neutralized operating expenses $13,738 ASMs 134,383 Fuel price neutralized CASM (cents) 10.22 vs. 2002 CASM (cents) 10.31 (0.9%) Change Fuel Price Neutralized CASM - Excluding Unusual Items: (in cents, except where noted) Fuel price neutralized CASM 10.22 Items excluded: Pension-related charges (0.19) Loss on future sale of aircraft (0.03) Appropriations Act reimbursements 0.30 Restructuring and other reserve adjustments 0.02 Rounding (0.01) Fuel price neutralized CASM - excluding unusual items 10.31 vs. 2002 CASM - excluding unusual items 10.03 Change 2.8% (1) Operating cost per available seat mile (ASM), adjusting average fuel price per gallon for the period to equal the average fuel price per gallon for the corresponding period in the prior year. (2) 2,370 million gallons x 66.94 cents/gallon As of Total Debt including Operating Leases December 31, (in millions) 2003 Long-term debt (including current maturities) and short-term obligations $12,476 Capital leases (including current portion) 97 Implied debt (3) 7,981 Total debt $20,554 (3) Implied debt represents the present value of our obligations under operating leases. March 2004 Quarter and Full Year 2004 Guidance on CASM and Fuel Price Neutralized CASM Reconciliations for forward-looking guidance for CASM and fuel price neutralized CASM, excluding unusual items, have not been provided because Delta cannot project specific unusual items that may occur in future periods.
- 2. Reconciliation of GAAP Financial Measures to Non-GAAP Financial Measures December 2003 Quarter Three Months Ended December 31, 2003 Operating Basic and Financial Information Expenses ($MM) Net Loss ($MM) Diluted EPS CASM GAAP $3,764 ($327) ($2.69) 10.87 ¢ Items excluded: Pension-related charges (212) 134 1.08 (0.61) Loss on future sale of aircraft (41) 26 0.21 (0.12) Restructuring and other reserve adjustments 21 (14) (0.11) 0.06 Gain on sale of Orbitz investment, net - (15) (0.12) - Gain on sale of Hotwire investment - (6) (0.05) - Fair value adjustments of SFAS 133 derivatives - (5) (0.03) - Non-GAAP $3,532 ($207) ($1.71) 10.20 ¢ Three Months Ended (1) Fuel Price Neutralized CASM : December 31, (in millions, except where noted) 2003 Operating expenses $3,764 Less fuel expense (510) Plus current year fuel gallons x prior year fuel price (2) 458 Fuel price neutralized operating expenses $3,712 ASMs 34,636 Fuel price neutralized CASM (cents) 10.72 vs. December 2002 quarter CASM (cents) 10.40 3.1% Change Fuel Price Neutralized CASM - Excluding Unusual Items: (in cents, except where noted) Fuel price neutralized CASM 10.72 Items excluded: Pension-related charges (0.61) Loss on future sale of aircraft (0.12) Restructuring and other reserve adjustments 0.06 Fuel price neutralized CASM - excluding unusual items 10.05 vs. December 2002 quarter CASM - excluding unusual items 9.97 Change 0.8% (1) Operating cost per available seat mile (ASM), adjusting average fuel price per gallon for the period to equal the average fuel price per gallon for the corresponding period in the prior year. (2) 602 million gallons x 76.03 cents/gallon As of Total Debt including Operating Leases December 31, (in millions) 2003 Long-term debt (including current maturities) and short-term obligations $12,476 Capital leases (including current portion) 97 Implied debt (3) 7,981 Total debt $20,554 (3) Implied debt represents the present value of our obligations under operating leases. Three Months Ended Mainline CASM - Excluding Unusual Items December 31, (in millions, except where noted) 2003 Operating expenses $3,764 Less subsidiary operating expenses (4) (497) Mainline operating expenses 3,267 Less: Pension-related charges (212) Loss on future sale of aircraft (41) Restructuring and other reserve adjustments 21 Mainline operating expenses - excluding unusual items $3,035 Mainline ASMs 30,800 9.85 ¢ Mainline CASM - excluding unusual items Three Months Ended Mainline CASM - Excluding Unusual Items and Pilot Cost December 31, (in millions, except where noted) 2003 Mainline operating expenses - excluding unusual items (see above) $3,035 Less: Delta pilot cost (515)
- 3. Reconciliation of GAAP Financial Measures to Non-GAAP Financial Measures December 2003 Quarter Mainline operating expenses - excluding unusual items and pilot cost $2,520 Mainline ASMs 30,800 8.18 ¢ Mainline CASM - excluding unusual items and pilot cost (4) Represents operating expenses for our regional jet operations including Atlantic Southeast Airlines, Inc. and Comair, Inc., two of our wholly owned subsidiaries. Three Months Ended Non-Fleet Capital Expenditures December 31, (in millions) 2003 Cash used by investing activities - GAAP ($64) Less: Proceeds from the sale of Orbitz and Hotwire (45) Flight equipment additions less aircraft parts and modifications (11) Boston airport terminal project reimbursements in excess of payments (5) Non-fleet capital expenditures ($125) Three Months Ended Negative Cash Flow December 31, (in millions) 2003 Cash provided by operating activities - GAAP $82 Less: Non-fleet capital expenditures (see above) (125) Negative cash flow ($43) Three Months Ended Adjusted Net Loss Assuming the Pilot Cost Structure of a Restructured Peer Carrier December 31, (in millions) 2003 Net loss ($327) Add: Delta pilot costs 332 Less: Delta pilot costs, assuming the pilot cost structure of a restructured peer carrier (209) Adjusted net loss assuming the pilot cost structure of a restructured peer carrier ($204) Three Months Ended Adjusted Net Loss Assuming the Pilot Cost Structure of a Low Cost Carrier December 31, (in millions) 2003 Net loss ($327) Add: Delta pilot costs 332 Less: Delta pilot costs, assuming the pilot cost structure of a low cost carrier (113) Adjusted net loss assuming the pilot cost structure of a low cost carrier ($108) March 2004 Quarter and Full Year 2004 Guidance on CASM and Fuel Price Neutralized CASM Reconciliations for forward-looking guidance for CASM and fuel price neutralized CASM, excluding unusual items, have not been provided because Delta cannot project specific unusual items that may occur in future periods.
- 4. Reconciliation of GAAP Financial Measures to Non-GAAP Financial Measures September 2003 Quarter Three Months Ended September 30, 2003 Operating Net Loss Basic and Financial Information Expenses ($MM) ($MM) Diluted EPS CASM ($1.36) 10.21 ¢ GAAP $3,524 ($164) Items excluded: Gain on extinquishment of debt - (9) (0.08) - Fair value adjustments of SFAS 133 derivatives - 1 0.01 - Non-GAAP $3,524 ($172) ($1.43) 10.21 ¢ Three Months Ended (1) Fuel Price Neutralized CASM : September 30, (in millions, except where noted) 2003 Operating expenses $3,524 Less fuel expense (482) (2) Plus current year fuel gallons x prior year fuel price 434 Fuel price neutralized operating expenses $3,476 ASMs 34,509 Fuel price neutralized CASM - including and excluding unusual items (cents) 10.08 vs. September 2002 quarter CASM - excluding unusual items 9.81 2.8% Change (1) Operating cost per available seat mile (ASM), adjusting average fuel price per gallon for the period to equal the average fuel price per gallon for the corresponding period in the prior year. (2) 609 million gallons x 71.33 cents/gallon Three Months Ended Net Debt-to-Capital Ratio September 30, (in millions) 2003 LT debt (including current maturities) and short-term obligations $12,442 Capital leases (including current portion) 101 (3) Net implied debt 5,460 Total net debt $18,003 Total net debt $18,003 ESOP preferred stock 271 Shareowners' equity 497 Total capital $18,771 Net debt-to-capital ratio 96% (3) Net implied debt represents the present value of our obligations under operating leases, net of cash, cash equivalents and short term investments. Three Months Ended Adjusted Net Loss Assuming American Airlines' Pilot Cost Structure September 30, (in millions) 2003 Net loss excluding unusual items ($172) Add: Delta pilot costs 286 Less: Delta pilot costs, assuming American Airlines' pilot cost structure (160) Adjusted net loss assuming American Airlines' pilot cost structure ($46) Three Months Ended Mainline CASM September 30, (in millions, except where noted) 2003 Operating expenses $3,524 (4) Less subsidiary operating expenses (466) (5) Mainline operating expenses $3,058 Mainline ASMs 30,901 (5) Mainline CASM 9.90 ¢ (4) Represents operating expenses for our regional jet operations including Atlantic Southeast Airlines, Inc. and Comair, Inc., two of our wholly owned subsidiaries. (5) During the three months ended September 30, 2003, there were no unusual items related to Delta's total operating expenses. December 2003 Quarter and Full Year 2003 Guidance on CASM and Fuel Price Neutralized CASM Reconciliations for forward-looking guidance for CASM and fuel price neutralized CASM, excluding unusual items, have not been provided because Delta cannot project specific unusual items that may occur in future periods.
- 5. Reconciliation of GAAP Financial Measures to Non-GAAP Financial Measures June 2003 Quarter Three Months Ended June 30, 2003 Operating Operating Pretax Income Net Income Financial Information Expenses Income (Loss) (Loss) (Loss) Basic EPS (in millions, except per share data) $1.46 GAAP $3,111 $196 $301 $184 Items excluded: (398) Appropriations Act reimbursements 398 (398) (251) (2.03) (279) Sale of Worldspan investment - - (176) (1.42) Fair value adjustments of SFAS 133 derivatives - - 9 6 0.04 Non-GAAP $3,509 ($202) ($367) ($237) ($1.95) Three Months Ended June 30, 2003 Breakeven Operating Non-Fuel CASM Passenger Load Operating Statistics Margin CASM (cents) (cents) Factor 5.9% 9.71 70.34% GAAP 8.35 Items excluded: (12.0%) Appropriations Act reimbursements 1.24 1.24 9.82% (6.1%) Non-GAAP 10.95 9.59 80.16% Three Months Ended (1) Fuel Price Neutralized CASM : June 30, (in millions, except where noted) 2003 Operating expenses $3,111 Less fuel expense (435) Plus current year fuel gallons x prior year fuel price (2) 360 Fuel price neutralized operating expenses $3,036 ASMs 32,034 Fuel price neutralized CASM (cents) 9.48 vs. June 2002 quarter CASM (cents) 10.05 (5.7%) Change Fuel Price Neutralized CASM - Excluding Unusual Items: (in cents, except where noted) Fuel price neutralized CASM 9.48 Items excluded: Appropriations Act reimbursements 1.24 Fuel price neutralized CASM - excluding unusual items 10.72 vs. June 2002 quarter CASM - excluding unusual items 9.98 Change 7.4% (1) Operating cost per available seat mile (ASM), adjusting average fuel price per gallon for the period to equal the average fuel price per gallon for the corresponding period in the prior year. (2) 571 million gallons x 63.13 cents/gallon Three Three Months Ended Months Ended (3) Daily Cash Burn : June 30, Cash Flow from Operations Excluding June 30, (in millions) 2003 Unusual Cash Items (in millions) 2003 Cash provided by operating activities - GAAP $335 Cash provided by operating activities - GAAP $335 Cash provided by investing activities - GAAP 181 Add: change in restricted cash 56 516 Less: Appropriations Act reimbursements (398) Add: Cash Flow from Operations Excluding Change in restricted cash 56 Unusual Cash Items ($7) Less: (4) Aircraft capital expenditures (15) Appropriations Act reimbursements (398) Sale of Worldspan investment (265) (106) Divide by days in quarter 91 (4) Daily cash burn ($1.2) (3) Defined as adjusted cash flow from operations plus non-fleet capital expenditures. (4) Adjusted to reflect expenditures for the period.
- 6. Reconciliation of GAAP Financial Measures to Non-GAAP Financial Measures June 2003 Quarter Three Months Ended Mainline CASM June 30, (in millions, except where noted) 2003 Operating expenses $3,111 Less subsidiary operating expenses (5) (373) Mainline operating expenses 2,738 Less Mainline Appropriations Act reimbursement (6) 319 Mainline operating expenses - excluding unusual items $3,057 Mainline ASMs 28,628 10.68 ¢ Mainline CASM - excluding unusual items (5) Represents operating expenses for our regional jet operations including Atlantic Southeast Airlines, Inc. and Comair, Inc., two of our wholly owned subsidiaries. (6) Delta Air Lines, Inc. received $398 million in security fee reimbursements under the Appropriations Act during the June 2003 quarter. Of the $398 million received, $319 million related to our mainline operations and $79 million related to our regional jet operations. Three Months Ended Net Debt-to-Capital Ratio June 30, (in millions) 2003 LT debt (including current maturities) and short-term obligations $ 12,188 Capital leases (including current portion) 109 Net implied debt (7) 5,372 Total net debt 17,669 Total net debt 17,669 ESOP preferred stock 266 Shareowners' equity 679 Total capital $ 18,614 Net debt-to-capital ratio 95% (7) Net implied debt represents the present value of our obligations under operating leases, net of cash, cash equivalents and short term investments.
- 7. Reconciliation of GAAP Financial Measures to Non-GAAP Financial Measures March 2003 Quarter Three Months Ended March 31, 2003 Operating Basic and Financial Information Expenses Operating Loss Pretax Loss Net Loss Diluted EPS (in millions, except per share data) ($466) ($3.81) GAAP $3,690 ($535) ($724) Items excluded: 43 43 Pension benefits for 2002 workforce reductions (43) 27 0.22 14 Loss on extinguishment of ESOP Notes - - 9 0.07 Fair value adjustments of SFAS 133 derivatives - - 6 4 0.03 Non-GAAP $3,647 ($492) ($661) ($426) ($3.49) Three Months Ended March 31, 2003 Breakeven Non-Fuel CASM Passenger Load Operating Statistics Operating Margin CASM (cents) (cents) Factor (17.0%) 11.11 81.49% GAAP 9.57 Items excluded: (1.02%) Pension benefits for 2002 workforce reductions 1.0% (0.13) (0.13) (16.0%) Non-GAAP 10.98 9.44 80.47% Three Months Ended Fuel Price Neutralized CASM (1) : March 31, (in millions, except where noted) 2003 Operating expenses $3,690 Less fuel expense (511) Plus current year fuel gallons x prior year fuel price (2) 333 Fuel price neutralized operating expenses $3,512 ASMs 33,204 Fuel price neutralized CASM (cents) 10.58 vs. March 2002 quarter CASM (cents) 10.49 Change 0.9% Fuel Price Neutralized CASM - Excluding Unusual Items: (in cents, except where noted) Fuel price neutralized CASM 10.58 Items excluded: Pension benefits for 2002 workforce reductions (0.13) Fuel price neutralized CASM - excluding unusual items 10.45 vs. March 2002 quarter CASM - excluding unusual items 10.37 Change 0.8% (1) Operating cost per available seat mile (ASM), adjusting average fuel price per gallon for the period to equal the average fuel price per gallon for the corresponding period in the prior year. (2) 588 million gallons x 56.68 cents/gallon Three Months Ended Daily Cash Burn (3): March 31, (in millions) 2003 Cash used in operating activities - GAAP ($165) Cash used in investing activities - GAAP (165) (330) Add: Change in restricted cash 19 Aircraft capital expenditures 70 (241) Divide by days in quarter 90 Daily cash burn ($2.7) (3) Defined as adjusted cash flow from operations plus non-fleet capital expenditures.