SlideShare a Scribd company logo
1 of 12
Download to read offline
CONSOLIDATED STATEMENT OF OPERATIONS

                                                                                                           Millions of Dollars
                                                                                 2007                                                                 2008
                                                        1st Qtr      2nd Qtr      3rd Qtr     4th Qtr        YTD            1st Qtr        2nd Qtr     3rd Qtr     4th Qtr           YTD

Revenues and Other Income
 Sales and other operating revenues*                    41,320       47,370       46,062      52,685     187,437            54,883         71,411      70,044      44,504        240,842
 Equity in earnings of affiliates                          929        1,506        1,314       1,338       5,087             1,359          1,812       1,214        (135)         4,250
 Other income                                              618          521          557         275       1,971               310            130         115         535          1,090
                                                        42,867       49,397       47,933      54,298     194,495            56,552         73,353      71,373      44,904        246,182

Costs and Expenses
 Purchased crude oil, natural gas and products          26,715       30,820       30,862      35,032     123,429            37,820         51,214      49,608      30,021        168,663
 Production and operating expenses                       2,492        2,557        2,620       3,014      10,683             2,691          3,111       3,059       2,957         11,818
 Selling, general and administrative expenses              527          604          569         606       2,306               526            629         513         561          2,229
 Exploration expenses                                      262          259          218         268       1,007               309            288         267         473          1,337
 Depreciation, depletion and amortization                2,024        2,016        2,052       2,206       8,298             2,209          2,178       2,361       2,264          9,012
 Impairments
   Goodwill recoverability                                   -            -            -           -           -                 -              -           -      25,443         25,443
   LUKOIL investment                                         -            -            -           -           -                 -              -           -       7,410          7,410
   Expropriated assets                                       -        4,588            -           -       4,588                 -              -           -           -              -
   Other                                                    (1)          98          188         157         442                 6             19          57       1,604          1,686
 Taxes other than income taxes*                          4,374        4,697        4,583       5,336      18,990             5,155          5,796       5,619       4,067         20,637
 Accretion on discounted liabilities                        79           81           81         100         341               104             96         114         104            418
 Interest and debt expense                                 307          319          391         236       1,253               207            210         239         279            935
 Foreign currency transaction (gains) losses                 1         (179)         (20)         (3)       (201)              (43)             -          54         106            117
 Minority interests                                         21           19           25          22          87                19             17          15          19             70
                                                        36,801       45,879       41,569      46,974     171,223            49,003         63,558      61,906      75,308        249,775

 Income (loss) before income taxes                       6,066        3,518        6,364       7,324      23,272             7,549          9,795       9,467      (30,404)        (3,593)
 Provision for income taxes                              2,520        3,217        2,691       2,953      11,381             3,410          4,356       4,279        1,360         13,405
Net Income (Loss)                                        3,546          301        3,673       4,371      11,891             4,139          5,439       5,188      (31,764)       (16,998)
* Includes excise taxes on petroleum products sales:      3,841        4,069        3,954       4,073       15,937               3,857       4,091       4,022        3,448         15,418


Net income (loss) per share of common stock (dollars)
 Basic                                                    2.15          0.18         2.26        2.75        7.32                2.65         3.54        3.43      (21.37)        (11.16)
 Diluted                                                  2.12          0.18         2.23        2.71        7.22                2.62         3.50        3.39      (21.37)        (11.16)

Average common shares outstanding (in thousands)
 Basic                                         1,647,352           1,635,848    1,622,456   1,590,957   1,623,994        1,562,198       1,534,975   1,510,897   1,486,204     1,523,432
 Diluted                                       1,668,847           1,657,999    1,644,267   1,612,179   1,645,919        1,582,025       1,555,447   1,528,187   1,486,204     1,523,432


                                                                  SUMMARY OF INCOME (LOSS) BY SEGMENT

                                                                                                           Millions of Dollars
                                                                                 2007                                                                 2008
                                                        1st Qtr      2nd Qtr      3rd Qtr     4th Qtr        YTD            1st Qtr        2nd Qtr     3rd Qtr     4th Qtr           YTD

Net Income (Loss)
U.S. E&P                                                   916         1,055       1,225       1,052       4,248             1,349          1,852       1,606          181          4,988
International E&P                                        1,413        (3,459)        857       1,556         367             1,538          2,147       2,322          969          6,976
Goodwill Recoverability Impairment                           -             -           -           -           -                 -              -           -      (25,443)       (25,443)
Total E&P                                                2,329        (2,404)      2,082       2,608       4,615             2,887          3,999       3,928      (24,293)       (13,479)

Midstream                                                   85          102          104         162         453                 137          162         173           69           541

U.S. R&M                                                   896        1,879          873         967       4,615                 435          587         524          (6)         1,540
International R&M                                          240          479          434         155       1,308                  85           77         325         295            782
Total R&M                                                1,136        2,358        1,307       1,122       5,923                 520          664         849         289          2,322

LUKOIL Investment                                         256           526          387         649       1,818                 710          774         438       (7,410)        (5,488)

Chemicals                                                   82           68          110          99         359                   52          18          46           (6)          110

Emerging Businesses                                         (1)          (12)          3           2           (8)                 12           8          35          (25)            30

Corporate and Other                                       (341)        (337)        (320)       (271)      (1,269)               (179)       (186)       (281)       (388)         (1,034)

Consolidated                                             3,546          301        3,673       4,371      11,891             4,139          5,439       5,188      (31,764)       (16,998)


                                                                                                                                                                              Page 1 of 12
SUMMARY OF INCOME (LOSS) BY SEGMENT (continued)


                                                                                                                          Millions of Dollars
                                                                                                    2007                                                           2008
                                                                         1st Qtr       2nd Qtr       3rd Qtr   4th Qtr      YTD            1st Qtr      2nd Qtr     3rd Qtr   4th Qtr           YTD
Income (Loss) Before Income Taxes
U.S. E&P                                                                  1,425          1,627        1,867    1,560      6,479             2,094        2,848       2,518        145          7,605
International E&P                                                         2,894         (1,976)       2,357    3,464      6,739             3,822        5,211       5,134      2,430         16,597
Goodwill Recoverability Impairment                                            -              -            -        -          -                 -            -           -    (25,443)       (25,443)
Total E&P                                                                 4,319           (349)       4,224    5,024     13,218             5,916        8,059       7,652    (22,868)        (1,241)

Midstream                                                                   132           156          157       245        690                 206        243        260         93            802

U.S. R&M                                                                  1,400         2,891         1,369    1,526      7,186                 717        938         852       (33)         2,474
International R&M                                                           218           633           403      167      1,421                 101         32         442       421            996
Total R&M                                                                 1,618         3,524         1,772    1,693      8,607                 818        970       1,294       388          3,470

LUKOIL Investment                                                           262           542          396       663      1,863                 729        795        451      (7,414)        (5,439)

Chemicals                                                                   107            80          140        20        347                  54           -         64          7           125

Emerging Businesses                                                           (3)          (20)         (17)       (2)       (42)                15         17          45        (53)           24

Corporate and Other                                                        (369)         (415)         (308)     (319)    (1,411)               (189)     (289)       (299)     (557)         (1,334)

Consolidated                                                              6,066         3,518         6,364    7,324     23,272             7,549        9,795       9,467    (30,404)        (3,593)


Effective Tax Rates
U.S. E&P                                                                  35.7%          35.2%        34.4%    32.6%      34.4%             35.6%        35.0%       36.2%     -24.8%          34.4%
International E&P                                                         51.2%              -        63.6%    55.1%      94.6%             59.8%        58.8%       54.8%      60.1%          58.0%
Total E&P                                                                 46.1%        -588.8%        50.7%    48.1%      65.1%             51.2%        50.4%       48.7%      -6.2%        -986.1%

Midstream                                                                 35.6%         34.6%         33.8%    33.9%      34.3%             33.5%        33.3%       33.5%     25.8%          32.5%

U.S. R&M                                                                  36.0%         35.0%         36.2%    36.6%      35.8%             39.3%         37.4%      38.5%     81.8%          37.8%
International R&M                                                        -10.1%         24.3%         -7.7%     7.2%       8.0%             15.8%       -140.6%      26.5%     29.9%          21.5%
Total R&M                                                                 29.8%         33.1%         26.2%    33.7%      31.2%             36.4%         31.5%      34.4%     25.5%          33.1%

LUKOIL Investment                                                          2.3%          3.0%          2.3%      2.1%       2.4%                2.6%      2.6%        2.9%       0.1%          -0.9%

Chemicals                                                                 23.4%         15.0%         21.4%         -      -3.5%                3.7%          -      28.1%    185.7%          12.0%

Emerging Businesses                                                       66.7%         40.0%             -         -     81.0%             20.0%        52.9%       22.2%     52.8%          -25.0%

Corporate and Other                                                        7.6%         18.8%         -3.9%    15.0%      10.1%                 5.3%     35.6%        6.0%     30.3%          22.5%

Consolidated                                                              41.5%         91.4%         42.3%    40.3%      48.9%             45.2%        44.4%       45.2%      -4.5%        -373.1%


                                                                                                  ESTIMATED TAXES PAID


                                                                                                                          Millions of Dollars
                                                                                                    2007                                                           2008
                                                                         1st Qtr       2nd Qtr       3rd Qtr   4th Qtr       YTD           1st Qtr      2nd Qtr     3rd Qtr   4th Qtr            YTD
Cash income taxes paid                                                    1,199          4,326        2,444     3,361     11,330            1,649         4,756      3,845     2,872          13,122
Taxes other than income taxes                                             4,374          4,697        4,583     5,336     18,990            5,155         5,796      5,619     4,067          20,637
Less: Excise taxes*                                                      (3,841)        (4,069)      (3,954)   (4,073)   (15,937)          (3,857)       (4,091)    (4,022)   (3,448)        (15,418)
Estimated Taxes Paid                                                      1,732          4,954        3,073     4,624     14,383            2,947         6,461      5,442     3,491          18,341
* Represents taxes collected by ConocoPhillips and reimbursed to taxing authorities.


                                                                                                                                                                                         Page 2 of 12
CERTAIN ITEMS INCLUDED IN NET INCOME (AFTER-TAX)

                                                                                           Millions of Dollars
                                                                      2007                                                        2008
                                                  1st Qtr   2nd Qtr    3rd Qtr   4th Qtr     YTD            1st Qtr     2nd Qtr    3rd Qtr   4th Qtr           YTD
U.S. E&P
Gain on asset sales                                  36         11          -        25       72                   4        12          -        11             27
FERC Rulings                                          -          -         94         -       94                   -         -          -         -              -
Impairments                                           -          -          -       (45)     (45)                  -         -          -      (403)          (403)
Business interruption insurance claims recovery       -          -          -        13       13                   -         -          -         -              -
Severance accrual                                     -          -          -         -        -                   -         -          -       (43)           (43)
 Total                                               36         11         94        (7)     134                   4        12          -      (435)          (419)

International E&P
Gain (loss) on asset sales                          407        (82)      164       147        636                  8         -       138        417            563
International tax law changes                        38          -         -       171        209                  -         -         -          -              -
Impairment - expropriated assets                      -     (4,512)        -         -     (4,512)                 -         -         -          -              -
Impairments                                         (88)       (33)      (32)      (75)      (228)                 -         -       (28)      (196)          (224)
Pending claims and settlements                        -          -         -        28         28                  -         -         -          -              -
Severance accrual                                     -          -         -         -          -                  -         -         -        (28)           (28)
  Total                                             357     (4,627)      132       271     (3,867)                 8         -       110        193            311

Goodwill recoverability impairment                     -         -          -         -         -                  -         -          -    (25,443)       (25,443)

Total E&P                                           393     (4,616)      226       264     (3,733)                12        12       110     (25,685)       (25,551)

Midstream

 Total                                                 -         -          -         -         -                  -         -          -          -              -

U.S. R&M
Gain (loss) on asset sales                             -         -          2       14         16                116         8          2        (5)           121
Impairments                                          (13)        -          3       (2)       (12)                (3)      (10)         -      (357)          (370)
Business interruption insurance claims recovery        -         -          -       10         10                  -         -          -         -              -
Severance accrual                                      -         -          -        -          -                  -         -          -       (23)           (23)
 Total                                               (13)        -          5       22         14                113        (2)         2      (385)          (272)

International R&M
Gain on asset sales                                   -        163       158         2       323                   -         1          -       102            103
Impairments                                         148         (5)      (30)       11       124                   -         -          -      (180)          (180)
Germany tax rate change                               -          -       141         -       141                   -         -          -         -              -
Severance accrual                                     -          -         -         -         -                   -         -          -        (1)            (1)
 Total                                              148        158       269        13       588                   -         1          -       (79)           (78)

Total R&M                                           135        158       274        35       602                 113        (1)         2      (464)          (350)

LUKOIL Investment
Impairment                                             -         -          -         -         -                  -         -          -     (7,410)        (7,410)
 Total                                                 -         -          -         -         -                  -         -          -     (7,410)        (7,410)

Chemicals
Asset retirements recorded by CPChem                   -       (21)         -        -        (21)                 -         -          -          -              -
Tax benefit on capital loss                            -         -          -       65         65                  -         -          -          -              -
 Total                                                 -       (21)         -       65         44                  -         -          -          -              -

Emerging Businesses
Impairments                                            -         -          -         -         -                  -         -          -        (85)           (85)
 Total                                                 -         -          -         -         -                  -         -          -        (85)           (85)

Corporate and Other
Acquisition-related expenses                         (13)      (16)       (11)      (4)       (44)                 -         -          -          -              -
FERC Rulings                                           -         -        (14)       -        (14)                 -         -          -          -              -
Premium on early debt retirement                     (14)        -          -        -        (14)                 -         -          -          -              -
Pending claims and settlements                         -         -          -        -          -                 35         -          -          -             35
Canada tax law change                                  -         -          -       15         15                  -         -          -          -              -
Impairments                                            -         -          -        -          -                  -         -          -        (30)           (30)
Severance accrual                                      -         -          -        -          -                  -         -          -         (4)            (4)
 Total                                               (27)      (16)       (25)      11        (57)                35         -          -        (34)             1

Total Company                                       501     (4,495)      475       375     (3,144)               160        11       112     (33,678)       (33,395)


                                                                                                                                                        Page 3 of 12
CASH FLOW INFORMATION

                                                                                             Millions of Dollars
                                                                       2007                                                         2008
                                                   1st Qtr   2nd Qtr    3rd Qtr   4th Qtr      YTD            1st Qtr     2nd Qtr    3rd Qtr   4th Qtr           YTD

Cash Flows from Operating Activities
 Net income (loss)                                 3,546        301      3,673    4,371     11,891             4,139       5,439      5,188    (31,764)       (16,998)
 Depreciation, depletion and amortization          2,024      2,016      2,052    2,206      8,298             2,209       2,178      2,361      2,264          9,012
 Impairments                                          (1)     4,686        188      157      5,030                 6          19         57     34,457         34,539
 Dry hole costs and leasehold impairments            148        133         74      108        463               154         127        118        299            698
 Accretion on discounted liabilities                  79         81         81      100        341               104          96        114        104            418
 Deferred income taxes                                77        103       (125)     (88)       (33)              (17)         28         48       (487)          (428)
 Undistributed equity earnings                      (557)      (678)      (237)    (351)    (1,823)             (987)     (1,001)      (542)       921         (1,609)
 Net gain on asset dispositions                     (499)      (428)      (389)     (32)    (1,348)             (181)        (32)      (133)      (545)          (891)
 Other                                               (94)       182        (60)     148        176              (164)         83        (53)      (930)        (1,064)
 Net working capital changes                       2,150     (1,630)       734      301      1,555             1,324      (1,503)       357     (1,197)        (1,019)
Net Cash Provided by
 Operating Activities                              6,873      4,766      5,991    6,920     24,550             6,587       5,434      7,515     3,122         22,658

Cash Flows from Investing Activities
 Capital expenditures & investments                (2,847)   (2,500)    (2,560)   (3,884)   (11,791)          (3,322)     (3,398)    (3,815)    (8,564)       (19,099)
 Proceeds from asset dispositions                   1,343       872        842       515      3,572              370          71        288        911          1,640
 Long-term advances to/collections from
  affiliates and other investments                   (144)      (97)      (118)       16       (343)             (60)        (83)      (209)       195           (157)
Net Cash Used for Investing Activities             (1,648)   (1,725)    (1,836)   (3,353)    (8,562)          (3,012)     (3,410)    (3,736)    (7,458)       (17,616)

Cash Flows from Financing Activities
 Net issuance (repayment) of debt                  (3,491)     (865)      (961)     (202)    (5,519)            (202)        426        183     5,353           5,760
 Issuance of stock                                     40       141         70        34        285                7         178         (3)       16             198
 Repurchase of stock                               (1,000)   (1,000)    (2,501)   (2,500)    (7,001)          (2,496)     (2,512)    (2,492)     (749)         (8,249)
 Dividends                                           (674)     (668)      (667)     (652)    (2,661)            (730)       (719)      (710)     (695)         (2,854)
 Other                                                (49)     (104)      (136)     (155)      (444)            (196)        (44)      (186)     (193)           (619)
Net Cash Provided by (Used for)
 Financing Activities                              (5,174)   (2,496)    (4,195)   (3,475)   (15,340)          (3,617)     (2,671)    (3,208)    3,732          (5,764)

Effect of Exchange Rate Changes                        (8)        6          8       (15)        (9)                9         11       (242)      243             21

Net Change in Cash
 and Cash Equivalents                                 43        551        (32)      77        639                 (33)     (636)      329       (361)          (701)
Cash and cash equivalents
 at beginning of period                              817        860      1,411    1,379        817             1,456       1,423       787      1,116          1,456
Cash and Cash Equivalents
 at End of Period                                    860      1,411      1,379    1,456      1,456             1,423         787      1,116       755            755


                                                                                             Millions of Dollars
                                                                       2007                                                         2008
Capital Program                                    1st Qtr   2nd Qtr    3rd Qtr   4th Qtr      YTD            1st Qtr     2nd Qtr    3rd Qtr   4th Qtr           YTD
E&P
 Capital expenditures and investments              2,570      2,148      2,177    3,040      9,935             2,818       2,806      3,079     7,753         16,456
 Loans and advances                                  157        111        122      238        628                67          85         26       (18)           160
 Joint venture acquisition obligation--principal       -        140        142      143        425               145         148        149       151            593
   E&P total                                       2,727      2,399      2,441    3,421     10,988             3,030       3,039      3,254     7,886         17,209
Midstream*                                             -          2          -        3          5                 -           -          -         4              4
R&M
 Capital expenditures and investments                205        271        276      634      1,386               363         510        674       722          2,269
 Loans and advances                                   17         37          -        -         54                 -           2          1         -              3
   R&M total                                         222        308        276      634      1,440               363         512        675       722          2,272
LUKOIL Investment*                                     -          -          -        -          -                 -           -          -         -              -
Chemicals*                                             -          -          -        -          -                 -           -          -         -              -
Emerging Businesses*                                  31         34         62      130        257                61          51         25        19            156
Corporate and Other*                                  41         45         45       77        208                80          31         37        66            214
Total Capital Program                              3,021      2,788      2,824    4,265     12,898             3,534       3,633      3,991     8,697         19,855
* Capital expenditures and investments only.


                                                                                                                                                          Page 4 of 12
TOTAL E&P

                                                                  2007                                             2008
                                              1st Qtr   2nd Qtr    3rd Qtr   4th Qtr    YTD    1st Qtr   2nd Qtr    3rd Qtr   4th Qtr           YTD

E&P Net Income (Loss) ($ Millions)            2,329     (2,404)     2,082    2,608     4,615   2,887      3,999      3,928    (24,293)       (13,479)

Production
Total, Including Equity Affiliates
 and Canadian Syncrude (MBOE/D)               2,020      1,910      1,759    1,835     1,880   1,794      1,750      1,748     1,867          1,789
E&P segment plus LUKOIL Investment segment:    2,465     2,383      2,191     2,261    2,324    2,253     2,198      2,170      2,318          2,234

Crude Oil and Condensate (MB/D)
 Consolidated                                   840        760       730       752      770      758        731       718        803            752
 Equity affiliates                              120        128        44        43       84       45         41        63         67             54
  Total                                         960        888       774       795      854      803        772       781        870            806
Sales of crude oil produced (MB/D)              949        876       803       792      854      773        803       776        853            801

Natural Gas Liquids (MB/D)                      150        145       139       187      155      154        156       148        155            153

Natural Gas (MMCF/D)
 Consolidated                                 5,313      5,124      4,916    4,981     5,082   4,900      4,818      4,769     4,854          4,836
 Equity affiliates                                9          9          -        -         5       -          -          -        45             11
  Total                                       5,322      5,133      4,916    4,981     5,087   4,900      4,818      4,769     4,899          4,847

Canadian Syncrude (MB/D)                         23         21         27       23       23       20         19         24        25             22

Industry Prices (Platt's)
Crude Oil ($/bbl)
 WTI spot                                     57.99      64.89      75.48    90.66     72.25   97.94     123.98     117.83     58.49          99.56
 Brent dated                                  57.76      68.76      74.87    88.69     72.52   96.90     121.38     114.78     54.91          96.99
Natural Gas ($/mmbtu)
 Henry Hub -- First of Month                    6.77      7.55       6.16      6.97     6.86     8.03     10.94      10.25       6.95           9.04

Average Realized Prices
Crude Oil and Condensate ($/bbl)
 Consolidated                                 55.17      64.55      73.01    86.28     69.47   94.71     119.24     114.20     55.11          95.15
 Equity affiliates                            40.02      47.74      44.60    52.45     45.31   62.78      93.20      88.32     25.35          63.89
 Total                                        53.38      61.97      71.34    84.53     67.11   92.88     118.01     112.19     52.82          93.12

Natural Gas Liquids ($/bbl)                   38.56      44.80      48.09    54.82     47.13   60.14      68.42      68.81     32.57          57.43

Natural Gas ($/mcf)
 Consolidated                                   6.36      6.45       5.56      6.66     6.26     8.03      9.87       8.91       6.37           8.28
 Equity affiliates                              0.29      0.30          -         -     0.30        -         -          -       2.04           2.04
 Total                                          6.35      6.44       5.56      6.66     6.26     8.03      9.87       8.91       6.32           8.27

Exploration Charges ($ Millions)
 Dry Holes                                       62         74        23        50       209      94         68        58        205            425
 Lease Impairments                               86         59        51        58       254      60         59        60         94            273
  Total Non-Cash Charges                        148        133        74       108       463     154        127       118        299            698
 Other (G&G and Lease Rentals)                  114        126       144       160       544     155        161       149        174            639
Total Exploration Charges                       262        259       218       268     1,007     309        288       267        473          1,337

Depreciation, Depletion and
 Amortization (DD&A) ($ Millions)             1,802      1,790      1,828    1,971     7,391   1,946      1,940      2,123     2,019          8,028

Foreign Currency Gains
 (Losses) After-Tax ($ Millions)                 17        152         13       34      216       (10)        2       118        106            216


                                                                                                                                         Page 5 of 12
U.S. E&P

                                                                                                          2007                                                                                       2008
                                                                          1st Qtr         2nd Qtr          3rd Qtr           4th Qtr              YTD               1st Qtr          2nd Qtr          3rd Qtr       4th Qtr          YTD

U.S. E&P Net Income (Loss) ($ Millions)                                      916            1,055            1,225             1,052            4,248                 1,349            1,852            1,606         181          4,988

Alaska ($ Millions)                                                          507              535               765              448            2,255                   603              700              556          456         2,315
Lower 48 ($ Millions)                                                        409              520               460              604            1,993                   746            1,152            1,050         (275)        2,673

Production
Total U.S. (MBOE/D)                                                          855              848               821              847              843                   783              787               736        790            775

Crude Oil and Condensate (MB/D)
 Alaska                                                                      276              267               241              257              261                   254              244               218        258            244
 Lower 48                                                                    104              105               103               98              102                    97               95                85         88             91
  Total                                                                      380              372               344              355              363                   351              339               303        346            335
Sales of crude oil produced (MB/D)                                           372              370               380              340              365                   344              353               299        340            334

Natural Gas Liquids (MB/D)*
 Alaska                                                                        22               18               15               19                19                   19                17               13         20             17
 Lower 48**                                                                    68               71               73              106                79                   69                76               74         75             74
  Total                                                                        90               89               88              125                98                   88                93               87         95             91
                                                                               16               15               11               13                14                   13                11                8         11             11
*Includes reinjection volumes sold lease-to-lease:


Natural Gas (MMCF/D)
 Alaska                                                                      122              100              116               102              110                   100               98              102          88             97
 Lower 48                                                                  2,190            2,219            2,219             2,101            2,182                 1,963            2,034            1,971       2,007          1,994
  Total                                                                    2,312            2,319            2,335             2,203            2,292                 2,063            2,132            2,073       2,095          2,091

Average Realized Prices
Crude Oil and Condensate ($/bbl)
 Alaska
  North Slope                                                              48.83            56.31            66.54             81.17            62.91                 89.07          112.23            115.11       57.63          92.73
  West Coast                                                               55.50            63.26            73.57             87.88            69.75                 95.47          118.88            121.51       64.13          99.23
 Lower 48                                                                  49.32            58.50            67.77             78.98            63.49                 90.35          118.06            112.36       49.36          92.77
 Total U.S.                                                                53.78            61.91            72.00             85.31            68.00                 94.02          118.66            118.90       60.32          97.47

Natural Gas Liquids ($/bbl)
 Alaska                                                                    55.27            63.52            73.40             88.12            71.85                 94.27          117.24            119.29       64.23          94.29
 Lower 48***                                                               36.46            43.29            46.37             48.88            44.43                 55.33           62.27             65.11       26.70          52.28
 Total U.S.                                                                37.86            44.17            47.73             51.23            46.00                 58.33           65.96             68.84       30.61          55.63

Natural Gas ($/mcf)
 Alaska                                                                     4.19              4.04             2.15             4.12              3.68                 4.31             3.81              4.36        4.90           4.38
 Lower 48                                                                   6.21              6.51             5.38             5.88              5.99                 7.67             9.74              8.67        4.76           7.71
 Total U.S.                                                                 6.19              6.49             5.36             5.86              5.98                 7.63             9.69              8.64        4.76           7.67

Kenai, Alaska LNG Sales
 Volume (MMCF/D)                                                            104                 72               88               78                85                   63               72                89          74             74
 Sales price per MCF                                                        5.83              5.86             6.01             7.28              6.21                 6.72             7.15              7.77        8.65           7.62

U.S. Exploration Charges ($ Millions)
 Dry Holes                                                                     13              36                19               14               82                    25               20                 6        137            188
 Lease Impairments                                                             43              43                43               40              169                    42               40                43         65            190
  Total Non-Cash Charges                                                       56              79                62               54              251                    67               60                49        202            378
 Other (G&G and Lease Rentals)                                                 26              40                57               50              173                    39               50                42         61            192
Total U.S. Exploration Charges                                                 82             119               119              104              424                   106              110                91        263            570
Alaska Only                                                                    17              32                31               26              106                    11               25                19         45            100

DD&A ($ Millions)
  Alaska                                                                     168              167               165              167              667                   149              163               152        186            650
  Lower 48                                                                   618              661               667              642            2,588                   616              613               649        577          2,455
   Total U.S.                                                                786              828               832              809            3,255                   765              776               801        763          3,105
**Fourth quarter of 2007 includes 22 MBD related to out-of-period adjustments for the first three quarters in 2007. The amounts attributable to Q1, Q2, and Q3 2007 were 5, 8, and 9 MBD, respectively. Fourth-
 quarter 2007 NGL production in L48 was 84 MBD excluding the adjustments.
***Fourth quarter of 2007 includes $6.36/bbl related to out-of-period adjustments for the first three quarters in 2007. The amounts attributable to Q1, Q2, and Q3 2007 were $1.64/bbl, $2.23/bbl, and $2.49/bbl,
  respectively. Fourth-quarter 2007 NGL realized price in L48 was $55.24/bbl excluding the adjustments.


                                                                                                                                                                                                                              Page 6 of 12
INTERNATIONAL E&P

                                                            2007                                             2008
                                       1st Qtr   2nd Qtr     3rd Qtr   4th Qtr    YTD    1st Qtr   2nd Qtr    3rd Qtr   4th Qtr          YTD
International E&P
 Net Income (Loss) ($ Millions)        1,413     (3,459)       857     1,556      367    1,538      2,147      2,322      969          6,976

Production
Total, Including Equity Affiliates
 and Canadian Syncrude (MBOE/D)        1,165      1,062        938       988     1,037   1,011        963      1,012    1,077          1,014

Crude Oil and Condensate (MB/D)
 Consolidated
  Norway                                 179        145        166       158      162      153        145       164       163            156
  United Kingdom                          55         48         37        50       48       48         49        57        78             58
  Canada                                  21         19         17        21       19       23         24        25        27             25
  China                                   38         32         29        25       31       33         32        31        36             33
  Indonesia                               13         13         11        11       12       16         15        15        15             15
  Vietnam                                 23         22         22        22       22       20         18        19        28             21
  Timor Sea                               24         26         21        19       22       23         21        22        20             22
  Libya                                   45         47         48        47       47       47         48        42        50             47
  Other                                   62         36         35        44       44       44         40        40        40             40
 Equity affiliates
  Canada                                  23         28         29        27       27       29         25        32        35             30
  Russia                                  15         15         15        16       15       16         16        31        32             24
  Venezuela                               82         85          -         -       42        -          -         -         -              -
 Total                                   580        516        430       440      491      452        433       478       524            471
Sales of crude oil produced (MB/D)       577        506        423       452      489      429        450       477       513            467

Natural Gas Liquids (MB/D)
 Norway                                    8          5           7       12        8       13         11          9       11             11
 United Kingdom                            6          6           4        8        6       10          8          6        8              8
 Canada                                   31         28          26       25       27       26         25         24       24             25
 Timor Sea                                12         14          11       12       12       15         14         15       13             14
 Other                                     3          3           3        5        4        2          5          7        4              4
 Total                                    60         56          51       62       57       66         63         61       60             62

Natural Gas (MMCF/D)
 Consolidated
  Norway                                 247        202         226      270       236     273        205        222      257            239
  United Kingdom                         785        668         519      723       673     695        623        581      757            664
  Canada                               1,152      1,133       1,069    1,073     1,106   1,101      1,055      1,061    1,001          1,054
  China                                   11         12          13        8        11      10          9          -        -              5
  Timor Sea                              243        250         194      207       223     246        231        266      236            245
  Indonesia                              331        329         349      310       330     314        360        361      336            343
  Vietnam                                 15         12          19       14        15      16         16         21       11             16
  Libya                                    5          9           9        9         8       9          9          6        9              8
  Other                                  212        190         183      164       188     173        178        178      152            171
 Equity affiliates
  Australia                                -          -           -        -         -       -          -          -       45             11
  Canada                                   -          -           -        -         -       -          -          -        -              -
  Russia                                   -          -           -        -         -       -          -          -        -              -
  Venezuela                                9          9           -        -         5       -          -          -        -              -
  Total                                3,010      2,814       2,581    2,778     2,795   2,837      2,686      2,696    2,804          2,756

Canadian Syncrude (MB/D)                  23         21          27       23       23       20         19         24       25             22

Darwin, Australia LNG Sales (MMCF/D)     388        449        347       348      383      417        396       464       460            434


                                                                                                                                  Page 7 of 12
INTERNATIONAL E&P (continued)

                                                                     2007                                             2008
                                                 1st Qtr   2nd Qtr    3rd Qtr   4th Qtr    YTD    1st Qtr   2nd Qtr    3rd Qtr   4th Qtr          YTD

Average Realized Prices
Crude Oil and Condensate ($/bbl)
 Consolidated
  Norway                                         57.36      67.50      75.54    88.75     72.04   97.27     122.34     115.67    55.95          97.54
  United Kingdom                                 55.52      66.99      72.98    86.26     71.01   93.96     118.79     107.54    51.14          90.67
  Canada                                         48.70      58.42      67.75    73.08     61.77   84.49     108.43      99.77    34.36          80.18
  China                                          54.93      66.39      71.79    85.51     67.69   93.69     120.63     111.93    46.41          91.51
  Indonesia                                      54.66      65.46      72.46    89.26     69.99   92.48     109.83     108.47    53.08          90.98
  Vietnam                                        57.88      67.03      75.14    89.64     72.54   98.31     126.11     122.45    54.02          96.57
  Timor Sea                                      59.15      73.51      71.20    83.95     71.50   93.85     114.20     103.11    38.05          86.91
  Libya                                          56.19      67.39      73.88    88.11     72.02   95.21     120.86     108.33    53.48          93.22
  Other                                          55.73      67.71      74.48    87.54     69.76   97.56     119.35     103.59    49.23          92.82
 Equity affiliates
  Canada                                         32.46      32.46      38.48    46.90     37.94   57.95      96.78      81.32     9.53          58.54
  Russia                                         37.92      50.25      55.84    63.05     52.29   70.41      86.00      96.67    42.95          71.15
  Venezuela                                      42.54      51.54        -        -       47.46     -          -          -        -              -
 Total                                           53.12      62.02      70.75    83.94     66.44   91.96     117.49     107.99    47.84          90.01

Natural Gas Liquids ($/bbl)
 Norway                                          38.82      45.72      46.77    56.25     48.36   54.48      59.19      56.67    39.00          53.04
 United Kingdom                                  34.93      39.34      36.91    52.79     41.78   55.88      66.90      60.43    28.48          53.65
 Canada                                          41.15      46.82      51.77    66.27     50.85   68.84      83.57      77.49    35.19          66.40
 Timor Sea                                       44.13      49.43      48.71    72.60     52.63   69.79      74.03      73.79    41.61          64.54
 Other                                            8.32      29.42      34.00    42.30     31.17   13.83      43.22      49.69    21.19          35.91
 Total                                           39.38      45.64      48.63    61.56     48.80   62.20      71.40      68.78    35.25          59.70

Natural Gas ($/mcf)
 Consolidated
  Norway                                           7.00      7.10       7.51      9.08     7.74   10.27      11.75      12.79    10.70          11.28
  United Kingdom                                   8.14      7.23       6.69      9.19     7.92    9.20      10.48      10.20    11.07          10.26
  Canada                                           6.38      6.60       5.13      6.20     6.09    7.81      10.19       8.03     5.56           7.92
  China                                            2.64      2.74       2.78      3.37     2.85    3.60       3.69        -        -             3.64
  Timor Sea                                        0.76      0.68       0.66      0.74     0.71    0.79       0.90       0.97     1.17           0.96
  Indonesia                                        6.04      6.99       7.78      8.51     7.31   10.33      12.14      12.35     6.17          10.36
  Vietnam                                          1.10      1.09       1.12      1.13     1.11    1.14       1.12       1.13     1.16           1.13
  Libya                                            0.07      0.09       0.09      0.09     0.09    0.09       0.09       0.09     0.09           0.09
  Other                                            2.71      2.53       2.41      3.43     2.75    3.79       3.99       3.91     4.44           4.09
 Equity affiliates
  Australia                                         -         -          -         -        -        -         -          -        2.04           2.04
  Canada                                            -         -          -         -        -        -         -          -         -              -
  Russia                                            -         -          -         -        -        -         -          -         -              -
  Venezuela                                        0.29      0.30        -         -       0.30      -         -          -         -              -
 Total                                             6.47      6.40       5.75      7.31     6.50     8.32     10.02       9.13      7.55           8.73

International Exploration Charges ($ Millions)
 Dry Holes                                          49         38          4       36      127       69         48        52        68            237
 Lease Impairments                                  43         16          8       18       85       18         19        17        29             83
   Total Non-Cash Charges                           92         54         12       54      212       87         67        69        97            320
 Other (G&G and Lease Rentals)                      88         86         87      110      371      116        111       107       113            447
Total International Exploration Charges            180        140         99      164      583      203        178       176       210            767

DD&A ($ Millions)                                1,016        962       996     1,162     4,136   1,181      1,164      1,322    1,256          4,923


                                                                                                                                           Page 8 of 12
R&M

                                                                                                          2007                                                                                      2008
                                                                          1st Qtr         2nd Qtr          3rd Qtr           4th Qtr              YTD               1st Qtr         2nd Qtr          3rd Qtr          4th Qtr          YTD

R&M Net Income (Loss) ($ Millions)                                         1,136            2,358            1,307            1,122             5,923                  520               664              849           289          2,322

United States ($ Millions)                                                   896            1,879               873              967            4,615                  435               587              524            (6)         1,540
International ($ Millions)                                                   240              479               434              155            1,308                   85                77              325           295            782

Market Indicators
U.S. East Coast Crack Spread ($/bbl)                                       11.81            22.57            11.73             8.47             13.64                 7.79            10.93            10.43           5.66           8.70
U.S. Gulf Coast Crack Spread ($/bbl)                                       10.06            24.28            11.74             6.55             13.16                 7.90            12.11            14.70           2.80           9.38
U.S. Group Central Crack Spread ($/bbl)                                    14.84            31.26            20.92             9.37             19.10                10.26            13.47            14.38           6.00          11.03
U.S. West Coast Crack Spread ($/bbl)                                       28.68            34.32            16.22            16.58             23.95                15.37            21.91            16.34          11.46          16.27
U.S. Weighted 3:2:1 Crack Spread ($/bbl)                                   15.30            27.56            14.74             9.65             16.81                 9.94            14.19            14.07           5.89          11.02
NW Europe Crack Spread ($/bbl)                                             12.06            15.56            13.37            15.55             14.14                16.09            25.78            21.10          17.58          20.14
Singapore 3:1:2 Crack Spread ($/bbl)                                       14.06            17.94            14.80            17.13             15.98                19.90            29.35            19.10          13.01          20.34
U.S. Wholesale Gasoline Mktg Mrgn ($/bbl)                                   1.15             2.09             0.65            (0.43)             0.87                 1.07             0.37             4.53           5.54           2.88

Realized Margins
Refining Margin ($/bbl)
 U.S.                                                                      11.87            19.59            10.86            11.56             13.41                  8.00           10.29             9.03            6.96           8.57
 International                                                              5.06             9.68             6.05             6.72              6.92                  6.42            6.70            11.24            8.31           8.07
Marketing Margin ($/bbl)*
 U.S.                                                                       1.31              2.36             2.20             1.43             1.83                  1.18             1.23             3.56           3.73           2.42
 International                                                              7.08              7.68             9.49             7.69             7.92                  7.74             9.05             9.90           8.84           8.89

DD&A ($ Millions)                                                            191              196               194              203              784                  208               206              211           214            839

Foreign Currency Gains
 (Losses) After-Tax ($ Millions)                                              -                  (2)            -                (11)             (13)                   38              (13)            (127)           (71)         (173)

Turnaround Expense ($ Millions)                                                75               58               27               80              240                    90              170               73            70            403

Eastern U.S.
Crude Oil Charge Input (MB/D)                                                411              404               383              412              402                  340               405              412           390            387
Total Charge Input (MB/D)                                                    460              447               414              453              443                  400               441              450           445            434
Crude Oil Capacity Utilization (%)                                           97%              96%               91%              97%              95%                  80%               96%              97%           92%            91%
Clean Product Yield (%)                                                      89%              86%               86%              90%              88%                  89%               87%              86%           90%            88%

U.S. Gulf Coast
Crude Oil Charge Input (MB/D)                                                744              709              736               712              726                  659               720              572           686            659
Total Charge Input (MB/D)                                                    823              790              829               794              810                  732               810              641           773            739
Crude Oil Capacity Utilization (%)                                          102%              97%             100%               97%              99%                  90%               98%              78%           94%            90%
Clean Product Yield (%)                                                      81%              81%              80%               82%              81%                  81%               76%              77%           82%            79%

Western U.S.
Crude Oil Charge Input (MB/D)                                                333              388              415               395              383                  405               343             417            407            393
Total Charge Input (MB/D)                                                    375              420              445               433              418                  425               396             439            431            422
Crude Oil Capacity Utilization (%)                                           81%              94%             100%               95%              92%                  97%               82%            100%            98%            94%
Clean Product Yield (%)                                                      79%              79%              80%               80%              80%                  80%               78%             82%            82%            81%

Central U.S. - Consolidated
Crude Oil Charge Input (MB/D)                                                185              170               166              175              174                  177               182              184           163            177
Total Charge Input (MB/D)                                                    188              175               170              179              178                  179               184              187           166            179
Crude Oil Capacity Utilization (%)                                           99%              91%               89%              94%              93%                  95%               97%              98%           87%            94%
Clean Product Yield (%)                                                      88%              93%               88%              92%              90%                  88%               89%              93%           91%            90%

Central U.S. - Equity Affiliates - Net Share**
Crude Oil Charge Input (MB/D)                                                265              225              280               267              259                  225               241              228           239            233
Total Charge Input (MB/D)                                                    288              250              301               288              282                  241               258              246           253            250
Crude Oil Capacity Utilization (%)                                           96%              81%             101%               96%              94%                  91%               97%              92%           96%            94%
Clean Product Yield (%)                                                      82%              85%              83%               84%              84%                  84%               84%              85%           84%            84%

TOTAL UNITED STATES
Crude Oil Charge Input (MB/D)                                              1,938            1,896            1,980            1,961             1,944                1,806            1,891            1,813          1,885          1,849
Total Charge Input (MB/D)                                                  2,134            2,082            2,159            2,147             2,131                1,977            2,089            1,963          2,068          2,024
Crude Oil Capacity Utilization (%)                                           95%              93%              97%              96%               96%                  90%              94%              90%            94%            92%
Clean Product Yield (%)                                                      83%              83%              82%              84%               83%                  83%              81%              83%            85%            83%

Refined Products Production (MB/D)
Gasoline                                                                     962              957              959              978               964                  892              876              852            929            887
Distillates                                                                  762              736              779              795               768                  719              775              743            791            757
Other                                                                        428              394              439              392               414                  380              444              380            359            391
 Total                                                                     2,152            2,087            2,177            2,165             2,146                1,991            2,095            1,975          2,079          2,035

Petroleum Products Sales (MB/D)
Gasoline                                                                   1,258            1,300            1,212            1,207             1,244                1,070            1,127            1,089          1,227          1,128
Distillates                                                                  862              827              869              929               872                  869              912              858            934            893
Other                                                                        480              503              439              309               432                  384              404              365            342            374
 Total                                                                     2,600            2,630            2,520            2,445             2,548                2,323            2,443            2,312          2,503          2,395
* Represents marketing sales price less product costs for all distribution channels other than commercial product supply.
** Represents a 50 percent interest in the Wood River refinery. Represents an 85 percent interest in the Borger refinery in 2007. Our ownership interest in the Borger refinery was reduced to 65 percent effective
 January 1, 2008. These refineries were contributed to a business venture with EnCana, effective January 1, 2007.
                                                                                                                                                                                                                                Page 9 of 12
R&M (continued)

                                                                                                          2007                                                                             2008
                                                                          1st Qtr         2nd Qtr          3rd Qtr            4th Qtr             YTD                1st Qtr     2nd Qtr    3rd Qtr   4th Qtr         YTD

International - Consolidated*
Crude Oil Charge Input (MB/D)                                                503              505               434              493               484                  455         466       383       475           445
Total Charge Input (MB/D)                                                    532              528               455              517               508                  463         479       404       493           460
Crude Oil Capacity Utilization (%)                                           91%              92%               79%              89%               88%                  82%         84%       69%       86%           81%
Clean Product Yield (%)                                                      68%              67%               71%              65%               68%                  65%         69%       74%       71%           70%

International - Equity Affiliates - Net Share**
Crude Oil Charge Input (MB/D)                                                120              145              140               124              132                   123        123        122       122           122
Total Charge Input (MB/D)                                                    121              146              142               125              134                   124        124        124       127           125
Crude Oil Capacity Utilization (%)                                           83%             101%             104%              106%              98%                  104%       104%       103%      103%          104%
Clean Product Yield (%)                                                      77%              79%              81%               84%              80%                   86%        83%        89%       85%           86%

TOTAL INTERNATIONAL
Crude Oil Charge Input (MB/D)                                                623              650               574              617              616                   578         589       505       597           567
Total Charge Input (MB/D)                                                    653              674               597              642              642                   587         603       528       620           585
Crude Oil Capacity Utilization (%)                                           90%              93%               84%              92%              90%                   86%         88%       75%       89%           85%
Clean Product Yield (%)                                                      70%              69%               74%              69%              70%                   70%         72%       77%       74%           73%

Refined Products Production (MB/D)
Gasoline                                                                     160              159               160              160               160                  129         155       148       170           151
Distillates                                                                  289              302               273              277               285                  274         274       255       285           272
Other                                                                        195              203               160              196               188                  171         163       120       155           152
 Total                                                                       644              664               593              633               633                  574         592       523       610           575

Petroleum Products Sales (MB/D)
Gasoline                                                                     176               186              161              173               174                  139         190       176       144           163
Distillates                                                                  381               379              328              366               363                  321         324       324       336           326
Other                                                                        156               174              140              171               160                  156         169       134       164           156
 Total                                                                       713               739              629              710               697                  616         683       634       644           645


Worldwide - Including Net Share of Equity Affiliates
Crude Oil Charge Input (MB/D)                                              2,561            2,546             2,554            2,578            2,560                 2,384       2,480      2,318    2,482          2,416
Total Charge Input (MB/D)                                                  2,787            2,756             2,756            2,789            2,773                 2,564       2,692      2,491    2,688          2,609
Crude Oil Capacity Utilization (%)                                           94%              93%               94%              95%              94%                   89%         93%        87%      93%            90%
Clean Product Yield (%)                                                      80%              80%               80%              81%              80%                   80%         79%        82%      82%            81%

Refined Products Production (MB/D)
Gasoline                                                                   1,122            1,116             1,119            1,138            1,124                 1,021       1,031      1,000    1,099         1,038
Distillates                                                                1,051            1,038             1,052            1,072            1,053                   993       1,049        998    1,076         1,029
Other                                                                        623              597               599              588              602                   551         607        500      514           543
 Total                                                                     2,796            2,751             2,770            2,798            2,779                 2,565       2,687      2,498    2,689         2,610

Petroleum Products Sales (MB/D)
Gasoline                                                                   1,434            1,486             1,373            1,380            1,418                 1,209       1,317      1,265    1,371         1,291
Distillates                                                                1,243            1,206             1,197            1,295            1,235                 1,190       1,236      1,182    1,270         1,219
Other                                                                        636              677               579              480              592                   540         573        499      506           530
 Total                                                                     3,313            3,369             3,149            3,155            3,245                 2,939       3,126      2,946    3,147         3,040
* Represents our Humber refinery in the United Kingdom, the Whitegate refinery in Ireland, and our Wilhelmshaven refinery in Germany.
** Represents 18.75 percent interest in a refinery complex in Karlsruhe, Germany, and 47 percent interest in a refinery in Melaka, Malaysia. Through August 31, 2007,
  represents a 16.33 percent interest in two refineries in Kralupy and Litvinov, Czech Republic. We sold our interest in the two Czech refineries effective September 1, 2007.


                                                                                                                                                                                                              Page 10 of 12
LUKOIL INVESTMENT

                                                                                                       2007                                                                2008
                                                                        1st Qtr        2nd Qtr          3rd Qtr           4th Qtr             YTD      1st Qtr   2nd Qtr    3rd Qtr   4th Qtr          YTD
LUKOIL Investment
 Net Income (Loss) ($ Millions)                                            256              526             387              649            1,818        710        774       438     (7,410)        (5,488)

Upstream
Production*
Net crude oil production (MB/D)                                            393              427             390              395              401        392        387       371       392            386
Net natural gas production (MMCF/D)                                        309              278             249              188              256        404        363       303       355            356
BOE Total (MBOE/D)                                                         445              473             432              426              444        459        448       422       451            445
* Represents our estimated net share of LUKOIL's production.


Industry Prices
Crude Oil ($/bbl)
 Urals crude (CIF Mediterranean)                                         53.96           65.30            72.21            85.90            69.49      93.01     117.34     113.54    54.66           94.79

Downstream
Refinery Throughput*
Crude Processed (MB/D)                                                     219              184             226              227              214        222        215       228       250            229
* Represents our estimated net share of LUKOIL's crude processed.


                                                                                                           MIDSTREAM

                                                                                                       2007                                                                2008
                                                                        1st Qtr        2nd Qtr          3rd Qtr           4th Qtr             YTD      1st Qtr   2nd Qtr    3rd Qtr   4th Qtr          YTD


Midstream Net Income ($ Millions)                                           85              102             104              162              453        137        162       173        69            541

U.S. Equity Affiliate ($ Millions)*                                         50               76               90             120              336        118        137       153        50            458

Natural Gas Liquids Extracted (MB/D)
Consolidated
 United States                                                              15               23               26               24              22           -         -          -         -              -
 International                                                               -                -                -                -               -           -         -          -         -              -
Equity Affiliates
 United States*                                                            174              181             182              189              181        190        188       169       175            180
 International                                                               8                7               8                8                8          8          8         7         7              8
Total                                                                      197              211             216              221              211        198        196       176       182            188
* Represents 50 percent interest in DCP Midstream.


Natural Gas Liquids Fractionated (MB/D)
United States*                                                             161              163             155              160              160        141        149       166       150            151
International                                                               13               13              13               13               13         13         13        15        15             14
Total                                                                      174              176             168              173              173        154        162       181       165            165
* Excludes DCP Midstream.


Product Prices
Weighted Average NGL ($/bbl)*
 Consolidated                                                            37.73           45.19            48.62            60.19            47.93      60.09      68.21      67.39    29.49           56.29
 DCP Midstream                                                           36.55           44.30            47.73            58.60            46.80      56.48      62.53      60.46    28.85           52.08
* Prices are based on index prices from the Mont Belvieu and Conway market hubs that are weighted by natural gas liquids component and location mix.


DD&A ($ Millions)                                                             4                3               4                3              14           2         1          2         1              6


                                                                                                                                                                                               Page 11 of 12
CHEMICALS

                                                                                                         2007                                                                          2008
                                                                         1st Qtr         2nd Qtr          3rd Qtr          4th Qtr              YTD              1st Qtr     2nd Qtr    3rd Qtr   4th Qtr          YTD
Chemicals
 Net Income (Loss) ($ Millions)                                               82              68              110               99              359                   52         18         46        (6)          110

Industry Margins (Cents/Lb)*
Ethylene industry cash margin                                              11.1             10.8             11.5              9.7             10.8                 10.6       10.2       16.0      15.3           13.0
HDPE industry contract sales margin                                        13.5             14.6             14.8             13.6             14.1                 14.9       15.0       23.4      22.5           19.0
Styrene industry contract sales margin                                     11.1             11.6             11.5             10.7             11.2                 11.6       11.3       14.4      16.0           13.3
* Prices, economics and views expressed by CMAI are strictly the opinion of CMAI and Purvin & Gertz and are based on information collected within the public sector and on
 assessments by CMAI and Purvin & Gertz staff utilizing reasonable care consistent with normal industry practice. CMAI and Purvin & Gertz make no guarantee or warranty
 and assume no liability as to their use.


                                                                                                     EMERGING BUSINESSES

                                                                                                         2007                                                                          2008
                                                                         1st Qtr         2nd Qtr          3rd Qtr          4th Qtr              YTD              1st Qtr     2nd Qtr    3rd Qtr   4th Qtr          YTD
Emerging Businesses
 Net Income (Loss) ($ Millions)                                               (1)             (12)               3                2               (8)                 12          8         35       (25)           30

Detail of Net Income (Loss) ($ Millions)
Power                                                                         13               (1)             21               20               53                   27         26         53         -           106
Other                                                                        (14)             (11)            (18)             (18)             (61)                 (15)       (18)       (18)      (25)          (76)
Total                                                                         (1)             (12)              3                2               (8)                  12          8         35       (25)           30


                                                                                                   CORPORATE AND OTHER

                                                                                                         2007                                                                          2008
                                                                         1st Qtr         2nd Qtr          3rd Qtr          4th Qtr              YTD              1st Qtr     2nd Qtr    3rd Qtr   4th Qtr          YTD
Corporate and Other
 Net Income (Loss) ($ Millions)                                            (341)            (337)            (320)            (271)          (1,269)                (179)      (186)      (281)     (388)        (1,034)


Detail of Net Income (Loss) ($ Millions)
Net interest expense                                                       (244)            (224)            (195)            (157)            (820)                (108)      (119)      (149)     (182)          (558)
Corporate overhead                                                          (23)             (54)             (49)             (50)            (176)                 (44)       (68)       (41)      (49)          (202)
Acquisition-related expenses                                                (13)             (16)             (11)              (4)             (44)                   -          -          -         -              -
Other                                                                       (61)             (43)             (65)             (60)            (229)                 (27)         1        (91)     (157)          (274)
Total                                                                      (341)            (337)            (320)            (271)          (1,269)                (179)      (186)      (281)     (388)        (1,034)


Before-Tax Net Interest Expense ($ Millions)
Interest expense                                                           (395)            (411)            (485)            (340)          (1,631)                (319)      (324)      (326)     (362)        (1,331)
Capitalized interest                                                        135              139              141              150              565                  157        157        130       125            569
Interest revenue                                                             31               24              153               38              246                   72         14         28        14            128
Premium on early debt retirement                                            (17)               -                -                -              (17)                 (14)         -          -        (1)           (15)
                                                                           (246)            (248)            (191)            (152)            (837)                (104)      (153)      (168)     (224)          (649)

Foreign Currency Gains
 (Losses) After-Tax ($ Millions)                                             (14)             (16)            (35)             (55)            (120)                   (3)       41        (56)      (54)           (72)

Debt
Total Debt ($ Millions)                                                 23,668           22,812           21,876           21,687           21,687               21,492      21,924     22,100    27,455        27,455
Debt-to-Capital Ratio                                                      22%              21%              20%              19%              19%                  19%         19%        19%       33%           33%

Common Stockholders' Equity ($ Millions)                                84,782           84,928           86,933           88,983           88,983               89,575      92,398     92,876    55,165        55,165


                                                                                                                                                                                                           Page 12 of 12

More Related Content

Viewers also liked

wal mart store 1996Financials
wal mart store 1996Financialswal mart store 1996Financials
wal mart store 1996Financialsfinance1
 
conoco phillips 2007Third Quarter
conoco phillips 2007Third Quarterconoco phillips 2007Third Quarter
conoco phillips 2007Third Quarterfinance1
 
Reach MD Cme Update February 2009
Reach MD Cme Update February 2009Reach MD Cme Update February 2009
Reach MD Cme Update February 2009ppayerli
 
SmartGov | 政府與公民共創價值的小撇步
SmartGov | 政府與公民共創價值的小撇步SmartGov | 政府與公民共創價值的小撇步
SmartGov | 政府與公民共創價值的小撇步Lex Wang
 

Viewers also liked (6)

wal mart store 1996Financials
wal mart store 1996Financialswal mart store 1996Financials
wal mart store 1996Financials
 
conoco phillips 2007Third Quarter
conoco phillips 2007Third Quarterconoco phillips 2007Third Quarter
conoco phillips 2007Third Quarter
 
Field Mobility Suite
Field Mobility SuiteField Mobility Suite
Field Mobility Suite
 
Reach MD Cme Update February 2009
Reach MD Cme Update February 2009Reach MD Cme Update February 2009
Reach MD Cme Update February 2009
 
Roboconf Use Cases
Roboconf Use CasesRoboconf Use Cases
Roboconf Use Cases
 
SmartGov | 政府與公民共創價值的小撇步
SmartGov | 政府與公民共創價值的小撇步SmartGov | 政府與公民共創價值的小撇步
SmartGov | 政府與公民共創價值的小撇步
 

Similar to conoco phillips 2008Fourth Quarter

occidental petroleum Consolidated Statements of Operations
occidental petroleum Consolidated Statements of Operationsoccidental petroleum Consolidated Statements of Operations
occidental petroleum Consolidated Statements of Operationsfinance13
 
state street corp stt_finrev02
state street corp stt_finrev02state street corp stt_finrev02
state street corp stt_finrev02finance23
 
alltel 1Q06_Supplement
alltel  1Q06_Supplementalltel  1Q06_Supplement
alltel 1Q06_Supplementfinance27
 
progress energy statement_2001_3
progress energy statement_2001_3progress energy statement_2001_3
progress energy statement_2001_3finance25
 
alltel 2Q06_Supplement
alltel  2Q06_Supplementalltel  2Q06_Supplement
alltel 2Q06_Supplementfinance27
 
occidental petroleum Consolidated Balance Sheets
occidental petroleum Consolidated Balance Sheetsoccidental petroleum Consolidated Balance Sheets
occidental petroleum Consolidated Balance Sheetsfinance13
 
progress energy 07/25/2001
progress energy 07/25/2001progress energy 07/25/2001
progress energy 07/25/2001finance25
 
conoco phillips 2006Second Quarter
conoco phillips 2006Second Quarterconoco phillips 2006Second Quarter
conoco phillips 2006Second Quarterfinance1
 
alltel 3Q06_InvestorSupplementa
alltel  3Q06_InvestorSupplementaalltel  3Q06_InvestorSupplementa
alltel 3Q06_InvestorSupplementafinance27
 
alltel 4Q 06_Supplement
alltel  4Q 06_Supplementalltel  4Q 06_Supplement
alltel 4Q 06_Supplementfinance27
 
conoco phillips 2006Third Quarter
conoco phillips 2006Third Quarterconoco phillips 2006Third Quarter
conoco phillips 2006Third Quarterfinance1
 
atmos enerrgy segmentinfo040408
atmos enerrgy segmentinfo040408atmos enerrgy segmentinfo040408
atmos enerrgy segmentinfo040408finance35
 
alltel 4Q04_Supplemental
alltel  4Q04_Supplementalalltel  4Q04_Supplemental
alltel 4Q04_Supplementalfinance27
 
alltel 4Q04_Supplemental
alltel  4Q04_Supplementalalltel  4Q04_Supplemental
alltel 4Q04_Supplementalfinance27
 
alltel 4Q04_Supplemental
alltel  4Q04_Supplementalalltel  4Q04_Supplemental
alltel 4Q04_Supplementalfinance27
 
alltel 4Q 04_Supplemental
alltel  4Q 04_Supplementalalltel  4Q 04_Supplemental
alltel 4Q 04_Supplementalfinance27
 
alltel 4Q04_Supplemental
alltel  4Q04_Supplementalalltel  4Q04_Supplemental
alltel 4Q04_Supplementalfinance27
 
alltel 4Q04_Supplemental
alltel  4Q04_Supplementalalltel  4Q04_Supplemental
alltel 4Q04_Supplementalfinance27
 
alltel 4Q04_Supplemental
alltel  4Q04_Supplementalalltel  4Q04_Supplemental
alltel 4Q04_Supplementalfinance27
 

Similar to conoco phillips 2008Fourth Quarter (20)

occidental petroleum Consolidated Statements of Operations
occidental petroleum Consolidated Statements of Operationsoccidental petroleum Consolidated Statements of Operations
occidental petroleum Consolidated Statements of Operations
 
state street corp stt_finrev02
state street corp stt_finrev02state street corp stt_finrev02
state street corp stt_finrev02
 
alltel 1Q06_Supplement
alltel  1Q06_Supplementalltel  1Q06_Supplement
alltel 1Q06_Supplement
 
progress energy statement_2001_3
progress energy statement_2001_3progress energy statement_2001_3
progress energy statement_2001_3
 
alltel 2Q06_Supplement
alltel  2Q06_Supplementalltel  2Q06_Supplement
alltel 2Q06_Supplement
 
occidental petroleum Consolidated Balance Sheets
occidental petroleum Consolidated Balance Sheetsoccidental petroleum Consolidated Balance Sheets
occidental petroleum Consolidated Balance Sheets
 
progress energy 07/25/2001
progress energy 07/25/2001progress energy 07/25/2001
progress energy 07/25/2001
 
Telenor Financial statment
Telenor Financial statmentTelenor Financial statment
Telenor Financial statment
 
conoco phillips 2006Second Quarter
conoco phillips 2006Second Quarterconoco phillips 2006Second Quarter
conoco phillips 2006Second Quarter
 
alltel 3Q06_InvestorSupplementa
alltel  3Q06_InvestorSupplementaalltel  3Q06_InvestorSupplementa
alltel 3Q06_InvestorSupplementa
 
alltel 4Q 06_Supplement
alltel  4Q 06_Supplementalltel  4Q 06_Supplement
alltel 4Q 06_Supplement
 
conoco phillips 2006Third Quarter
conoco phillips 2006Third Quarterconoco phillips 2006Third Quarter
conoco phillips 2006Third Quarter
 
atmos enerrgy segmentinfo040408
atmos enerrgy segmentinfo040408atmos enerrgy segmentinfo040408
atmos enerrgy segmentinfo040408
 
alltel 4Q04_Supplemental
alltel  4Q04_Supplementalalltel  4Q04_Supplemental
alltel 4Q04_Supplemental
 
alltel 4Q04_Supplemental
alltel  4Q04_Supplementalalltel  4Q04_Supplemental
alltel 4Q04_Supplemental
 
alltel 4Q04_Supplemental
alltel  4Q04_Supplementalalltel  4Q04_Supplemental
alltel 4Q04_Supplemental
 
alltel 4Q 04_Supplemental
alltel  4Q 04_Supplementalalltel  4Q 04_Supplemental
alltel 4Q 04_Supplemental
 
alltel 4Q04_Supplemental
alltel  4Q04_Supplementalalltel  4Q04_Supplemental
alltel 4Q04_Supplemental
 
alltel 4Q04_Supplemental
alltel  4Q04_Supplementalalltel  4Q04_Supplemental
alltel 4Q04_Supplemental
 
alltel 4Q04_Supplemental
alltel  4Q04_Supplementalalltel  4Q04_Supplemental
alltel 4Q04_Supplemental
 

More from finance1

AT&TFinancial and Operational Results
AT&TFinancial and Operational ResultsAT&TFinancial and Operational Results
AT&TFinancial and Operational Resultsfinance1
 
AT&T First-Quarter Earnings Package
AT&T First-Quarter Earnings PackageAT&T First-Quarter Earnings Package
AT&T First-Quarter Earnings Packagefinance1
 
AT&T Quarterly Earnings - 2Q 2008
AT&T Quarterly Earnings - 2Q 2008AT&T Quarterly Earnings - 2Q 2008
AT&T Quarterly Earnings - 2Q 2008finance1
 
AT&T Third-Quarter Earnings Package
AT&T Third-Quarter Earnings PackageAT&T Third-Quarter Earnings Package
AT&T Third-Quarter Earnings Packagefinance1
 
AT&T Fourth-Quarter Earnings Package
AT&T Fourth-Quarter Earnings PackageAT&T Fourth-Quarter Earnings Package
AT&T Fourth-Quarter Earnings Packagefinance1
 
AT&T Financial and Operational Results
AT&T Financial and Operational ResultsAT&T Financial and Operational Results
AT&T Financial and Operational Resultsfinance1
 
GE# 2000 Proxy Statement
GE# 2000 Proxy Statement GE# 2000 Proxy Statement
GE# 2000 Proxy Statement finance1
 
GE# 2001 Proxy Statement (PDF)
GE# 2001 Proxy Statement (PDF)GE# 2001 Proxy Statement (PDF)
GE# 2001 Proxy Statement (PDF)finance1
 
GE# 2002 Proxy Statement
GE# 2002 Proxy Statement GE# 2002 Proxy Statement
GE# 2002 Proxy Statement finance1
 
GE# 2003 Proxy Statement
GE# 2003 Proxy Statement GE# 2003 Proxy Statement
GE# 2003 Proxy Statement finance1
 
GE# 2004 Proxy Statement
GE# 2004 Proxy Statement GE# 2004 Proxy Statement
GE# 2004 Proxy Statement finance1
 
GE# 2005 Proxy Statement
GE# 2005 Proxy Statement GE# 2005 Proxy Statement
GE# 2005 Proxy Statement finance1
 
GE# 2006 Proxy Statement
GE# 2006 Proxy Statement GE# 2006 Proxy Statement
GE# 2006 Proxy Statement finance1
 
onoco phillips 2004First Quarter
onoco phillips 2004First Quarteronoco phillips 2004First Quarter
onoco phillips 2004First Quarterfinance1
 
conoco phillips 2004Second Quarter
conoco phillips 2004Second Quarterconoco phillips 2004Second Quarter
conoco phillips 2004Second Quarterfinance1
 
conoco phillips 2004Third Quarter
conoco phillips 2004Third Quarterconoco phillips 2004Third Quarter
conoco phillips 2004Third Quarterfinance1
 
conoco phillips 2004Fourth Quarter
conoco phillips 2004Fourth Quarterconoco phillips 2004Fourth Quarter
conoco phillips 2004Fourth Quarterfinance1
 
conoco phillips 2005First Quarter
conoco phillips 2005First Quarterconoco phillips 2005First Quarter
conoco phillips 2005First Quarterfinance1
 
conoco phillips 2005Fourth Quarter
conoco phillips 2005Fourth Quarterconoco phillips 2005Fourth Quarter
conoco phillips 2005Fourth Quarterfinance1
 
conoco phillips 2006First Quarter
conoco phillips 2006First Quarter conoco phillips 2006First Quarter
conoco phillips 2006First Quarter finance1
 

More from finance1 (20)

AT&TFinancial and Operational Results
AT&TFinancial and Operational ResultsAT&TFinancial and Operational Results
AT&TFinancial and Operational Results
 
AT&T First-Quarter Earnings Package
AT&T First-Quarter Earnings PackageAT&T First-Quarter Earnings Package
AT&T First-Quarter Earnings Package
 
AT&T Quarterly Earnings - 2Q 2008
AT&T Quarterly Earnings - 2Q 2008AT&T Quarterly Earnings - 2Q 2008
AT&T Quarterly Earnings - 2Q 2008
 
AT&T Third-Quarter Earnings Package
AT&T Third-Quarter Earnings PackageAT&T Third-Quarter Earnings Package
AT&T Third-Quarter Earnings Package
 
AT&T Fourth-Quarter Earnings Package
AT&T Fourth-Quarter Earnings PackageAT&T Fourth-Quarter Earnings Package
AT&T Fourth-Quarter Earnings Package
 
AT&T Financial and Operational Results
AT&T Financial and Operational ResultsAT&T Financial and Operational Results
AT&T Financial and Operational Results
 
GE# 2000 Proxy Statement
GE# 2000 Proxy Statement GE# 2000 Proxy Statement
GE# 2000 Proxy Statement
 
GE# 2001 Proxy Statement (PDF)
GE# 2001 Proxy Statement (PDF)GE# 2001 Proxy Statement (PDF)
GE# 2001 Proxy Statement (PDF)
 
GE# 2002 Proxy Statement
GE# 2002 Proxy Statement GE# 2002 Proxy Statement
GE# 2002 Proxy Statement
 
GE# 2003 Proxy Statement
GE# 2003 Proxy Statement GE# 2003 Proxy Statement
GE# 2003 Proxy Statement
 
GE# 2004 Proxy Statement
GE# 2004 Proxy Statement GE# 2004 Proxy Statement
GE# 2004 Proxy Statement
 
GE# 2005 Proxy Statement
GE# 2005 Proxy Statement GE# 2005 Proxy Statement
GE# 2005 Proxy Statement
 
GE# 2006 Proxy Statement
GE# 2006 Proxy Statement GE# 2006 Proxy Statement
GE# 2006 Proxy Statement
 
onoco phillips 2004First Quarter
onoco phillips 2004First Quarteronoco phillips 2004First Quarter
onoco phillips 2004First Quarter
 
conoco phillips 2004Second Quarter
conoco phillips 2004Second Quarterconoco phillips 2004Second Quarter
conoco phillips 2004Second Quarter
 
conoco phillips 2004Third Quarter
conoco phillips 2004Third Quarterconoco phillips 2004Third Quarter
conoco phillips 2004Third Quarter
 
conoco phillips 2004Fourth Quarter
conoco phillips 2004Fourth Quarterconoco phillips 2004Fourth Quarter
conoco phillips 2004Fourth Quarter
 
conoco phillips 2005First Quarter
conoco phillips 2005First Quarterconoco phillips 2005First Quarter
conoco phillips 2005First Quarter
 
conoco phillips 2005Fourth Quarter
conoco phillips 2005Fourth Quarterconoco phillips 2005Fourth Quarter
conoco phillips 2005Fourth Quarter
 
conoco phillips 2006First Quarter
conoco phillips 2006First Quarter conoco phillips 2006First Quarter
conoco phillips 2006First Quarter
 

Recently uploaded

AfRESFullPaper22018EmpiricalPerformanceofRealEstateInvestmentTrustsandShareho...
AfRESFullPaper22018EmpiricalPerformanceofRealEstateInvestmentTrustsandShareho...AfRESFullPaper22018EmpiricalPerformanceofRealEstateInvestmentTrustsandShareho...
AfRESFullPaper22018EmpiricalPerformanceofRealEstateInvestmentTrustsandShareho...yordanosyohannes2
 
call girls in Nand Nagri (DELHI) 🔝 >༒9953330565🔝 genuine Escort Service 🔝✔️✔️
call girls in  Nand Nagri (DELHI) 🔝 >༒9953330565🔝 genuine Escort Service 🔝✔️✔️call girls in  Nand Nagri (DELHI) 🔝 >༒9953330565🔝 genuine Escort Service 🔝✔️✔️
call girls in Nand Nagri (DELHI) 🔝 >༒9953330565🔝 genuine Escort Service 🔝✔️✔️9953056974 Low Rate Call Girls In Saket, Delhi NCR
 
Economics, Commerce and Trade Management: An International Journal (ECTIJ)
Economics, Commerce and Trade Management: An International Journal (ECTIJ)Economics, Commerce and Trade Management: An International Journal (ECTIJ)
Economics, Commerce and Trade Management: An International Journal (ECTIJ)ECTIJ
 
Stock Market Brief Deck FOR 4/17 video.pdf
Stock Market Brief Deck FOR 4/17 video.pdfStock Market Brief Deck FOR 4/17 video.pdf
Stock Market Brief Deck FOR 4/17 video.pdfMichael Silva
 
Authentic No 1 Amil Baba In Pakistan Authentic No 1 Amil Baba In Karachi No 1...
Authentic No 1 Amil Baba In Pakistan Authentic No 1 Amil Baba In Karachi No 1...Authentic No 1 Amil Baba In Pakistan Authentic No 1 Amil Baba In Karachi No 1...
Authentic No 1 Amil Baba In Pakistan Authentic No 1 Amil Baba In Karachi No 1...First NO1 World Amil baba in Faisalabad
 
SBP-Market-Operations and market managment
SBP-Market-Operations and market managmentSBP-Market-Operations and market managment
SBP-Market-Operations and market managmentfactical
 
《加拿大本地办假证-寻找办理Dalhousie毕业证和达尔豪斯大学毕业证书的中介代理》
《加拿大本地办假证-寻找办理Dalhousie毕业证和达尔豪斯大学毕业证书的中介代理》《加拿大本地办假证-寻找办理Dalhousie毕业证和达尔豪斯大学毕业证书的中介代理》
《加拿大本地办假证-寻找办理Dalhousie毕业证和达尔豪斯大学毕业证书的中介代理》rnrncn29
 
government_intervention_in_business_ownership[1].pdf
government_intervention_in_business_ownership[1].pdfgovernment_intervention_in_business_ownership[1].pdf
government_intervention_in_business_ownership[1].pdfshaunmashale756
 
Quantitative Analysis of Retail Sector Companies
Quantitative Analysis of Retail Sector CompaniesQuantitative Analysis of Retail Sector Companies
Quantitative Analysis of Retail Sector Companiesprashantbhati354
 
Vp Girls near me Delhi Call Now or WhatsApp
Vp Girls near me Delhi Call Now or WhatsAppVp Girls near me Delhi Call Now or WhatsApp
Vp Girls near me Delhi Call Now or WhatsAppmiss dipika
 
House of Commons ; CDC schemes overview document
House of Commons ; CDC schemes overview documentHouse of Commons ; CDC schemes overview document
House of Commons ; CDC schemes overview documentHenry Tapper
 
(办理学位证)美国加州州立大学东湾分校毕业证成绩单原版一比一
(办理学位证)美国加州州立大学东湾分校毕业证成绩单原版一比一(办理学位证)美国加州州立大学东湾分校毕业证成绩单原版一比一
(办理学位证)美国加州州立大学东湾分校毕业证成绩单原版一比一S SDS
 
fca-bsps-decision-letter-redacted (1).pdf
fca-bsps-decision-letter-redacted (1).pdffca-bsps-decision-letter-redacted (1).pdf
fca-bsps-decision-letter-redacted (1).pdfHenry Tapper
 
原版1:1复刻温哥华岛大学毕业证Vancouver毕业证留信学历认证
原版1:1复刻温哥华岛大学毕业证Vancouver毕业证留信学历认证原版1:1复刻温哥华岛大学毕业证Vancouver毕业证留信学历认证
原版1:1复刻温哥华岛大学毕业证Vancouver毕业证留信学历认证rjrjkk
 
NO1 Certified Ilam kala Jadu Specialist Expert In Bahawalpur, Sargodha, Sialk...
NO1 Certified Ilam kala Jadu Specialist Expert In Bahawalpur, Sargodha, Sialk...NO1 Certified Ilam kala Jadu Specialist Expert In Bahawalpur, Sargodha, Sialk...
NO1 Certified Ilam kala Jadu Specialist Expert In Bahawalpur, Sargodha, Sialk...Amil Baba Dawood bangali
 
PMFBY , Pradhan Mantri Fasal bima yojna
PMFBY , Pradhan Mantri  Fasal bima yojnaPMFBY , Pradhan Mantri  Fasal bima yojna
PMFBY , Pradhan Mantri Fasal bima yojnaDharmendra Kumar
 
BPPG response - Options for Defined Benefit schemes - 19Apr24.pdf
BPPG response - Options for Defined Benefit schemes - 19Apr24.pdfBPPG response - Options for Defined Benefit schemes - 19Apr24.pdf
BPPG response - Options for Defined Benefit schemes - 19Apr24.pdfHenry Tapper
 
2024 Q1 Crypto Industry Report | CoinGecko
2024 Q1 Crypto Industry Report | CoinGecko2024 Q1 Crypto Industry Report | CoinGecko
2024 Q1 Crypto Industry Report | CoinGeckoCoinGecko
 
(中央兰开夏大学毕业证学位证成绩单-案例)
(中央兰开夏大学毕业证学位证成绩单-案例)(中央兰开夏大学毕业证学位证成绩单-案例)
(中央兰开夏大学毕业证学位证成绩单-案例)twfkn8xj
 

Recently uploaded (20)

AfRESFullPaper22018EmpiricalPerformanceofRealEstateInvestmentTrustsandShareho...
AfRESFullPaper22018EmpiricalPerformanceofRealEstateInvestmentTrustsandShareho...AfRESFullPaper22018EmpiricalPerformanceofRealEstateInvestmentTrustsandShareho...
AfRESFullPaper22018EmpiricalPerformanceofRealEstateInvestmentTrustsandShareho...
 
call girls in Nand Nagri (DELHI) 🔝 >༒9953330565🔝 genuine Escort Service 🔝✔️✔️
call girls in  Nand Nagri (DELHI) 🔝 >༒9953330565🔝 genuine Escort Service 🔝✔️✔️call girls in  Nand Nagri (DELHI) 🔝 >༒9953330565🔝 genuine Escort Service 🔝✔️✔️
call girls in Nand Nagri (DELHI) 🔝 >༒9953330565🔝 genuine Escort Service 🔝✔️✔️
 
Economics, Commerce and Trade Management: An International Journal (ECTIJ)
Economics, Commerce and Trade Management: An International Journal (ECTIJ)Economics, Commerce and Trade Management: An International Journal (ECTIJ)
Economics, Commerce and Trade Management: An International Journal (ECTIJ)
 
Stock Market Brief Deck FOR 4/17 video.pdf
Stock Market Brief Deck FOR 4/17 video.pdfStock Market Brief Deck FOR 4/17 video.pdf
Stock Market Brief Deck FOR 4/17 video.pdf
 
Authentic No 1 Amil Baba In Pakistan Authentic No 1 Amil Baba In Karachi No 1...
Authentic No 1 Amil Baba In Pakistan Authentic No 1 Amil Baba In Karachi No 1...Authentic No 1 Amil Baba In Pakistan Authentic No 1 Amil Baba In Karachi No 1...
Authentic No 1 Amil Baba In Pakistan Authentic No 1 Amil Baba In Karachi No 1...
 
SBP-Market-Operations and market managment
SBP-Market-Operations and market managmentSBP-Market-Operations and market managment
SBP-Market-Operations and market managment
 
《加拿大本地办假证-寻找办理Dalhousie毕业证和达尔豪斯大学毕业证书的中介代理》
《加拿大本地办假证-寻找办理Dalhousie毕业证和达尔豪斯大学毕业证书的中介代理》《加拿大本地办假证-寻找办理Dalhousie毕业证和达尔豪斯大学毕业证书的中介代理》
《加拿大本地办假证-寻找办理Dalhousie毕业证和达尔豪斯大学毕业证书的中介代理》
 
government_intervention_in_business_ownership[1].pdf
government_intervention_in_business_ownership[1].pdfgovernment_intervention_in_business_ownership[1].pdf
government_intervention_in_business_ownership[1].pdf
 
Quantitative Analysis of Retail Sector Companies
Quantitative Analysis of Retail Sector CompaniesQuantitative Analysis of Retail Sector Companies
Quantitative Analysis of Retail Sector Companies
 
Vp Girls near me Delhi Call Now or WhatsApp
Vp Girls near me Delhi Call Now or WhatsAppVp Girls near me Delhi Call Now or WhatsApp
Vp Girls near me Delhi Call Now or WhatsApp
 
House of Commons ; CDC schemes overview document
House of Commons ; CDC schemes overview documentHouse of Commons ; CDC schemes overview document
House of Commons ; CDC schemes overview document
 
(办理学位证)美国加州州立大学东湾分校毕业证成绩单原版一比一
(办理学位证)美国加州州立大学东湾分校毕业证成绩单原版一比一(办理学位证)美国加州州立大学东湾分校毕业证成绩单原版一比一
(办理学位证)美国加州州立大学东湾分校毕业证成绩单原版一比一
 
fca-bsps-decision-letter-redacted (1).pdf
fca-bsps-decision-letter-redacted (1).pdffca-bsps-decision-letter-redacted (1).pdf
fca-bsps-decision-letter-redacted (1).pdf
 
原版1:1复刻温哥华岛大学毕业证Vancouver毕业证留信学历认证
原版1:1复刻温哥华岛大学毕业证Vancouver毕业证留信学历认证原版1:1复刻温哥华岛大学毕业证Vancouver毕业证留信学历认证
原版1:1复刻温哥华岛大学毕业证Vancouver毕业证留信学历认证
 
NO1 Certified Ilam kala Jadu Specialist Expert In Bahawalpur, Sargodha, Sialk...
NO1 Certified Ilam kala Jadu Specialist Expert In Bahawalpur, Sargodha, Sialk...NO1 Certified Ilam kala Jadu Specialist Expert In Bahawalpur, Sargodha, Sialk...
NO1 Certified Ilam kala Jadu Specialist Expert In Bahawalpur, Sargodha, Sialk...
 
PMFBY , Pradhan Mantri Fasal bima yojna
PMFBY , Pradhan Mantri  Fasal bima yojnaPMFBY , Pradhan Mantri  Fasal bima yojna
PMFBY , Pradhan Mantri Fasal bima yojna
 
Monthly Economic Monitoring of Ukraine No 231, April 2024
Monthly Economic Monitoring of Ukraine No 231, April 2024Monthly Economic Monitoring of Ukraine No 231, April 2024
Monthly Economic Monitoring of Ukraine No 231, April 2024
 
BPPG response - Options for Defined Benefit schemes - 19Apr24.pdf
BPPG response - Options for Defined Benefit schemes - 19Apr24.pdfBPPG response - Options for Defined Benefit schemes - 19Apr24.pdf
BPPG response - Options for Defined Benefit schemes - 19Apr24.pdf
 
2024 Q1 Crypto Industry Report | CoinGecko
2024 Q1 Crypto Industry Report | CoinGecko2024 Q1 Crypto Industry Report | CoinGecko
2024 Q1 Crypto Industry Report | CoinGecko
 
(中央兰开夏大学毕业证学位证成绩单-案例)
(中央兰开夏大学毕业证学位证成绩单-案例)(中央兰开夏大学毕业证学位证成绩单-案例)
(中央兰开夏大学毕业证学位证成绩单-案例)
 

conoco phillips 2008Fourth Quarter

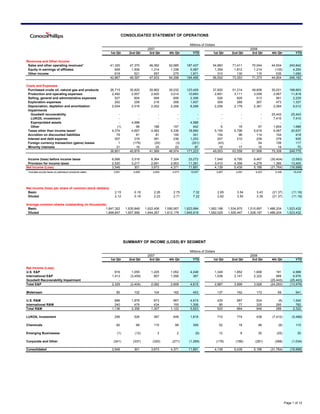
  • 1. CONSOLIDATED STATEMENT OF OPERATIONS Millions of Dollars 2007 2008 1st Qtr 2nd Qtr 3rd Qtr 4th Qtr YTD 1st Qtr 2nd Qtr 3rd Qtr 4th Qtr YTD Revenues and Other Income Sales and other operating revenues* 41,320 47,370 46,062 52,685 187,437 54,883 71,411 70,044 44,504 240,842 Equity in earnings of affiliates 929 1,506 1,314 1,338 5,087 1,359 1,812 1,214 (135) 4,250 Other income 618 521 557 275 1,971 310 130 115 535 1,090 42,867 49,397 47,933 54,298 194,495 56,552 73,353 71,373 44,904 246,182 Costs and Expenses Purchased crude oil, natural gas and products 26,715 30,820 30,862 35,032 123,429 37,820 51,214 49,608 30,021 168,663 Production and operating expenses 2,492 2,557 2,620 3,014 10,683 2,691 3,111 3,059 2,957 11,818 Selling, general and administrative expenses 527 604 569 606 2,306 526 629 513 561 2,229 Exploration expenses 262 259 218 268 1,007 309 288 267 473 1,337 Depreciation, depletion and amortization 2,024 2,016 2,052 2,206 8,298 2,209 2,178 2,361 2,264 9,012 Impairments Goodwill recoverability - - - - - - - - 25,443 25,443 LUKOIL investment - - - - - - - - 7,410 7,410 Expropriated assets - 4,588 - - 4,588 - - - - - Other (1) 98 188 157 442 6 19 57 1,604 1,686 Taxes other than income taxes* 4,374 4,697 4,583 5,336 18,990 5,155 5,796 5,619 4,067 20,637 Accretion on discounted liabilities 79 81 81 100 341 104 96 114 104 418 Interest and debt expense 307 319 391 236 1,253 207 210 239 279 935 Foreign currency transaction (gains) losses 1 (179) (20) (3) (201) (43) - 54 106 117 Minority interests 21 19 25 22 87 19 17 15 19 70 36,801 45,879 41,569 46,974 171,223 49,003 63,558 61,906 75,308 249,775 Income (loss) before income taxes 6,066 3,518 6,364 7,324 23,272 7,549 9,795 9,467 (30,404) (3,593) Provision for income taxes 2,520 3,217 2,691 2,953 11,381 3,410 4,356 4,279 1,360 13,405 Net Income (Loss) 3,546 301 3,673 4,371 11,891 4,139 5,439 5,188 (31,764) (16,998) * Includes excise taxes on petroleum products sales: 3,841 4,069 3,954 4,073 15,937 3,857 4,091 4,022 3,448 15,418 Net income (loss) per share of common stock (dollars) Basic 2.15 0.18 2.26 2.75 7.32 2.65 3.54 3.43 (21.37) (11.16) Diluted 2.12 0.18 2.23 2.71 7.22 2.62 3.50 3.39 (21.37) (11.16) Average common shares outstanding (in thousands) Basic 1,647,352 1,635,848 1,622,456 1,590,957 1,623,994 1,562,198 1,534,975 1,510,897 1,486,204 1,523,432 Diluted 1,668,847 1,657,999 1,644,267 1,612,179 1,645,919 1,582,025 1,555,447 1,528,187 1,486,204 1,523,432 SUMMARY OF INCOME (LOSS) BY SEGMENT Millions of Dollars 2007 2008 1st Qtr 2nd Qtr 3rd Qtr 4th Qtr YTD 1st Qtr 2nd Qtr 3rd Qtr 4th Qtr YTD Net Income (Loss) U.S. E&P 916 1,055 1,225 1,052 4,248 1,349 1,852 1,606 181 4,988 International E&P 1,413 (3,459) 857 1,556 367 1,538 2,147 2,322 969 6,976 Goodwill Recoverability Impairment - - - - - - - - (25,443) (25,443) Total E&P 2,329 (2,404) 2,082 2,608 4,615 2,887 3,999 3,928 (24,293) (13,479) Midstream 85 102 104 162 453 137 162 173 69 541 U.S. R&M 896 1,879 873 967 4,615 435 587 524 (6) 1,540 International R&M 240 479 434 155 1,308 85 77 325 295 782 Total R&M 1,136 2,358 1,307 1,122 5,923 520 664 849 289 2,322 LUKOIL Investment 256 526 387 649 1,818 710 774 438 (7,410) (5,488) Chemicals 82 68 110 99 359 52 18 46 (6) 110 Emerging Businesses (1) (12) 3 2 (8) 12 8 35 (25) 30 Corporate and Other (341) (337) (320) (271) (1,269) (179) (186) (281) (388) (1,034) Consolidated 3,546 301 3,673 4,371 11,891 4,139 5,439 5,188 (31,764) (16,998) Page 1 of 12
  • 2. SUMMARY OF INCOME (LOSS) BY SEGMENT (continued) Millions of Dollars 2007 2008 1st Qtr 2nd Qtr 3rd Qtr 4th Qtr YTD 1st Qtr 2nd Qtr 3rd Qtr 4th Qtr YTD Income (Loss) Before Income Taxes U.S. E&P 1,425 1,627 1,867 1,560 6,479 2,094 2,848 2,518 145 7,605 International E&P 2,894 (1,976) 2,357 3,464 6,739 3,822 5,211 5,134 2,430 16,597 Goodwill Recoverability Impairment - - - - - - - - (25,443) (25,443) Total E&P 4,319 (349) 4,224 5,024 13,218 5,916 8,059 7,652 (22,868) (1,241) Midstream 132 156 157 245 690 206 243 260 93 802 U.S. R&M 1,400 2,891 1,369 1,526 7,186 717 938 852 (33) 2,474 International R&M 218 633 403 167 1,421 101 32 442 421 996 Total R&M 1,618 3,524 1,772 1,693 8,607 818 970 1,294 388 3,470 LUKOIL Investment 262 542 396 663 1,863 729 795 451 (7,414) (5,439) Chemicals 107 80 140 20 347 54 - 64 7 125 Emerging Businesses (3) (20) (17) (2) (42) 15 17 45 (53) 24 Corporate and Other (369) (415) (308) (319) (1,411) (189) (289) (299) (557) (1,334) Consolidated 6,066 3,518 6,364 7,324 23,272 7,549 9,795 9,467 (30,404) (3,593) Effective Tax Rates U.S. E&P 35.7% 35.2% 34.4% 32.6% 34.4% 35.6% 35.0% 36.2% -24.8% 34.4% International E&P 51.2% - 63.6% 55.1% 94.6% 59.8% 58.8% 54.8% 60.1% 58.0% Total E&P 46.1% -588.8% 50.7% 48.1% 65.1% 51.2% 50.4% 48.7% -6.2% -986.1% Midstream 35.6% 34.6% 33.8% 33.9% 34.3% 33.5% 33.3% 33.5% 25.8% 32.5% U.S. R&M 36.0% 35.0% 36.2% 36.6% 35.8% 39.3% 37.4% 38.5% 81.8% 37.8% International R&M -10.1% 24.3% -7.7% 7.2% 8.0% 15.8% -140.6% 26.5% 29.9% 21.5% Total R&M 29.8% 33.1% 26.2% 33.7% 31.2% 36.4% 31.5% 34.4% 25.5% 33.1% LUKOIL Investment 2.3% 3.0% 2.3% 2.1% 2.4% 2.6% 2.6% 2.9% 0.1% -0.9% Chemicals 23.4% 15.0% 21.4% - -3.5% 3.7% - 28.1% 185.7% 12.0% Emerging Businesses 66.7% 40.0% - - 81.0% 20.0% 52.9% 22.2% 52.8% -25.0% Corporate and Other 7.6% 18.8% -3.9% 15.0% 10.1% 5.3% 35.6% 6.0% 30.3% 22.5% Consolidated 41.5% 91.4% 42.3% 40.3% 48.9% 45.2% 44.4% 45.2% -4.5% -373.1% ESTIMATED TAXES PAID Millions of Dollars 2007 2008 1st Qtr 2nd Qtr 3rd Qtr 4th Qtr YTD 1st Qtr 2nd Qtr 3rd Qtr 4th Qtr YTD Cash income taxes paid 1,199 4,326 2,444 3,361 11,330 1,649 4,756 3,845 2,872 13,122 Taxes other than income taxes 4,374 4,697 4,583 5,336 18,990 5,155 5,796 5,619 4,067 20,637 Less: Excise taxes* (3,841) (4,069) (3,954) (4,073) (15,937) (3,857) (4,091) (4,022) (3,448) (15,418) Estimated Taxes Paid 1,732 4,954 3,073 4,624 14,383 2,947 6,461 5,442 3,491 18,341 * Represents taxes collected by ConocoPhillips and reimbursed to taxing authorities. Page 2 of 12
  • 3. CERTAIN ITEMS INCLUDED IN NET INCOME (AFTER-TAX) Millions of Dollars 2007 2008 1st Qtr 2nd Qtr 3rd Qtr 4th Qtr YTD 1st Qtr 2nd Qtr 3rd Qtr 4th Qtr YTD U.S. E&P Gain on asset sales 36 11 - 25 72 4 12 - 11 27 FERC Rulings - - 94 - 94 - - - - - Impairments - - - (45) (45) - - - (403) (403) Business interruption insurance claims recovery - - - 13 13 - - - - - Severance accrual - - - - - - - - (43) (43) Total 36 11 94 (7) 134 4 12 - (435) (419) International E&P Gain (loss) on asset sales 407 (82) 164 147 636 8 - 138 417 563 International tax law changes 38 - - 171 209 - - - - - Impairment - expropriated assets - (4,512) - - (4,512) - - - - - Impairments (88) (33) (32) (75) (228) - - (28) (196) (224) Pending claims and settlements - - - 28 28 - - - - - Severance accrual - - - - - - - - (28) (28) Total 357 (4,627) 132 271 (3,867) 8 - 110 193 311 Goodwill recoverability impairment - - - - - - - - (25,443) (25,443) Total E&P 393 (4,616) 226 264 (3,733) 12 12 110 (25,685) (25,551) Midstream Total - - - - - - - - - - U.S. R&M Gain (loss) on asset sales - - 2 14 16 116 8 2 (5) 121 Impairments (13) - 3 (2) (12) (3) (10) - (357) (370) Business interruption insurance claims recovery - - - 10 10 - - - - - Severance accrual - - - - - - - - (23) (23) Total (13) - 5 22 14 113 (2) 2 (385) (272) International R&M Gain on asset sales - 163 158 2 323 - 1 - 102 103 Impairments 148 (5) (30) 11 124 - - - (180) (180) Germany tax rate change - - 141 - 141 - - - - - Severance accrual - - - - - - - - (1) (1) Total 148 158 269 13 588 - 1 - (79) (78) Total R&M 135 158 274 35 602 113 (1) 2 (464) (350) LUKOIL Investment Impairment - - - - - - - - (7,410) (7,410) Total - - - - - - - - (7,410) (7,410) Chemicals Asset retirements recorded by CPChem - (21) - - (21) - - - - - Tax benefit on capital loss - - - 65 65 - - - - - Total - (21) - 65 44 - - - - - Emerging Businesses Impairments - - - - - - - - (85) (85) Total - - - - - - - - (85) (85) Corporate and Other Acquisition-related expenses (13) (16) (11) (4) (44) - - - - - FERC Rulings - - (14) - (14) - - - - - Premium on early debt retirement (14) - - - (14) - - - - - Pending claims and settlements - - - - - 35 - - - 35 Canada tax law change - - - 15 15 - - - - - Impairments - - - - - - - - (30) (30) Severance accrual - - - - - - - - (4) (4) Total (27) (16) (25) 11 (57) 35 - - (34) 1 Total Company 501 (4,495) 475 375 (3,144) 160 11 112 (33,678) (33,395) Page 3 of 12
  • 4. CASH FLOW INFORMATION Millions of Dollars 2007 2008 1st Qtr 2nd Qtr 3rd Qtr 4th Qtr YTD 1st Qtr 2nd Qtr 3rd Qtr 4th Qtr YTD Cash Flows from Operating Activities Net income (loss) 3,546 301 3,673 4,371 11,891 4,139 5,439 5,188 (31,764) (16,998) Depreciation, depletion and amortization 2,024 2,016 2,052 2,206 8,298 2,209 2,178 2,361 2,264 9,012 Impairments (1) 4,686 188 157 5,030 6 19 57 34,457 34,539 Dry hole costs and leasehold impairments 148 133 74 108 463 154 127 118 299 698 Accretion on discounted liabilities 79 81 81 100 341 104 96 114 104 418 Deferred income taxes 77 103 (125) (88) (33) (17) 28 48 (487) (428) Undistributed equity earnings (557) (678) (237) (351) (1,823) (987) (1,001) (542) 921 (1,609) Net gain on asset dispositions (499) (428) (389) (32) (1,348) (181) (32) (133) (545) (891) Other (94) 182 (60) 148 176 (164) 83 (53) (930) (1,064) Net working capital changes 2,150 (1,630) 734 301 1,555 1,324 (1,503) 357 (1,197) (1,019) Net Cash Provided by Operating Activities 6,873 4,766 5,991 6,920 24,550 6,587 5,434 7,515 3,122 22,658 Cash Flows from Investing Activities Capital expenditures & investments (2,847) (2,500) (2,560) (3,884) (11,791) (3,322) (3,398) (3,815) (8,564) (19,099) Proceeds from asset dispositions 1,343 872 842 515 3,572 370 71 288 911 1,640 Long-term advances to/collections from affiliates and other investments (144) (97) (118) 16 (343) (60) (83) (209) 195 (157) Net Cash Used for Investing Activities (1,648) (1,725) (1,836) (3,353) (8,562) (3,012) (3,410) (3,736) (7,458) (17,616) Cash Flows from Financing Activities Net issuance (repayment) of debt (3,491) (865) (961) (202) (5,519) (202) 426 183 5,353 5,760 Issuance of stock 40 141 70 34 285 7 178 (3) 16 198 Repurchase of stock (1,000) (1,000) (2,501) (2,500) (7,001) (2,496) (2,512) (2,492) (749) (8,249) Dividends (674) (668) (667) (652) (2,661) (730) (719) (710) (695) (2,854) Other (49) (104) (136) (155) (444) (196) (44) (186) (193) (619) Net Cash Provided by (Used for) Financing Activities (5,174) (2,496) (4,195) (3,475) (15,340) (3,617) (2,671) (3,208) 3,732 (5,764) Effect of Exchange Rate Changes (8) 6 8 (15) (9) 9 11 (242) 243 21 Net Change in Cash and Cash Equivalents 43 551 (32) 77 639 (33) (636) 329 (361) (701) Cash and cash equivalents at beginning of period 817 860 1,411 1,379 817 1,456 1,423 787 1,116 1,456 Cash and Cash Equivalents at End of Period 860 1,411 1,379 1,456 1,456 1,423 787 1,116 755 755 Millions of Dollars 2007 2008 Capital Program 1st Qtr 2nd Qtr 3rd Qtr 4th Qtr YTD 1st Qtr 2nd Qtr 3rd Qtr 4th Qtr YTD E&P Capital expenditures and investments 2,570 2,148 2,177 3,040 9,935 2,818 2,806 3,079 7,753 16,456 Loans and advances 157 111 122 238 628 67 85 26 (18) 160 Joint venture acquisition obligation--principal - 140 142 143 425 145 148 149 151 593 E&P total 2,727 2,399 2,441 3,421 10,988 3,030 3,039 3,254 7,886 17,209 Midstream* - 2 - 3 5 - - - 4 4 R&M Capital expenditures and investments 205 271 276 634 1,386 363 510 674 722 2,269 Loans and advances 17 37 - - 54 - 2 1 - 3 R&M total 222 308 276 634 1,440 363 512 675 722 2,272 LUKOIL Investment* - - - - - - - - - - Chemicals* - - - - - - - - - - Emerging Businesses* 31 34 62 130 257 61 51 25 19 156 Corporate and Other* 41 45 45 77 208 80 31 37 66 214 Total Capital Program 3,021 2,788 2,824 4,265 12,898 3,534 3,633 3,991 8,697 19,855 * Capital expenditures and investments only. Page 4 of 12
  • 5. TOTAL E&P 2007 2008 1st Qtr 2nd Qtr 3rd Qtr 4th Qtr YTD 1st Qtr 2nd Qtr 3rd Qtr 4th Qtr YTD E&P Net Income (Loss) ($ Millions) 2,329 (2,404) 2,082 2,608 4,615 2,887 3,999 3,928 (24,293) (13,479) Production Total, Including Equity Affiliates and Canadian Syncrude (MBOE/D) 2,020 1,910 1,759 1,835 1,880 1,794 1,750 1,748 1,867 1,789 E&P segment plus LUKOIL Investment segment: 2,465 2,383 2,191 2,261 2,324 2,253 2,198 2,170 2,318 2,234 Crude Oil and Condensate (MB/D) Consolidated 840 760 730 752 770 758 731 718 803 752 Equity affiliates 120 128 44 43 84 45 41 63 67 54 Total 960 888 774 795 854 803 772 781 870 806 Sales of crude oil produced (MB/D) 949 876 803 792 854 773 803 776 853 801 Natural Gas Liquids (MB/D) 150 145 139 187 155 154 156 148 155 153 Natural Gas (MMCF/D) Consolidated 5,313 5,124 4,916 4,981 5,082 4,900 4,818 4,769 4,854 4,836 Equity affiliates 9 9 - - 5 - - - 45 11 Total 5,322 5,133 4,916 4,981 5,087 4,900 4,818 4,769 4,899 4,847 Canadian Syncrude (MB/D) 23 21 27 23 23 20 19 24 25 22 Industry Prices (Platt's) Crude Oil ($/bbl) WTI spot 57.99 64.89 75.48 90.66 72.25 97.94 123.98 117.83 58.49 99.56 Brent dated 57.76 68.76 74.87 88.69 72.52 96.90 121.38 114.78 54.91 96.99 Natural Gas ($/mmbtu) Henry Hub -- First of Month 6.77 7.55 6.16 6.97 6.86 8.03 10.94 10.25 6.95 9.04 Average Realized Prices Crude Oil and Condensate ($/bbl) Consolidated 55.17 64.55 73.01 86.28 69.47 94.71 119.24 114.20 55.11 95.15 Equity affiliates 40.02 47.74 44.60 52.45 45.31 62.78 93.20 88.32 25.35 63.89 Total 53.38 61.97 71.34 84.53 67.11 92.88 118.01 112.19 52.82 93.12 Natural Gas Liquids ($/bbl) 38.56 44.80 48.09 54.82 47.13 60.14 68.42 68.81 32.57 57.43 Natural Gas ($/mcf) Consolidated 6.36 6.45 5.56 6.66 6.26 8.03 9.87 8.91 6.37 8.28 Equity affiliates 0.29 0.30 - - 0.30 - - - 2.04 2.04 Total 6.35 6.44 5.56 6.66 6.26 8.03 9.87 8.91 6.32 8.27 Exploration Charges ($ Millions) Dry Holes 62 74 23 50 209 94 68 58 205 425 Lease Impairments 86 59 51 58 254 60 59 60 94 273 Total Non-Cash Charges 148 133 74 108 463 154 127 118 299 698 Other (G&G and Lease Rentals) 114 126 144 160 544 155 161 149 174 639 Total Exploration Charges 262 259 218 268 1,007 309 288 267 473 1,337 Depreciation, Depletion and Amortization (DD&A) ($ Millions) 1,802 1,790 1,828 1,971 7,391 1,946 1,940 2,123 2,019 8,028 Foreign Currency Gains (Losses) After-Tax ($ Millions) 17 152 13 34 216 (10) 2 118 106 216 Page 5 of 12
  • 6. U.S. E&P 2007 2008 1st Qtr 2nd Qtr 3rd Qtr 4th Qtr YTD 1st Qtr 2nd Qtr 3rd Qtr 4th Qtr YTD U.S. E&P Net Income (Loss) ($ Millions) 916 1,055 1,225 1,052 4,248 1,349 1,852 1,606 181 4,988 Alaska ($ Millions) 507 535 765 448 2,255 603 700 556 456 2,315 Lower 48 ($ Millions) 409 520 460 604 1,993 746 1,152 1,050 (275) 2,673 Production Total U.S. (MBOE/D) 855 848 821 847 843 783 787 736 790 775 Crude Oil and Condensate (MB/D) Alaska 276 267 241 257 261 254 244 218 258 244 Lower 48 104 105 103 98 102 97 95 85 88 91 Total 380 372 344 355 363 351 339 303 346 335 Sales of crude oil produced (MB/D) 372 370 380 340 365 344 353 299 340 334 Natural Gas Liquids (MB/D)* Alaska 22 18 15 19 19 19 17 13 20 17 Lower 48** 68 71 73 106 79 69 76 74 75 74 Total 90 89 88 125 98 88 93 87 95 91 16 15 11 13 14 13 11 8 11 11 *Includes reinjection volumes sold lease-to-lease: Natural Gas (MMCF/D) Alaska 122 100 116 102 110 100 98 102 88 97 Lower 48 2,190 2,219 2,219 2,101 2,182 1,963 2,034 1,971 2,007 1,994 Total 2,312 2,319 2,335 2,203 2,292 2,063 2,132 2,073 2,095 2,091 Average Realized Prices Crude Oil and Condensate ($/bbl) Alaska North Slope 48.83 56.31 66.54 81.17 62.91 89.07 112.23 115.11 57.63 92.73 West Coast 55.50 63.26 73.57 87.88 69.75 95.47 118.88 121.51 64.13 99.23 Lower 48 49.32 58.50 67.77 78.98 63.49 90.35 118.06 112.36 49.36 92.77 Total U.S. 53.78 61.91 72.00 85.31 68.00 94.02 118.66 118.90 60.32 97.47 Natural Gas Liquids ($/bbl) Alaska 55.27 63.52 73.40 88.12 71.85 94.27 117.24 119.29 64.23 94.29 Lower 48*** 36.46 43.29 46.37 48.88 44.43 55.33 62.27 65.11 26.70 52.28 Total U.S. 37.86 44.17 47.73 51.23 46.00 58.33 65.96 68.84 30.61 55.63 Natural Gas ($/mcf) Alaska 4.19 4.04 2.15 4.12 3.68 4.31 3.81 4.36 4.90 4.38 Lower 48 6.21 6.51 5.38 5.88 5.99 7.67 9.74 8.67 4.76 7.71 Total U.S. 6.19 6.49 5.36 5.86 5.98 7.63 9.69 8.64 4.76 7.67 Kenai, Alaska LNG Sales Volume (MMCF/D) 104 72 88 78 85 63 72 89 74 74 Sales price per MCF 5.83 5.86 6.01 7.28 6.21 6.72 7.15 7.77 8.65 7.62 U.S. Exploration Charges ($ Millions) Dry Holes 13 36 19 14 82 25 20 6 137 188 Lease Impairments 43 43 43 40 169 42 40 43 65 190 Total Non-Cash Charges 56 79 62 54 251 67 60 49 202 378 Other (G&G and Lease Rentals) 26 40 57 50 173 39 50 42 61 192 Total U.S. Exploration Charges 82 119 119 104 424 106 110 91 263 570 Alaska Only 17 32 31 26 106 11 25 19 45 100 DD&A ($ Millions) Alaska 168 167 165 167 667 149 163 152 186 650 Lower 48 618 661 667 642 2,588 616 613 649 577 2,455 Total U.S. 786 828 832 809 3,255 765 776 801 763 3,105 **Fourth quarter of 2007 includes 22 MBD related to out-of-period adjustments for the first three quarters in 2007. The amounts attributable to Q1, Q2, and Q3 2007 were 5, 8, and 9 MBD, respectively. Fourth- quarter 2007 NGL production in L48 was 84 MBD excluding the adjustments. ***Fourth quarter of 2007 includes $6.36/bbl related to out-of-period adjustments for the first three quarters in 2007. The amounts attributable to Q1, Q2, and Q3 2007 were $1.64/bbl, $2.23/bbl, and $2.49/bbl, respectively. Fourth-quarter 2007 NGL realized price in L48 was $55.24/bbl excluding the adjustments. Page 6 of 12
  • 7. INTERNATIONAL E&P 2007 2008 1st Qtr 2nd Qtr 3rd Qtr 4th Qtr YTD 1st Qtr 2nd Qtr 3rd Qtr 4th Qtr YTD International E&P Net Income (Loss) ($ Millions) 1,413 (3,459) 857 1,556 367 1,538 2,147 2,322 969 6,976 Production Total, Including Equity Affiliates and Canadian Syncrude (MBOE/D) 1,165 1,062 938 988 1,037 1,011 963 1,012 1,077 1,014 Crude Oil and Condensate (MB/D) Consolidated Norway 179 145 166 158 162 153 145 164 163 156 United Kingdom 55 48 37 50 48 48 49 57 78 58 Canada 21 19 17 21 19 23 24 25 27 25 China 38 32 29 25 31 33 32 31 36 33 Indonesia 13 13 11 11 12 16 15 15 15 15 Vietnam 23 22 22 22 22 20 18 19 28 21 Timor Sea 24 26 21 19 22 23 21 22 20 22 Libya 45 47 48 47 47 47 48 42 50 47 Other 62 36 35 44 44 44 40 40 40 40 Equity affiliates Canada 23 28 29 27 27 29 25 32 35 30 Russia 15 15 15 16 15 16 16 31 32 24 Venezuela 82 85 - - 42 - - - - - Total 580 516 430 440 491 452 433 478 524 471 Sales of crude oil produced (MB/D) 577 506 423 452 489 429 450 477 513 467 Natural Gas Liquids (MB/D) Norway 8 5 7 12 8 13 11 9 11 11 United Kingdom 6 6 4 8 6 10 8 6 8 8 Canada 31 28 26 25 27 26 25 24 24 25 Timor Sea 12 14 11 12 12 15 14 15 13 14 Other 3 3 3 5 4 2 5 7 4 4 Total 60 56 51 62 57 66 63 61 60 62 Natural Gas (MMCF/D) Consolidated Norway 247 202 226 270 236 273 205 222 257 239 United Kingdom 785 668 519 723 673 695 623 581 757 664 Canada 1,152 1,133 1,069 1,073 1,106 1,101 1,055 1,061 1,001 1,054 China 11 12 13 8 11 10 9 - - 5 Timor Sea 243 250 194 207 223 246 231 266 236 245 Indonesia 331 329 349 310 330 314 360 361 336 343 Vietnam 15 12 19 14 15 16 16 21 11 16 Libya 5 9 9 9 8 9 9 6 9 8 Other 212 190 183 164 188 173 178 178 152 171 Equity affiliates Australia - - - - - - - - 45 11 Canada - - - - - - - - - - Russia - - - - - - - - - - Venezuela 9 9 - - 5 - - - - - Total 3,010 2,814 2,581 2,778 2,795 2,837 2,686 2,696 2,804 2,756 Canadian Syncrude (MB/D) 23 21 27 23 23 20 19 24 25 22 Darwin, Australia LNG Sales (MMCF/D) 388 449 347 348 383 417 396 464 460 434 Page 7 of 12
  • 8. INTERNATIONAL E&P (continued) 2007 2008 1st Qtr 2nd Qtr 3rd Qtr 4th Qtr YTD 1st Qtr 2nd Qtr 3rd Qtr 4th Qtr YTD Average Realized Prices Crude Oil and Condensate ($/bbl) Consolidated Norway 57.36 67.50 75.54 88.75 72.04 97.27 122.34 115.67 55.95 97.54 United Kingdom 55.52 66.99 72.98 86.26 71.01 93.96 118.79 107.54 51.14 90.67 Canada 48.70 58.42 67.75 73.08 61.77 84.49 108.43 99.77 34.36 80.18 China 54.93 66.39 71.79 85.51 67.69 93.69 120.63 111.93 46.41 91.51 Indonesia 54.66 65.46 72.46 89.26 69.99 92.48 109.83 108.47 53.08 90.98 Vietnam 57.88 67.03 75.14 89.64 72.54 98.31 126.11 122.45 54.02 96.57 Timor Sea 59.15 73.51 71.20 83.95 71.50 93.85 114.20 103.11 38.05 86.91 Libya 56.19 67.39 73.88 88.11 72.02 95.21 120.86 108.33 53.48 93.22 Other 55.73 67.71 74.48 87.54 69.76 97.56 119.35 103.59 49.23 92.82 Equity affiliates Canada 32.46 32.46 38.48 46.90 37.94 57.95 96.78 81.32 9.53 58.54 Russia 37.92 50.25 55.84 63.05 52.29 70.41 86.00 96.67 42.95 71.15 Venezuela 42.54 51.54 - - 47.46 - - - - - Total 53.12 62.02 70.75 83.94 66.44 91.96 117.49 107.99 47.84 90.01 Natural Gas Liquids ($/bbl) Norway 38.82 45.72 46.77 56.25 48.36 54.48 59.19 56.67 39.00 53.04 United Kingdom 34.93 39.34 36.91 52.79 41.78 55.88 66.90 60.43 28.48 53.65 Canada 41.15 46.82 51.77 66.27 50.85 68.84 83.57 77.49 35.19 66.40 Timor Sea 44.13 49.43 48.71 72.60 52.63 69.79 74.03 73.79 41.61 64.54 Other 8.32 29.42 34.00 42.30 31.17 13.83 43.22 49.69 21.19 35.91 Total 39.38 45.64 48.63 61.56 48.80 62.20 71.40 68.78 35.25 59.70 Natural Gas ($/mcf) Consolidated Norway 7.00 7.10 7.51 9.08 7.74 10.27 11.75 12.79 10.70 11.28 United Kingdom 8.14 7.23 6.69 9.19 7.92 9.20 10.48 10.20 11.07 10.26 Canada 6.38 6.60 5.13 6.20 6.09 7.81 10.19 8.03 5.56 7.92 China 2.64 2.74 2.78 3.37 2.85 3.60 3.69 - - 3.64 Timor Sea 0.76 0.68 0.66 0.74 0.71 0.79 0.90 0.97 1.17 0.96 Indonesia 6.04 6.99 7.78 8.51 7.31 10.33 12.14 12.35 6.17 10.36 Vietnam 1.10 1.09 1.12 1.13 1.11 1.14 1.12 1.13 1.16 1.13 Libya 0.07 0.09 0.09 0.09 0.09 0.09 0.09 0.09 0.09 0.09 Other 2.71 2.53 2.41 3.43 2.75 3.79 3.99 3.91 4.44 4.09 Equity affiliates Australia - - - - - - - - 2.04 2.04 Canada - - - - - - - - - - Russia - - - - - - - - - - Venezuela 0.29 0.30 - - 0.30 - - - - - Total 6.47 6.40 5.75 7.31 6.50 8.32 10.02 9.13 7.55 8.73 International Exploration Charges ($ Millions) Dry Holes 49 38 4 36 127 69 48 52 68 237 Lease Impairments 43 16 8 18 85 18 19 17 29 83 Total Non-Cash Charges 92 54 12 54 212 87 67 69 97 320 Other (G&G and Lease Rentals) 88 86 87 110 371 116 111 107 113 447 Total International Exploration Charges 180 140 99 164 583 203 178 176 210 767 DD&A ($ Millions) 1,016 962 996 1,162 4,136 1,181 1,164 1,322 1,256 4,923 Page 8 of 12
  • 9. R&M 2007 2008 1st Qtr 2nd Qtr 3rd Qtr 4th Qtr YTD 1st Qtr 2nd Qtr 3rd Qtr 4th Qtr YTD R&M Net Income (Loss) ($ Millions) 1,136 2,358 1,307 1,122 5,923 520 664 849 289 2,322 United States ($ Millions) 896 1,879 873 967 4,615 435 587 524 (6) 1,540 International ($ Millions) 240 479 434 155 1,308 85 77 325 295 782 Market Indicators U.S. East Coast Crack Spread ($/bbl) 11.81 22.57 11.73 8.47 13.64 7.79 10.93 10.43 5.66 8.70 U.S. Gulf Coast Crack Spread ($/bbl) 10.06 24.28 11.74 6.55 13.16 7.90 12.11 14.70 2.80 9.38 U.S. Group Central Crack Spread ($/bbl) 14.84 31.26 20.92 9.37 19.10 10.26 13.47 14.38 6.00 11.03 U.S. West Coast Crack Spread ($/bbl) 28.68 34.32 16.22 16.58 23.95 15.37 21.91 16.34 11.46 16.27 U.S. Weighted 3:2:1 Crack Spread ($/bbl) 15.30 27.56 14.74 9.65 16.81 9.94 14.19 14.07 5.89 11.02 NW Europe Crack Spread ($/bbl) 12.06 15.56 13.37 15.55 14.14 16.09 25.78 21.10 17.58 20.14 Singapore 3:1:2 Crack Spread ($/bbl) 14.06 17.94 14.80 17.13 15.98 19.90 29.35 19.10 13.01 20.34 U.S. Wholesale Gasoline Mktg Mrgn ($/bbl) 1.15 2.09 0.65 (0.43) 0.87 1.07 0.37 4.53 5.54 2.88 Realized Margins Refining Margin ($/bbl) U.S. 11.87 19.59 10.86 11.56 13.41 8.00 10.29 9.03 6.96 8.57 International 5.06 9.68 6.05 6.72 6.92 6.42 6.70 11.24 8.31 8.07 Marketing Margin ($/bbl)* U.S. 1.31 2.36 2.20 1.43 1.83 1.18 1.23 3.56 3.73 2.42 International 7.08 7.68 9.49 7.69 7.92 7.74 9.05 9.90 8.84 8.89 DD&A ($ Millions) 191 196 194 203 784 208 206 211 214 839 Foreign Currency Gains (Losses) After-Tax ($ Millions) - (2) - (11) (13) 38 (13) (127) (71) (173) Turnaround Expense ($ Millions) 75 58 27 80 240 90 170 73 70 403 Eastern U.S. Crude Oil Charge Input (MB/D) 411 404 383 412 402 340 405 412 390 387 Total Charge Input (MB/D) 460 447 414 453 443 400 441 450 445 434 Crude Oil Capacity Utilization (%) 97% 96% 91% 97% 95% 80% 96% 97% 92% 91% Clean Product Yield (%) 89% 86% 86% 90% 88% 89% 87% 86% 90% 88% U.S. Gulf Coast Crude Oil Charge Input (MB/D) 744 709 736 712 726 659 720 572 686 659 Total Charge Input (MB/D) 823 790 829 794 810 732 810 641 773 739 Crude Oil Capacity Utilization (%) 102% 97% 100% 97% 99% 90% 98% 78% 94% 90% Clean Product Yield (%) 81% 81% 80% 82% 81% 81% 76% 77% 82% 79% Western U.S. Crude Oil Charge Input (MB/D) 333 388 415 395 383 405 343 417 407 393 Total Charge Input (MB/D) 375 420 445 433 418 425 396 439 431 422 Crude Oil Capacity Utilization (%) 81% 94% 100% 95% 92% 97% 82% 100% 98% 94% Clean Product Yield (%) 79% 79% 80% 80% 80% 80% 78% 82% 82% 81% Central U.S. - Consolidated Crude Oil Charge Input (MB/D) 185 170 166 175 174 177 182 184 163 177 Total Charge Input (MB/D) 188 175 170 179 178 179 184 187 166 179 Crude Oil Capacity Utilization (%) 99% 91% 89% 94% 93% 95% 97% 98% 87% 94% Clean Product Yield (%) 88% 93% 88% 92% 90% 88% 89% 93% 91% 90% Central U.S. - Equity Affiliates - Net Share** Crude Oil Charge Input (MB/D) 265 225 280 267 259 225 241 228 239 233 Total Charge Input (MB/D) 288 250 301 288 282 241 258 246 253 250 Crude Oil Capacity Utilization (%) 96% 81% 101% 96% 94% 91% 97% 92% 96% 94% Clean Product Yield (%) 82% 85% 83% 84% 84% 84% 84% 85% 84% 84% TOTAL UNITED STATES Crude Oil Charge Input (MB/D) 1,938 1,896 1,980 1,961 1,944 1,806 1,891 1,813 1,885 1,849 Total Charge Input (MB/D) 2,134 2,082 2,159 2,147 2,131 1,977 2,089 1,963 2,068 2,024 Crude Oil Capacity Utilization (%) 95% 93% 97% 96% 96% 90% 94% 90% 94% 92% Clean Product Yield (%) 83% 83% 82% 84% 83% 83% 81% 83% 85% 83% Refined Products Production (MB/D) Gasoline 962 957 959 978 964 892 876 852 929 887 Distillates 762 736 779 795 768 719 775 743 791 757 Other 428 394 439 392 414 380 444 380 359 391 Total 2,152 2,087 2,177 2,165 2,146 1,991 2,095 1,975 2,079 2,035 Petroleum Products Sales (MB/D) Gasoline 1,258 1,300 1,212 1,207 1,244 1,070 1,127 1,089 1,227 1,128 Distillates 862 827 869 929 872 869 912 858 934 893 Other 480 503 439 309 432 384 404 365 342 374 Total 2,600 2,630 2,520 2,445 2,548 2,323 2,443 2,312 2,503 2,395 * Represents marketing sales price less product costs for all distribution channels other than commercial product supply. ** Represents a 50 percent interest in the Wood River refinery. Represents an 85 percent interest in the Borger refinery in 2007. Our ownership interest in the Borger refinery was reduced to 65 percent effective January 1, 2008. These refineries were contributed to a business venture with EnCana, effective January 1, 2007. Page 9 of 12
  • 10. R&M (continued) 2007 2008 1st Qtr 2nd Qtr 3rd Qtr 4th Qtr YTD 1st Qtr 2nd Qtr 3rd Qtr 4th Qtr YTD International - Consolidated* Crude Oil Charge Input (MB/D) 503 505 434 493 484 455 466 383 475 445 Total Charge Input (MB/D) 532 528 455 517 508 463 479 404 493 460 Crude Oil Capacity Utilization (%) 91% 92% 79% 89% 88% 82% 84% 69% 86% 81% Clean Product Yield (%) 68% 67% 71% 65% 68% 65% 69% 74% 71% 70% International - Equity Affiliates - Net Share** Crude Oil Charge Input (MB/D) 120 145 140 124 132 123 123 122 122 122 Total Charge Input (MB/D) 121 146 142 125 134 124 124 124 127 125 Crude Oil Capacity Utilization (%) 83% 101% 104% 106% 98% 104% 104% 103% 103% 104% Clean Product Yield (%) 77% 79% 81% 84% 80% 86% 83% 89% 85% 86% TOTAL INTERNATIONAL Crude Oil Charge Input (MB/D) 623 650 574 617 616 578 589 505 597 567 Total Charge Input (MB/D) 653 674 597 642 642 587 603 528 620 585 Crude Oil Capacity Utilization (%) 90% 93% 84% 92% 90% 86% 88% 75% 89% 85% Clean Product Yield (%) 70% 69% 74% 69% 70% 70% 72% 77% 74% 73% Refined Products Production (MB/D) Gasoline 160 159 160 160 160 129 155 148 170 151 Distillates 289 302 273 277 285 274 274 255 285 272 Other 195 203 160 196 188 171 163 120 155 152 Total 644 664 593 633 633 574 592 523 610 575 Petroleum Products Sales (MB/D) Gasoline 176 186 161 173 174 139 190 176 144 163 Distillates 381 379 328 366 363 321 324 324 336 326 Other 156 174 140 171 160 156 169 134 164 156 Total 713 739 629 710 697 616 683 634 644 645 Worldwide - Including Net Share of Equity Affiliates Crude Oil Charge Input (MB/D) 2,561 2,546 2,554 2,578 2,560 2,384 2,480 2,318 2,482 2,416 Total Charge Input (MB/D) 2,787 2,756 2,756 2,789 2,773 2,564 2,692 2,491 2,688 2,609 Crude Oil Capacity Utilization (%) 94% 93% 94% 95% 94% 89% 93% 87% 93% 90% Clean Product Yield (%) 80% 80% 80% 81% 80% 80% 79% 82% 82% 81% Refined Products Production (MB/D) Gasoline 1,122 1,116 1,119 1,138 1,124 1,021 1,031 1,000 1,099 1,038 Distillates 1,051 1,038 1,052 1,072 1,053 993 1,049 998 1,076 1,029 Other 623 597 599 588 602 551 607 500 514 543 Total 2,796 2,751 2,770 2,798 2,779 2,565 2,687 2,498 2,689 2,610 Petroleum Products Sales (MB/D) Gasoline 1,434 1,486 1,373 1,380 1,418 1,209 1,317 1,265 1,371 1,291 Distillates 1,243 1,206 1,197 1,295 1,235 1,190 1,236 1,182 1,270 1,219 Other 636 677 579 480 592 540 573 499 506 530 Total 3,313 3,369 3,149 3,155 3,245 2,939 3,126 2,946 3,147 3,040 * Represents our Humber refinery in the United Kingdom, the Whitegate refinery in Ireland, and our Wilhelmshaven refinery in Germany. ** Represents 18.75 percent interest in a refinery complex in Karlsruhe, Germany, and 47 percent interest in a refinery in Melaka, Malaysia. Through August 31, 2007, represents a 16.33 percent interest in two refineries in Kralupy and Litvinov, Czech Republic. We sold our interest in the two Czech refineries effective September 1, 2007. Page 10 of 12
  • 11. LUKOIL INVESTMENT 2007 2008 1st Qtr 2nd Qtr 3rd Qtr 4th Qtr YTD 1st Qtr 2nd Qtr 3rd Qtr 4th Qtr YTD LUKOIL Investment Net Income (Loss) ($ Millions) 256 526 387 649 1,818 710 774 438 (7,410) (5,488) Upstream Production* Net crude oil production (MB/D) 393 427 390 395 401 392 387 371 392 386 Net natural gas production (MMCF/D) 309 278 249 188 256 404 363 303 355 356 BOE Total (MBOE/D) 445 473 432 426 444 459 448 422 451 445 * Represents our estimated net share of LUKOIL's production. Industry Prices Crude Oil ($/bbl) Urals crude (CIF Mediterranean) 53.96 65.30 72.21 85.90 69.49 93.01 117.34 113.54 54.66 94.79 Downstream Refinery Throughput* Crude Processed (MB/D) 219 184 226 227 214 222 215 228 250 229 * Represents our estimated net share of LUKOIL's crude processed. MIDSTREAM 2007 2008 1st Qtr 2nd Qtr 3rd Qtr 4th Qtr YTD 1st Qtr 2nd Qtr 3rd Qtr 4th Qtr YTD Midstream Net Income ($ Millions) 85 102 104 162 453 137 162 173 69 541 U.S. Equity Affiliate ($ Millions)* 50 76 90 120 336 118 137 153 50 458 Natural Gas Liquids Extracted (MB/D) Consolidated United States 15 23 26 24 22 - - - - - International - - - - - - - - - - Equity Affiliates United States* 174 181 182 189 181 190 188 169 175 180 International 8 7 8 8 8 8 8 7 7 8 Total 197 211 216 221 211 198 196 176 182 188 * Represents 50 percent interest in DCP Midstream. Natural Gas Liquids Fractionated (MB/D) United States* 161 163 155 160 160 141 149 166 150 151 International 13 13 13 13 13 13 13 15 15 14 Total 174 176 168 173 173 154 162 181 165 165 * Excludes DCP Midstream. Product Prices Weighted Average NGL ($/bbl)* Consolidated 37.73 45.19 48.62 60.19 47.93 60.09 68.21 67.39 29.49 56.29 DCP Midstream 36.55 44.30 47.73 58.60 46.80 56.48 62.53 60.46 28.85 52.08 * Prices are based on index prices from the Mont Belvieu and Conway market hubs that are weighted by natural gas liquids component and location mix. DD&A ($ Millions) 4 3 4 3 14 2 1 2 1 6 Page 11 of 12
  • 12. CHEMICALS 2007 2008 1st Qtr 2nd Qtr 3rd Qtr 4th Qtr YTD 1st Qtr 2nd Qtr 3rd Qtr 4th Qtr YTD Chemicals Net Income (Loss) ($ Millions) 82 68 110 99 359 52 18 46 (6) 110 Industry Margins (Cents/Lb)* Ethylene industry cash margin 11.1 10.8 11.5 9.7 10.8 10.6 10.2 16.0 15.3 13.0 HDPE industry contract sales margin 13.5 14.6 14.8 13.6 14.1 14.9 15.0 23.4 22.5 19.0 Styrene industry contract sales margin 11.1 11.6 11.5 10.7 11.2 11.6 11.3 14.4 16.0 13.3 * Prices, economics and views expressed by CMAI are strictly the opinion of CMAI and Purvin & Gertz and are based on information collected within the public sector and on assessments by CMAI and Purvin & Gertz staff utilizing reasonable care consistent with normal industry practice. CMAI and Purvin & Gertz make no guarantee or warranty and assume no liability as to their use. EMERGING BUSINESSES 2007 2008 1st Qtr 2nd Qtr 3rd Qtr 4th Qtr YTD 1st Qtr 2nd Qtr 3rd Qtr 4th Qtr YTD Emerging Businesses Net Income (Loss) ($ Millions) (1) (12) 3 2 (8) 12 8 35 (25) 30 Detail of Net Income (Loss) ($ Millions) Power 13 (1) 21 20 53 27 26 53 - 106 Other (14) (11) (18) (18) (61) (15) (18) (18) (25) (76) Total (1) (12) 3 2 (8) 12 8 35 (25) 30 CORPORATE AND OTHER 2007 2008 1st Qtr 2nd Qtr 3rd Qtr 4th Qtr YTD 1st Qtr 2nd Qtr 3rd Qtr 4th Qtr YTD Corporate and Other Net Income (Loss) ($ Millions) (341) (337) (320) (271) (1,269) (179) (186) (281) (388) (1,034) Detail of Net Income (Loss) ($ Millions) Net interest expense (244) (224) (195) (157) (820) (108) (119) (149) (182) (558) Corporate overhead (23) (54) (49) (50) (176) (44) (68) (41) (49) (202) Acquisition-related expenses (13) (16) (11) (4) (44) - - - - - Other (61) (43) (65) (60) (229) (27) 1 (91) (157) (274) Total (341) (337) (320) (271) (1,269) (179) (186) (281) (388) (1,034) Before-Tax Net Interest Expense ($ Millions) Interest expense (395) (411) (485) (340) (1,631) (319) (324) (326) (362) (1,331) Capitalized interest 135 139 141 150 565 157 157 130 125 569 Interest revenue 31 24 153 38 246 72 14 28 14 128 Premium on early debt retirement (17) - - - (17) (14) - - (1) (15) (246) (248) (191) (152) (837) (104) (153) (168) (224) (649) Foreign Currency Gains (Losses) After-Tax ($ Millions) (14) (16) (35) (55) (120) (3) 41 (56) (54) (72) Debt Total Debt ($ Millions) 23,668 22,812 21,876 21,687 21,687 21,492 21,924 22,100 27,455 27,455 Debt-to-Capital Ratio 22% 21% 20% 19% 19% 19% 19% 19% 33% 33% Common Stockholders' Equity ($ Millions) 84,782 84,928 86,933 88,983 88,983 89,575 92,398 92,876 55,165 55,165 Page 12 of 12