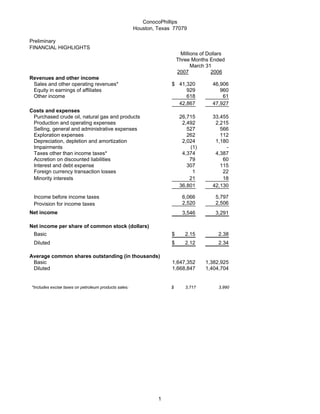
1. ConocoPhillips
Houston, Texas 77079
Preliminary
FINANCIAL HIGHLIGHTS
Millions of Dollars
Three Months Ended
March 31
2007 2006
Revenues and other income
Sales and other operating revenues* $ 41,320 46,906
Equity in earnings of affiliates 929 960
Other income 618 61
42,867 47,927
Costs and expenses
Purchased crude oil, natural gas and products 26,715 33,455
Production and operating expenses 2,492 2,215
Selling, general and administrative expenses 527 566
Exploration expenses 262 112
Depreciation, depletion and amortization 2,024 1,180
Impairments (1) -
Taxes other than income taxes* 4,374 4,387
Accretion on discounted liabilities 79 60
Interest and debt expense 307 115
Foreign currency transaction losses 1 22
Minority interests 21 18
36,801 42,130
Income before income taxes 6,066 5,797
2,520 2,506
Provision for income taxes
Net income 3,546 3,291
Net income per share of common stock (dollars)
Basic $ 2.15 2.38
Diluted $ 2.12 2.34
Average common shares outstanding (in thousands)
Basic 1,647,352 1,382,925
Diluted 1,668,847 1,404,704
*Includes excise taxes on petroleum products sales: $ 3,717 3,990
1
2. ConocoPhillips
Houston, Texas 77079
Preliminary
SELECTED FINANCIAL DATA
Millions of Dollars
Three Months Ended
March 31
2007 2006
SUMMARY OF NET INCOME (LOSS)
E&P
United States $ 916 1,181
International 1,413 1,372
Total E&P 2,329 2,553
Midstream 85 110
R&M
United States 896 297
International 240 93
Total R&M 1,136 390
LUKOIL Investment 256 249
Chemicals 82 149
Emerging Businesses (1) 8
Corporate and other (341) (168)
Consolidated $ 3,546 3,291
2
3. ConocoPhillips
Houston, Texas 77079
Preliminary
SELECTED FINANCIAL DATA
Three Months Ended
March 31
2007 2006
Effective tax rate % 41.5 % 43.2
Millions of Dollars
FOREIGN CURRENCY GAINS (LOSSES)
AFTER-TAX
E&P $ 17 7
Midstream - -
R&M - 6
LUKOIL Investment - -
Chemicals - -
Emerging Businesses - -
Corporate and other (14) (8)
$ 3 5
CASH FLOWS FROM OPERATING ACTIVITIES
Net Income $ 3,546 3,291
Depreciation, depletion and amortization 2,024 1,180
Impairments (1) -
Dry hole costs and leasehold impairments 148 38
Accretion on discounted liabilities 79 60
Deferred taxes 77 168
Undistributed equity earnings (557) (67)
Net gain on asset dispositions (499) (3)
Other (94) (203)
Working capital adjustments 2,150 336
Net cash provided by operating activities $ 6,873 4,800
CAPITAL EXPENDITURES AND INVESTMENTS
E&P
United States $ 843 419
International 1,727 1,787
2,570 2,206
Midstream - 1
R&M 205 1,635
LUKOIL Investment - 612
Chemicals - -
Emerging Businesses 31 12
Corporate and other 41 48
$ 2,847 4,514
OTHER
March 31, December 31,
2007 2006
Total debt $ 23,668 27,134
Common stockholders' equity $ 84,782 82,646
3
4. ConocoPhillips
Houston, Texas 77079
Preliminary
OPERATING HIGHLIGHTS
BY SEGMENT
Three Months Ended
March 31
2007 2006
Thousands of Barrels Daily
E&P
Crude oil produced
United States
Alaska 276 283
Lower 48 104 64
380 347
Norway 179 188
United Kingdom 55 62
Canada 21 22
China 38 25
Indonesia 13 14
Vietnam 23 31
Timor Sea 24 39
Libya 45 -
Other 62 49
Total consolidated 840 777
Equity affiliates
Canada 23 -
Russia 15 16
Venezuela 82 110
Total Worldwide 960 903
Syncrude 23 16
Natural gas liquids produced
United States
Alaska* 22 22
Lower 48 68 29
90 51
Norway 8 11
Canada 31 9
Timor Sea 12 20
Other 9 6
Total Worldwide 150 97
16 14
*Includes reinjected volumes sold lease-to-lease.
Millions of Cubic Feet Daily
Natural gas produced*
United States
Alaska 122 163
Lower 48 2,190 1,264
2,312 1,427
Norway 247 269
United Kingdom 785 851
Canada 1,152 424
China 11 -
Timor Sea 243 144
Indonesia 331 294
Vietnam 15 24
Libya 5 -
Other 212 121
Total consolidated 5,313 3,554
Equity affiliates
Venezuela 9 11
Total Worldwide 5,322 3,565
*Represents quantities available for sale. Excludes
gas equivalent of NGL shown above.
Liquefied natural gas sales 492 264
LUKOIL Investment
Production (MBOE/D)* 445 322
Refinery crude oil throughput (MB/D)* 219 163
*Represents our estimated net share of LUKOIL.
4
5. ConocoPhillips
Houston, Texas 77079
Preliminary
OPERATING HIGHLIGHTS
Three Months Ended
March 31
2007 2006
E&P
Per Unit
Average sales prices
Crude oil (per barrel)
United States
Alaska $ 55.50 58.87
Lower 48 49.32 52.21
Total U.S. 53.78 57.70
International 56.29 60.08
Total consolidated 55.17 58.97
Equity affiliates* 40.02 43.38
Total Worldwide 53.38 56.63
Natural gas (per MCF)
United States
Alaska 4.19 3.58
Lower 48 6.21 7.50
Total U.S. 6.19 7.42
International 6.49 7.16
Total consolidated 6.36 7.26
Equity affiliates* 0.48 0.23
Total Worldwide 6.35 7.24
*Excludes our equity share of LUKOIL reported in the LUKOIL Investment segment.
Midstream
Thousands of Barrels Daily
Natural gas liquids extracted
Consolidated
United States 15 23
International - -
Equity affiliates
United States 174 178
International 8 6
197 207
Per Barrel
U.S. product prices
Weighted average NGL**
Consolidated $ 37.73 37.64
DCP 36.55 37.29
**Prices are based on index prices from the Mont Belvieu and Conway market hubs that are
weighted by natural-gas-liquids component and location mix.
5
6. ConocoPhillips
Houston, Texas 77079
Three Months Ended
March 31
2007 2006
Thousands of Barrels Daily
R&M
United States
Crude oil capacity 2,033 2,208
Crude oil runs 1,938 1,840
Refinery production 2,152 1,988
International*
Crude oil capacity 696 523
Crude oil runs 623 490
Refinery production 644 500
U.S. petroleum products outside sales
Gasoline 1,258 1,258
Distillates 862 813
Other products 480 517
2,600 2,588
International 713 695
3,313 3,283
Per Gallon
U.S. average sales prices**
Gasoline-wholesale $ 1.86 1.79
Gasoline-retail 2.03 1.90
Distillates-wholesale 1.94 1.89
*Includes ConocoPhillips' share of equity affiliates, except for our share of LUKOIL, which is reported in
the LUKOIL Investment segment.
**Excludes excise taxes.
6