

Recomendados
Mais conteúdo relacionado
Último
Último (20)
Destaque
Destaque (20)
Russian market opportunities 2011
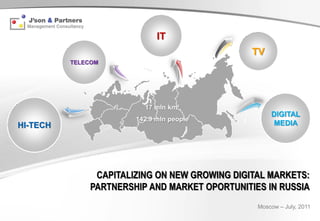
- 1. IT TV TELECOM 17 mln km² DIGITAL 142.9 mln people HI-TECH MEDIA CAPITALIZING ON NEW GROWING DIGITAL MARKETS: PARTNERSHIP AND MARKET OPORTUNITIES IN RUSSIA Moscow – July, 2011
- 2. Content RUSSIAN ECONOMIC INDICATORS 4 CELLULAR COMMUNICATIONS 9 DIGITAL DEVICES 10 RUSSIAN INTERNET ACCESS 12 ONLINE GAMES 14 SOCIAL NETWORKS 15 INTERNET MEDIA MARKET 17 RUSSIAN PTV & TV MARKET 18 FILM DISTRIBUTION MARKET 21 DVD MARKET 22 PARTNERSHIP & MARKET OPPORTUNITIES IN RUSSIA 24 ANNEX 28 DESIGNED BY J’SON & PARTNERS 2
- 3. Content Top Ten Russian cities by Population 4 Socio-economic indicators of Russia 5 1. General information: Russian Telecom Operators Revenue, bn USD 6 Digital Devices in Russian Households 7 Cellular Business 9 Digital Devices Sales, 2010 10 Russian Internet Access vs. World 12 Russian Online Games Market 14 Russian Social Networks 15 Russian Social Networks, Income (%), 2010 16 2. Market overview: Advertising volume in Russia vs. World 17 Russian TV & video Markets Development Forecast 18 Russian PTV market potential and forecast 19 Russian TV market 20 Movie Theatre Market in Russia 21 DVD market in Russia 22 Content distribution opportunities in Russia 24 3. Partnership & Market Potential strategy 25 Opportunities In Russia Partnership structure 26 Key Russian market players: Telecom Operators 28 Key Russian market players: Pay TV market, 2010 29 Key Russian TV Channels and niches 30 Key Russian market players: TV holdings and owners 31 4. Annex: Key Russian market players: Web TV 32 Key Russian market players: Russian TV channels 33 Key Russian market players: Internet Portals 34 Key Russian market players: Russian TOP 4 social networks 35 Our Clients 37 5. About us: Our Clients About Us 38 DESIGNED BY J’SON & PARTNERS 3
- 4. GENERAL INFORMATION © Franz Steiner DESIGNED BY J’SON & PARTNERS 4
- 5. 1. General information: Top Ten Russian cities by Population 1. Moscow - 11,514,300 2. St.Petersburg - 4,848,700 3. Novosibirsk - 1,473,700 4. Yekaterinburg - 1,350,100 5. Nizhny Novgorod - 1,250,600 6. Samara - 1,164,900 St.Petersburg Moscow 17 mln km² Nizhny Novgorod Rostov-On-Don Kazan 142.9 mln people Samara Yekaterinburg Chelyabinsk Omsk Novosibirsk 7. Omsk - 1,154,000 8. Kazan - 1,143,600 9. Chelyabinsk- 1,130,300 10. Rostov-On-Don - 1,089,900 DESIGNED BY J’SON & PARTNERS 5
- 6. 1. General information: Socio-economic indicators of Russia RUSSIAN ECONOMIC INDICATORS 2004 2005 2006 2007 2008 2009 2010 2011E 2012E POPULATION OF RUSSIA (WITHOUT MIGRATION), MLN PEOPLE 144.2 143.5 142.8 142.2 142 141.9 142.9* 141.5 141.1 NOMINAL GDP, BN USD 591.1 763.6 990.5 1298.7 1660.4 1218.6 1478.3 1850 2050 REAL GDP GROWTH, % 7.2 6.4 8.2 8.5 5.2 -7.8 (-7) 4 (5) 4.8 4 GDP PER CAPITA, THOUSAND USD 4.10 5.32 6.94 9.13 11.69 8.59 10.34 13.07 14.53 THE GROWTH OF REAL OUTPUT, % 7.3 4 7.1 6.8 0.6 -9.3 8.2 5 4.5 PROFICIT Δ / Δ BUDGET DEFICIT, % 4.2 7.7 7.3 5.4 4.1 -5.9 -4 -0.8 -2.1 STABILIZATION FUND, BN USD 18.8 43.7 89.1 156.8 225.1 152.1 113.8 98.8 68.8 UNEMPLOYMENT,% 8.2 7.6 7.2 6.5 6.2 8.4 7.5 6.8 6.8 EXTERNAL PUBLIC DEBT AT END OF PERIOD, BN USD 105.6 82.3 49 46.4 32.7 44.3 46.6 46.8 50 EXTERNAL PRIVATE DEBT AT END OF PERIOD, BN USD 108.9 176.1 260.7 419 452 425.4 442.1 470 490 TOTAL EXTERNAL DEBT / GDP, % 33.7 30.6 29.2 32.2 30.5 39.2 32.4 27.2 25.8 AVERAGE EXCHANGE RATE USD / RUB 28.8 28.3 27.2 25.6 24.9 31.8 30.4 28 27.8 Sources: Federal State Statistics, Central Bank, Troika Dialog * According to the National Population Census '2010 Market Size: > 102 Millions Age Group (years) AGE GROUP The Russian economy is steadily growing. Despite the POPULATION % OF POPULATION crisis of 2009, strong macroeconomic indicators (such as (YEARS) 14% 16% GDP and industrial production growth, an impressive 0-14 22 661 721 15.68 amount of the stabilization fund, low debt, including 15-34 42 346 200 29.30 29% national one, and relatively low unemployment rate) show 41% 35-64 59 718 259 41.32 stability and great development potential of the economy of the country. 65+ 19 800 100 13.70 TOTAL 144 526 280 100.00 0-14 15-34 35-64 65+ DESIGNED BY J’SON & PARTNERS 6
- 7. 1. General information: Russian Telecom Operators Revenue, bn USD 24,5 22,8 20 2 008 2 009 2 010 7,3 4,8 5,5 4,9 4,5 4,5 2,3 3,0 2,2 0,9 1 1,2 Cellular Handsets Fixed telephony Internet PTV Cellular communication in Russia remains the international "showcase" of the telecommunications market. Revenues from wireless communication in Russia (along with the strong sales growth of cellular phones and digital devices) is 5 times higher than the revenues from the fixed one. DESIGNED BY J’SON & PARTNERS 7
- 8. 1. General information: Digital Media Market in Russia Video Services Market volume in Russia, 2010-2016*, mln USD 8331 Promising segments 7054 3592 3527 30063169 2310 18481940 1658 1646 1916 1249 1300 1167 743 859 775 618 567 544 589 250 305 320 53 18 280 41 1 FTA Advertising PTV Subscribtion PTV Channels PTV Advertising Broadband Internet Advertising Internet Video Paid Internet Video Theaters Licensed DVD Sales Subscribtion Subscribtion Advertising Services 2010 2016 (1) 2016 (2) * - BTV (free-air TV) - 20 current air channels, RPTV (advanced pay-TV) - non-air local and pay TV channels, including social TV networks; 2016 (1) - conservative scenario, 2016 (2) - optimistic scenario Russia follows general international trends increasing rapidly high-speed Internet Technologies; Smartphones, laptops, tablets and other digital devices sales; consumption of new video, audio, gaming and social services. Russia at nowadays be considered as a newly-formed digital platform with a high market potential for all types of digital content production and distribution locally and in partnership with strong world`s market leaders. DESIGNED BY J’SON & PARTNERS 8
- 9. 1. General information: Digital Devices in Russian Households 10 households or 27 people in Russia have: 42.5 SIM cards 18.5 cell phones, purchased over the last three years 2.3 smartphones 6.6 apartment phones 3.4 computers with broadband Internet access 0.8 iPads 3.1 TV sets, connected to pay TV 7.2 active users of social networking DESIGNED BY J’SON & PARTNERS 9
- 10. MARKET OVERVIEW © Franz Steiner DESIGNED BY J’SON & PARTNERS 10
- 11. 2. Market overview: Cellular Business Cellular penetration & Subscriptions by Counties, 2009 Mobile content market growth by Countries, 2010 1400 1330 147% 160% Russia 26% 1170 127% 1200 140% India 23% 112% 120% Germany 19% 1000 92% 93% 95% Canada 16% 747 100% 800 USA 14% World 13% 80% 600 525 60% France 12% 57% Japan 400 286 307 11% 45% 40% 210 China 9% 200 116 127 105 82 142 60 62 51 47 20% South Korea 9% 0 0% Brazil 9% India China Japan USA France Spain Germany Russia Sources: J’son & Partners Consulting Subscribers, mln City population, mln people Cellular penetration, % Russia is the №1 in growth rates among major countries in terms of mobile content market in 2010. Cellular operators revenue by countries, 2009 (bn USD) Mobile content market volume by countries, 2010 4500 3852 4048 4500 185,6 4000 292 4000 3168 878 3500 3500 3000 3000 125,3 944 2500 2500 1720 1722 2965 2000 1432 2000 73,6 1217 869 1500 928 1010 295 1500 188 90 286,3 668 347 31,2 1000 1000 26,5 26,6 252 265 21 20 403 1031 701,5 116 1167 560 500 372 906 500 123 88 85,9 642 0 231 0 180 253 143,2 India China Japan USA France Spain Germany Russia France Germany India Russia South Korea Japan USA China Video and TV Graphic content Audio, RBT, and audiobooks Games DESIGNED BY J’SON & PARTNERS 11
- 12. 2. Market overview: Digital Devices Sales, 2010 Value of mobile handsets market, bn USD Volume of mobile handsets market, mln units 8,0 8,0 6,8 7,0 6,3 7,0 45,0 40 41 45,0 5,8 38,5 6,0 6,0 40,0 35,5 40,0 4,9 2,5 4,5 35,0 28,9 35,0 5,0 2,7 5,0 30,0 30,0 2,8 26,2 4,0 4,0 25,0 27,6 25,0 28,9 3,0 3,4 3,0 20,0 31,6 20,0 3,6 27,1 4,3 15,0 15,0 2,0 3,6 2,0 2,9 10,0 10,0 1,0 1,0 12,4 14,8 1,5 5,0 9,6 5,0 0,8 1,9 3,9 0,0 0,0 0,0 0,0 2009 2010 2011 2012 2013 2009 2010 2011 2012 2013 Smartphones Other handsets All handsets Smartphones Other handsets All handsets Smartphones sales in Russia 3G-USB Modems Sales in Russia 16 4,3 4,5 14 3,6 4,0 14 0,33 0,36 0,36 0,35 0,34 0,4 12 0,35 12 2,9 3,5 3,0 10 0,23 0,3 10 0,25 2,5 8 8 0,15 0,2 1,5 2,0 6 0,12 6 0,15 0,8 1,5 4 0,1 4 1,0 2 0,9 3,2 7 11,3 12,7 12,9 12,6 12,4 0,05 2 4 10 12 15 0 0 0,5 2 0 0,0 2008A 2009A 2010E 2011F 2012F 2013F 2014F 2015F 2009 2010 2011 2012 2013 USB-modems, mln units USB-modems, bn USD mln units bn USD DESIGNED BY J’SON & PARTNERS 12
- 13. 2. Market overview: Digital Devices Sales, 2010 Tablet PC sales in Russia, 2010 The structure of the mobile phone market by producers, 2010 Sales, thousand units Sales, thousand units Units USD 6,8 8,4 2% 7,8 4,2 3,8% 0,5% 6,9% 4,1% 12,5% 7,7% 35,8% 40,2% 8,2% Nokia 12,0% Apple Samsung Samsung 386,1 267,1 LG Other 31,2% SonyEricsson 35,1% Apple Total Total Other НТС NetBooks & Notebooks sales in Russia, 2010 Sales volume and structure of the smartphone market in Russia, 2010 Sales, thousand units Sales, mln USD 0,8% 0,2% 4,5% 4,2% 6% 1358 1197 956 11,4% 1076 26,3% ASUS 1,48 bn USD 8,3% 3.93 mln 545 ACER 401 units 1092 732 SAMSUNG 66,7% Symbian 660 71,6% HEWLETT PACKARD 632 Windows Mobile 1046 712 LENOVO Android Other Apple Total Total Other DESIGNED BY J’SON & PARTNERS 13
- 14. 2. Market overview: Russian Internet Access vs. World Fixed Broadband Internet Penetration in Russia and selected countries, 2010 Mobile Broadband Internet Penetration in Russia and selected countries, 2010 100% 434,6 86% 88% 500,0 233,0 77% 75% 250,0 90,0% 90% 450,0 68% 71% 72% 64% 80,0% 80% 400,0 165,4 200,0 70% 350,0 70,0% 60% 300,0 47% 60,0% 36% 38% 150,0 50% 36% 250,0 37% 50,0% 40% 200,0 97,7 54% 40,0% 30% 118,9 100,0 22% 26% 17% 30% 150,0 30,0% 20% 52,9 40,8 45,5 100,0 29,7 25,8 7,6 50,0 22,5 22,6 20,0% 10% 3,4 50,0 21,3 6,3 3,6 31,3 10,0% 0% - 0,0 0,0% Total number of households Penetration, % Subscriptions, mln Penetration (per 100 inhabitants), % Russian Fixed Broadband Internet Penetration Forecast Russian Mobile Internet access Forecast 65% 93,7 40,0 61% 70% 100 88,9 1,8 55% 90 75,4 66% 1,6 35,0 50% 60% 80 63% 1,4 30,0 43% 50% 70 57,6 53% 1,2 25,0 36% 60 41% 1 29% 40% 50 41,1 87% 93% 20,0 24% 31,3 74% 0,8 31,9 34,3 30% 40 24 17% 24,6 29% 15,0 26,2 29,2 30 55% 0,6 22,9 20% 42% 17% 22% 19,3 0,4 32% 10,0 20 15,6 28% 26% 5,0 12,8 10% 10 0,2 0 0 0,0 0% 2008 2009 2010 2011 2012 2013 2014 2015 2008 2009 2010 2011 2012 2013 2014 2015 Total number of households Penetration*, % Number of users, million Share of Fixed Internet access subs using Mobile Internet Mobile penetration, % *Penetration of fixed broadband, fixed WiMAX and fixed Wi-Fi access in Russia in households DESIGNED BY J’SON & PARTNERS 14
- 15. 2. Market overview: Russian Internet Access vs. World Fixed Broadband Internet Penetration in the World Biggest Cities, 2010 Internet Active Users Audience in Russia, 2008-2015 120,0 68,6% 69,7% 80,0% 64,1% 58,4% 70,0% 100,0 53,0% 60,0% 80,0 44,6% 50,0% 37,2% 60,0 30,9% 40,0% 30,0% 40,0 20,0% 20,0 10,0% 0,99 0,99 0,97 0,96 0,96 0,92 0,89 0,87 0,76 0,62 44,3 53,3 63,7 75,6 83,2 91,1 97,3 98,6 0,0 0,0% 2008 2009 2010E 2011F 2012F 2013F 2014F 2015F Number of users, million Internet users penetration, % Moscow and St. Petersburg occupy 30% of the internet market in Russia. The level of internet penetration in large cities of Russia is comparable to the world capitals level. Moscow St. Petersburg Internet penetration in Russia is increasing rapidly Russian Government has ambitious plans to increase internet penetration up to 100% within 5 years DESIGNED BY J’SON & PARTNERS 15
- 16. 2. Market overview: Russian Online Games Market Online Games Market Volume in Russia and Selected Countries, 2010 The number of online games users in Russia and selected countries, 2010 140,0 $6,00 124 $5,02 120,0 $4,61 $5,00 100,0 87 $4,00 81 80,0 66 $3,00 57 60,0 47 $1,26 $1,31 $2,00 40,0 27 30 22 $0,49 14 17 16 9 $1,00 20,0 27,3 73,64 111,9 118,8 3 1 - 17,9 $- Russia South Korea Japan China USA Russia USA China South Korea Japan The number of users million people. Market volume, billion USD MMO games Casual Social network games Russian online games market Forecast, 2008-2015 Popular Russian online games, 2010 $1,32 5% 4% $1,40 60,0 $1,16 Legenda: Nasledie Drakonov $1,20 $1,00 50,0 5% 23% Geroi voini I deneg $0,84 5% Lineage 2 $1,00 48,1 40,0 $0,80 $0,67 43,5 6% Perfect World 38,1 $0,49 30,0 Boitsovskii Club $0,60 31,6 World of Warcraft $0,29 25,1 20,0 14% Troetsarstvie $0,40 $0,15 17,9 23% Wizards World 10,0 $0,20 12,1 $- 2,0 0,0 Territoria 2008 2009 2010 2011 2012 2013 2014 2015 16% TimeZero 17% The number of users, million people. Market volume, billion USD DESIGNED BY J’SON & PARTNERS 16
- 17. 2. Market overview: Russian Social Networks Social networks penetration in Russia and selected countries, 2010 Social networks market volume in Russia and Selected Countries, 2010 185,3% 400,0 353,4 200,0% 153,3% 180,0% bln USD 2,22 350,0 136,7% 160,0% 300,0 140,0% 1,96 250,0 120,0% 200,0 175,9 100,0% 58,2% 80,0% 1,07 38,6% 150,0 60,0% 100,0 37,5 39,7 40,0% 0,32 0,31 50,0 17,6 20,0% 0,0 0,0% China Russia USA Japan South Korea South Korea Russia Japan China USA Number of Internet users, million Penetration, % Number of social network users in Russia, 2009-2015 Russian social networks market volume, 2009-2015 1,51 80,0 90% 77% 69% 73% 80% 67% 70,0 62% 1,23 58% 70% 60,0 55% 50,0 60% 0,97 50% 40,0 0,74 40% 30,0 0,53 30% 20,0 20% 0,31 10,0 0,11 31,0 37,5 49,7 58,3 65,3 72 76 10% 0,0 0% 2009 2010E 2011F 2012F 2013F 2014F 2015F 2009 2010E 2011F 2012F 2013F 2014F 2015F Social networks market volume, bn USD Number of social network users, million Share of Internet users who uses social networks from the total number of Internet users,% DESIGNED BY J’SON & PARTNERS 17
- 18. 2. Market overview: Russian Social Networks, Income (%), 2010 3% 24% 32% 11% 11% 26% 49% 59% 63% 60% 83% 69% 49% 97% 4% 38% 53% 89% 30% 17% 20% 25% 20% 47% 10% 24% 7% 30% 23% vkontakte.ru my.mail.ru odnoklassniki.ru livejournal.com liveinternet.ru 17% 10% World USA China Southern Korea Japan Russia Games and applications Payment services Advertisement Games and applications Payment services Advertisement Socio-demographic categories of Russian social networks users Age categories, % Gender structure, % 12-17 18-24 25-34 35-44 >45 Women Men 5.0% 32.8% 40.5% 14.1% 7.6% 52.0% 48.0% DESIGNED BY J’SON & PARTNERS 18
- 19. Источник: PricewaterhouseCoopers LLP, Wilkofsky Gruen Associates 2. Market overview: Advertising volume in Russia vs. World Advertising market volume in Russia, 1Q 2011, mln USD Internet advertising market volume in Russia and selected countries, bn USD 23,3 120 106 1,7 236,7 2,1 91,5 1,3 2,8 8% 77,2 1,9 24,8 6% 0,9 2,4 5% 63,1 1,5 21,6 243,3 0,6 1,3 18,5 2,1 1,8 0,8 0,7 15,4 46,2 950 1,5 39,9 95% 12,2 33,6 281,7 94% 27,6 92% 22,1 35,8 40,4 44,5 26,6 31,1 73,3 2008 2009 2010 2011 2012 TV Radio Advertising market Print Media Outdoor advertising USA Europe, Middle East and Africa Asia-Pacific Latin America Canada Russia Internet advertising market Sources: PricewaterhouseCoopers LLP, Wilkofsky Gruen Associates Internet Others The growth rates of Internet advertising market, 2007-2012 The growth rates of Internet advertising market, 2007-2012 3,53 2,85 0,21 2007 37% 8% 39% 16% 100% 0,22 2,24 0,18 World 2012 40% 14% 28% 17% 100% 1,70 0,15 2,18 1,26 1,75 2007 22% 22% 11% 58% 9% 100% 0,76 0,92 1,34 0,65 Germany 2012 21% 21% 19% 52% 8% 100% 1,00 0,72 0,37 0,35 0,52 0,78 0,91 0,34 0,31 0,41 0,52 0,65 2007 48% 5% 22% 25% 100% 0,24 2008 2009 2010 2011 2012 2013 2014 2015 Russia 2012 54% 16% 13% 17% 100% Others Print media Internet TV Unusual placement and campaigns Video advertising Сontextual advertising Media (banner advertisement) Sources: ZenithOptimedia, J’son & Partners Consulting Sources: market players information, AKAR, ZenithOptimedia, J'son & Partners Consulting Russia is № 1 in terms of growth rates of internet advertising Last year, Russia became the fastest-growing online advertising market in the BRICS, overtaking China, India and Brazil. The Russian Internet advertising market grew by 42% in 2010 in comparison to 2009, while China grew by 35% and in India and Brazil by 30% each. Online context advertising increased its share from 53.7% in 2009 to 56.1% in 2010. DESIGNED BY J’SON & PARTNERS 19
- 20. 2. Market overview: Russian TV & video Markets Development Forecast Changes in Russian TV/Video Watching Time*, % TV, Video, Internet Services Penetration Forecast in Russia, % 1% 3% 82% 83% 9% 6% 9% 12% 80% 11% 15% 17% 79% 19% 21% 74% 76% 63% 24% 61% Web TV 72% 60% 56% 59% 57% 53% 60% DVD 54% 39% 46% 88% 86% 24% 31% 67% 70% 82% 78% 18% 57% 62% 73% 68% PTV 44% 51% 62% 37% 48% 52% 55% 58% 60% FTA 41% 45% 98% 98% 98% 98% 98% 98% 98% 2010 2011 2012 2013 2014 2015 2016 2010 2011 2012 2013 2014 2015 2016 FTA PTV Broadband Web TV DVD Cinema Web TV Penetration in Russia (% of population) Market Forecast of paid online video 14,6% 85 45 13,2% 16,0% 90 76 70% 11,1% 40 14,0% 80 66 60% 35 41 55 70 12,0% 60% 50% 30 8,7% 44 60 10,0% 53% 6% 29 40% 25 34 50 46% 4,9% 8,0% 25 4% 40 20 30% 30 39% 15 6,0% 20 31% 20% 10 2,1% 17 4,0% 10 18% 24% 10% 4 1,7 2,0% 0,72 5 0 0% 0 9 0,0% 2010 2011 2012 2013 2014 2015 2016 2009 2010 2011 2012 2013 2014 2015 2016 The audience Web TV, mln people Penetration of Web TV, % Internet video advertising Market share on Internet video advertising DESIGNED BY J’SON & PARTNERS 20