D5.2 Baseline analysis of agri-environmental trends, impacts and vulnerabilities
1. enviroGRIDS – FP7 European project
Building Capacity for a Black Sea Catchment
Observation and Assessment supporting Sustainable Development
Title Baseline analysis of agri-environmental trends, impacts and
vulnerabilities
Creator Hong Yang (Eawag)
Creation date 15.05.2011
Date of revisions 15.05.2011
Subject Agricultural production trend, environmental status, agricultural
water use, environmental impacts, bio-technology
Status Final
Type Word document
Description Data compiling, data base building, baseline setup
Contributor(s)
Hong Yang, Karim Abbapour, Monica Dumitrascu, Dan Balteanu,
Ana Popovici, Diana Dogaru, Ines Grigorescu, Volodymyr
Medinets, Yevgen Gazyetov, Tatiana Korzun, Denys Lebediev
Rights Public
Identifier EnviroGRIDS (D5.2)
Language English
Relation Build the basis for the modeling analysis of the agri-
environmental trends in the Black Sea basin (D5.2)
Abstract
The document contains an overview of the agricultural production and environmental
status, data collection and initial processes, and identification of major drivers of
agriculture and environment trend. The time horizon of the report is the period 1990-
2010. The information and the analysis in this report are mainly at the country level.
-
1
2. enviroGRIDS – FP7 European project
Building Capacity for a Black Sea Catchment
Observation and Assessment supporting Sustainable Development
Executive Summary
The aim of D5.2 is to lay a basis for the modeling analysis of agri-environmental trend in
the Black Sea region. D5.2 is the outcome of the first part of WT5.3 Agriculture. The
second part of WT5.3 will feed the data and information from the first part to the GEPIC
(or SWAT) model to analyze the agri-environment under the status quo conditions and
under different scenarios concerning changes in various influencing factors. The outcome
of the second part of WT5.3 will be reported in D5.5 (month 36). The current report
(D5.2) contains an overview of the agricultural production and environmental status, data
collection and initial processes, and identification of major drivers of agriculture and
environment trend. The time horizon of the report is the period 1990-2010. The
information and the analysis in this report are mainly at the country level.
The raw data for the modeling analysis of the Black Sea region’s agri-environmental
trend will be partially provided by WP3 and WP4. However, a substantial part of the base
data is collected by the partners involved in WT5.3, i.e., Eawag, IGAR and OUN. The
information collected by these partners mainly concerns the anthropogenic aspects of
agricultural and environmental data. This is complementary to the data provided by WP3
and WP4 where land use and hydrological information mainly concern the physical
statues of the elements with their natural boundaries or on grid cell scale. The data
collected by the partners in WT5.3 cover the following aspects: landuse structure, water
use in agriculture, agricultural population, irrigation areas, fertilizer production and
consumption, crop areas and production, agricultural trade, rural labor force, and social-
economic statistics.
The Black Sea catchment area covers entirely or partially 23 countries. Of which, six
countries are located in its coastal zone and 17 countries are closely linked with the sea
via the rivers that flow into the sea. In this report, we focus on the countries located in the
-
2
3. enviroGRIDS – FP7 European project
Building Capacity for a Black Sea Catchment
Observation and Assessment supporting Sustainable Development
coastal zone with a substantial part of the national territories falling within the Black Sea
catchment. The countries included are: Romania, Ukraine, Turkey, Bulgaria and Georgia.
As the agroecosystems and farming conditions within the region vary widely, the
baseline analysis in this report is conducted at both the regional level, and at the case
study level focusing on Romania and Ukraine.
Agriculture is an important sector in the Black Sea region. The region has relatively
favorable land and water endowments. Currently, the agricultural productivity is low
compared with its western European counterparts as well as the world average. The
potential for increasing production is therefore considered to be high. It is expected that
the region’s agricultural production will increase in the coming years in the wake of the
recent hike of the world food prices. Some projections have shown that the region has the
potential to be a food exporter, especially to the Middle Eastern and North African
countries (MENA).
The Black Sea is vulnerable to pressures from land-based pollution in its catchment areas
(UNEP, 2005). Agriculture is one of the major sources of pollutions to the water bodies
in the region, particularly to the Black Sea coastal ecosystems. The pollution was reduced
during the 1990s following the collapse of the former Soviet Union. With the recovery of
the agricultural production in the region in recent years, the pollution to the water bodies
is likely to increase.
With the information collected and processed in the first part of WT5.3 and reported here,
a large scale crop model, GEPIC (or SWAT), will be applied in the next step to analyze
the impacts of various factors on crop yield, water use, and environment in the Black Sea
region. To facilitate the application of the GEPIC and SWAT models, several training
workshops on the models were held during the last 24 months for the partners
-
3
4. enviroGRIDS – FP7 European project
Building Capacity for a Black Sea Catchment
Observation and Assessment supporting Sustainable Development
participating in the project. The workshops also serve as a platform for capacity building
beyond the project.
-
4
5. enviroGRIDS – FP7 European project
Building Capacity for a Black Sea Catchment
Observation and Assessment supporting Sustainable Development
Contents
1 Introduction 12
1.1. Importance of agriculture in the region
1.2. Importance of agriculture of the region in the EU and the world 14
1.3. Environmental status and pollutions relating to agricultural activities 16
1.4. Structure of the report 17
2. Overview of agricultural trend and environmental status in the region 18
2.1. Trend in agricultural production
2.2 Agricultural landuse and crop area changes 20
2.3. Water endowments and water use in agriculture 22
2.4. Agricultural inputs 24
2.5. Crop production 25
2.6. Environmental impacts relating to agricultural activities 28
2.6.1. The Black Sea recovery and risk of reversal 29
2.6.2. Impact of climate change on agriculture 30
3. Overview of large scale crop models in analyzing the impacts 31
3.1. Application for large scale crop models
3.1.1. Bio-physical crop growth models in simulating crop water productivity
and yield
3.2. GEPIC model 32
3.3. SWAT model 36
4. Data availability and sources for modeling with GEPIC and SWAT 38
* DEM
*. Landuse
* River 39
*. Soil
-
5
6. enviroGRIDS – FP7 European project
Building Capacity for a Black Sea Catchment
Observation and Assessment supporting Sustainable Development
*. Yield 39
*. ET
*. Discharge stations
*. Precipitation stations and temperature stations
*. Social Economic data
*. Social economic data 40
5. Case study Romania 41
5.1. Agriculture and environmental impact in Romania
5.1.1. Generalities
5.1.2. Land reforms in Romania, brief historical overview of land property
and land relations in modern times
5.1.3. The role of agriculture in the national economy 47
5.1.4. Landuse 48
5.1.5. The quality of agricultural land 61
5.1.6. Agricultural production 67
5.1.7. Current issues in Romanian agriculture 72
5.1.8. Common agricultural policy (CAP) and development of sustainable 73
agriculture in Romania
5.2. Agricultural impacts on environment in Romania 81
5.2.1 Landuse practices-induced land degradation and desertification 83
5.3. Data basis for the model application for Romania 90
* Selecting a pilot area
* Data collecting
* Soil data
* climate data
* land management data
* Location data
* Landuse data
* Data integration into GEPIC
-
6
7. enviroGRIDS – FP7 European project
Building Capacity for a Black Sea Catchment
Observation and Assessment supporting Sustainable Development
* Preparing the grid with the collected spatial/analogous data set 91
* Landuse/land cover 92
* Land management data - Irrigation 93
6. Case Study Ukraine 94
6.1. Introduction
6.2. Natural resources 96
6.3. Agriculture 100
6.3.1. Agriculture’s role in the economy
6.3.2. Agricultural production 104
* Crops 105
* Cereals
* Oilseed 107
* Sugar beet 112
* Livestock 114
* Pigmeat production 117
6.3.3. Farm structure 121
* Initial farms 122
* Peasant farms
6.3.4. Agricultural environmental impact in Ukraine 123
6.3.5. Agriculture policies, strategies and programs 124
* The extent of Mainstreaming and its trends
*Priority needs
* Environmental impacts of agriculture 126
6.3.6. Data for Ukraine 131
References 139
-
7
8. enviroGRIDS – FP7 European project
Building Capacity for a Black Sea Catchment
Observation and Assessment supporting Sustainable Development
List of tables
Table1. Economic structure of the Black Sea Countries in 2009 13
Table2. Changes in agricultural and total GDP (1990-current) Total GDP
14
(Million$ constant 2000 prices )
Table 3. Land and water resources of the region (2008) 15
Table 4. Agricultural production in the region (2009) 15
Table 5. Structure of land cover/use (2008) 20
Table 6. Comparative number and size of farms 45
Table 7. The role of agriculture within the national economy 48
Table 8. Areas cultivated with biofuel plants (thou ha) 57
Table 9. Soil quality limiting factors and size of affected area, 1992-2002 62
Table 10. Agricultural areas requiring improvement works 65
Table 11. Distribution of agricultural terrains by capability class, 2002 67
Table 12. Total and average production/ha of main crops (yearly averages) 69
Table 13. Ecologically farmed areas (ha) 77
Table 14. Ecological farming: livestock and poultry 78
Table 15. Plant and livestock production and main ecologically processed 79
products
Table 16. Land cover/land use categories in areas with high and low risk of 85
desertification in Romania
Table 17 Types of land degradation in Romania 86
Table 18. Climate zones in Ukraine 99
Table 19. Basic agricutural indicators, 2000-2007. 101
Table 20. Number of livestock (million) in Ukraine 114
-
8
9. enviroGRIDS – FP7 European project
Building Capacity for a Black Sea Catchment
Observation and Assessment supporting Sustainable Development
List of figures
Figure 1. The trend in the % contribution of agriculture to total GDP 13
Figure 2. Plot of agricultural GDP and water resources does not show a good 16
correlation for the countries studied. This indicates water resources not
being a limiting factor for agricultural production.
Figure 3. Showing the trend in cereal, wheat, maize, and meat production in 18-19
some Black Sea countries
Figure 4. The trend in agricultural landuse change showing crop lands, wheat, 21
and maize
Figure 5. Showing the size of arable land per capita 22
Figure 6. Long-term trend of fertilizer use in Black Sea countries 24
Figure 7. Phytoplankton bloom in the Black Sea 25
Figure 8. Showing the trend in the yield of major grain crops 26-27
Figure 9. Using the FAO statistical data it can be seen that yield of wheat 30
while enjoying an increasing trend in the 70’s to mis 80’s, has started a
decreasing trend due to climate change and increasing temperatures.
Figure 10 The schematic representation of the integration of EPIC with GIS 34
Figure 11. Land fund by categories of use and forms of property 44
Figure 12. Farms by size class of agricultural area used, 2007 46
Figure 13. Agricultural area: size of plots (ha), 2005 47
Figure 14. Structure of land cover/use in Romania, 2007 49
Figure 15. Structure of agricultural land, 2007 49
Figure 16. Land use/land cover in Romania. 50
Figure 17. Land use dynamics, 1990 – 2007 51
Figure 18. Arable land, 2006 52
Figure 19. Cultivated area 53
Figure 20. Uncultivated area 53
Figure 21. Structure of cultivated area, 1990 – 2007 55
Figure 22. Vineyards 59
Figure 23. The quantity of fertilisers, 1990 – 2007 63
a) natural fertilsers and pesticides, b) chemical fertilisers
-
9
10. enviroGRIDS – FP7 European project
Building Capacity for a Black Sea Catchment
Observation and Assessment supporting Sustainable Development
Figure 24. Types of land management in Romania 65
Figure 25. Structure of agricultural production 68
Figure 26. Livestock dynamics, 1990 – 2007 70
Figure 27. Livestock density per unit of area, 2006 71
Figure 28. Number of farmers in ecological agriculture, 2007 80
Figure 29 Areas vulnerable to nitrate pollution from agricultural sources in 82
Romania, 2003
Figure 30 Areas vulnerable to nitrate pollution from agricultural sources in 83
Romania, 2008
Figure 31 Areas with risk of desertification in Romania 84
Figure 34. Area equipped with irrigation systems and irrigated area 87
Figure 35. Correlation between wheat yields and the main climatic elements 88
from the season with maximum biological activity in southern Oltenia
Figure 36 Correlation between maize and sunflower yields and main climatic
elements from the season with maximum biological activity in southern 88
Oltenia
Figure 37. DEM and slope layers needed for GEPIC modeling 91
Figure 38. Maps of landuse and harvested area 92
Figure 39. Map of Ukraine 97
Figure 40. Map 2: Relief Map of Ukraine. Source: Arid Ocean Maps 98
Figure 41: Ukraine: Evolution and annual changes of agricultural output, 102
1990-2007
Figure 42. Foreign direct investment in Ukraine and Hungary, net inflows 103
(current USD)
Figure 43. Sectoral contributions to the growth of industrial production and 104
investment
Figure 44. Main cereals production 106
Figure 45. Sunflower seed production 108
Figure 46. Soybean and rapeseed production 109
Figure 47. Sunflower oil production and use 110
Figure 48. Net exports of sunflower and rapseed and share among top net 111
exporters
Figure 49. Ukrainian sugar beet production in 1992 and 1998-2018 113
-
10
11. enviroGRIDS – FP7 European project
Building Capacity for a Black Sea Catchment
Observation and Assessment supporting Sustainable Development
Figure 50. Output of main animal products 115
Figure 51. Ukraine: Meat consumption (per capita) 116
Figure 52. Ukraine: Beef &Veal balance 116
Figure 53. Ukraine: Broiler balance 117
Figure 54. Ukraine: Pigmeat balance 117
Figure 55. Ukraine: Consumption of different milk products 118
Figure 56. Ukrainian milk production (fluid milk) 119
Figure 57. Ukrainian export in different milk products 120
Figure 58. Gross agricultural output in constant prices by farm type in 122
Ukraine, 1990-2004
Figure 59 Area of Agricultural Land and Forest That Can No Longer Be 127
Used because of the Chernobyl Nuclear Power Plant Accident
Figure 60. Erosion Distribution 128
Figure 61. Digital elevation model GTOPO30 for the Odessa region area 132
(Ukraine)
Figure 62 The slope dataset GTOPO30 for the Odessa region area (Ukraine) 133
Figure 63. The Soil Map of Ukraine in WRB Classification 133
Figure 64. Soil Hydrologic group map of Ukraine in GIS formats 134
Figure 65. Map of growth class for sugar beet in Ukraine in GIS format 135
Figure 66. DEM raster datasets 135
Figure 67. Slope raster dataset 135
Figure 68. Country raster dataset 136
Figure 69. Fertilizer raster dataset 136
Figure 70. Soil raster dataset 137
Figure 71. Climate raster dataset 137
Figure 72. Irrigation raster dataset 138
-
11
12. enviroGRIDS – FP7 European project
Building Capacity for a Black Sea Catchment
Observation and Assessment supporting Sustainable Development
1. Introduction
1.1. Importance of agriculture in the region
The Black Sea region has always been an important trade crossroad between Europe and
Asia. The region is a unique combination of EU Member States and Non-member States.
Sustainable agriculture in the region is a shared concern between the EU and the Black
Sea region. The region is considered to have major potentials in agriculture and energy.
Understanding its agricultural and environmental trend provides basis for the protection
and sustainability of the agriculture and environment in the region.
The countries in the Black Sea catchment are characterized by varying degrees of
economic development, including great disparities in national GDP in terms of absolute
figures, per capita values, sectoral compositions and annual growth. Table 1 shows the
total and agricultural GDP as well as the % contribution of agriculture to total GDP. In
Figure 1, the trend in the contribution of agriculture (in %) to total GDP is shown. Most
countries, except Romania, show a decreasing trend from 2000 to 2007. Since 2007 the
share of agriculture seems to be growing again.
-
12
13. enviroGRIDS – FP7 European project
Building Capacity for a Black Sea Catchment
Observation and Assessment supporting Sustainable Development
Table1. Economic structure of the Black Sea Countries in 2009
Countries Total Total GDP* Per capita Agriculture GDP Share of
population GDP agriculture in
(Million $ (Million $
total GDP
(×103) constant ($ constant constant 2000
2000 prices) 2000 prices) prices) (%)
Bulgaria 7545 18606 2466 1238 7
Georgia 4260 5256 1234 775 15
Moldova 3604 1973 548 327 17
Romania 21275 55997 2632 8175 15
Turkey 74816 357285 4776 29714 8
Ukraine 45708 45394 993 6149 14
EU 496435
* Total GDP is calculated by Per capita GDP multiplying population
Trend in the share of Ag. GDP in Total GDP
30
25 Bulgaria
20 Georgia
Moldova
%
15
Romania
10 Turkey
5 Ukraine
0
1998 2000 2002 2004 2006 2008 2010
Figure 1. The trend in the % contribution of agriculture to total GDP
-
13
14. enviroGRIDS – FP7 European project
Building Capacity for a Black Sea Catchment
Observation and Assessment supporting Sustainable Development
The trend in agricultural and total GDP from 1990 to 2009 is also given in Table 2. The
trend shows a large disparity in growth with Turkey having the largest share of growth
while Moldova stagnating in growth.
Table2. Changes in agricultural and total GDP (1990-current) Total GDP (Million$ constant
2000 prices )
Countries 1999-2001 2003-2005 2007 2008 2009
Bulgaria 12516 15286 18481 19592 18606
Georgia 3085 4017 5351 5475 5256
Moldova 1305 1691 1957 2110 1973
Romania 37518 46495 55927 61199 55997
Turkey 255908 306426 372619 375074 357285
Ukraine 31687 42915 52368 53467 45394
1.2. Importance of agriculture of the region in the EU and the world
The importance of agriculture in rural activity differs among the countries in the region.
One of the most important factors affecting the Black Sea countries’ production and trade
of grain is productivity. The productivity growth is likely at a moderate pace. As a result,
the Black Sea region is most likely to become a medium-sized food exporter in the future.
In Table 3 land and water resources are compared in different Black Sea countries, while
Table 4 compares the agricultural production. An interesting observation is the
relationship between total GDP and water resources. Figure 2 shows that the region has a
relatively good water endowment. There is no major water limitation as far as agricultural
production is concerned. Indeed, Turkey with one of the smallest water resources per
capita has the largest agricultural GDP. In general, water resources per capita of larger
than 1500 m3 indicates no water stress (Yang et al., 2002).
-
14
15. enviroGRIDS – FP7 European project
Building Capacity for a Black Sea Catchment
Observation and Assessment supporting Sustainable Development
Table 3. Land and water resources of the region (2008)
Countries Total Area Arable land Arable land Water Water resources
per capita resources per capita
(1000 ha) (1000 ha)
(ha/capita) (km3/year) (m3/year/capita)
Bulgaria 11091 3061 0.4057 21 2823
Georgia 6970 468 0.1099 63 14866
Moldova 3370 1822 0.5055 12 3233
Romania 23750 8721 0.4099 212 9960
Turkey 78058 21555 0.2881 214 2855
Ukraine 603623 32474 0.7105 140 3054
Table 4. Agricultural production in the region (2009)
Countries Total cereal Per capita cereal Wheat Maize
production production
(tones) (tones)
(1000 tones) (tones/cap)
Bulgaria 6'243 0.827447051 3976852 1290833
Georgia 372 0.087237089 53800 290300
Moldova 2131 0.591287458 735000 1140000
Romania 14'874 0.699124512 5202526 7973258
Turkey 33'570 0.448695827 20600000 4250000
Ukraine 45'406 0.993392842 20886400 10486300
EU (15) 298151 0.600584165 138725136 57778082
World 2'489'302 0.364499886 681915838 817110509
-
15
16. enviroGRIDS – FP7 European project
Building Capacity for a Black Sea Catchment
Observation and Assessment supporting Sustainable Development
GDP vs. Water Resources
GDP & Water Resources per capita
35000
30000
25000
per year
20000 GDP
15000 Water Resources
10000
5000
0
Bulgaria Georgia Moldova Romania Turkey Ukraine
Figure 2. Plot of agricultural GDP and water resources does not show a good correlation
for the countries studied. This indicates water resources not being a limiting factor for
agricultural production.
1.3. Environmental status and pollutions relating to agricultural activities
The Black Sea area is a major industrial and agricultural region, with uncontrolled urban
development. In coastal areas there are discharges from rivers, industry, agricultural
pollution and domestic sewage. The Black Sea’s Marine Ecosystem (BSMES) has a huge
drainage basin of around 2,000,000 km2. There is an acceleration of eutrophication due to
excessive levels of nitrogen loading. The combination of eutrophication and uncontrolled
fisheries has caused important alterations in the structure and dynamics of this BSMES.
The almost entirely enclosed nature of the BSMES contributes to the eutrophication
problem. There is decreasing transparency of Black Sea waters. Beaches are littered, and
there are regular beach closures due to sewage discharge problems. There is a growing
risk of losing valuable habitats in these areas. While there is little data on toxic
contamination and heavy metal accumulation, the Mussel Watch program
(http://www.ciesm.org/marine/programs/musselwatch.htm) (Thebault and Rodriguez
-
16
17. enviroGRIDS – FP7 European project
Building Capacity for a Black Sea Catchment
Observation and Assessment supporting Sustainable Development
Baena, 2007) in each of the six countries assesses areas with high pollution. A chemical
pollution study for the Black Sea was completed by 98 Black Sea scientists. This resulted
in the publication of a “State of Pollution of the Black Sea” report. Oil pollution comes
from land-based sources, and from shipping. There has been a rapid increase in traffic in
Black Sea ports, and an oil spill occurred in 1994 when the "Nassia" collided with an
empty freighter. A report on Black Sea Pollution leading to the depletion of fishing
stocks raised international concern. In the 1970s and 1980s there were frequent
explosions of phytoplankton and jellyfish (Aurelia aurita). Blooms and red tides have
been reported in the northern and western sections of the Black Sea. The Global
International Waters Assessment (GIWA) has issued a matrix that ranks BSMES
according to pollution. GIWA characterizes the BSMES as severely impacted in terms of
eutrophication and ecotone modification. However, these impacts are not increasing,
according to GIWA
(http://www.unep.org/dewa/giwa/areas/reports/r22/giwa_eutrophication_in_blacksea.pdf)
A series of small Global Environmental Facility (GEF) projects have focused on reducing
nitrogen loadings from the 17 contributing nations of the Black Sea basin. Following the
successful completion of a Trans-boundary Diagnostic Analysis (TDA) and a Strategic
Action Program (SAP) in the 1990s, there is a political commitment to reduce nutrients
and abate persistent toxic substances being released from hotspots. Agriculture pollution
is being reduced, and wetlands are being restored in the upstream basins to serve as
nutrient sinks to protect the BSMES. A GEF Strategic Partnership was in place for 2001-
2006, to assist the 17 nations.
1.4. Structure of the report
The rest of the report is organized as follows: Section 2 provides an overview of the agri-
enviornmental trends in the region; Section 3 first introduces the large scale crop models
applied in the literature. This is followed by a detailed introduction of the GEPIC and
-
17
18. enviroGRIDS – FP7 European project
Building Capacity for a Black Sea Catchment
Observation and Assessment supporting Sustainable Development
SWAT models and their applications for the tasks in WT5.3; Section 4 provides an
overview of the data collected for the modeling analysis; Section 5 contains two detailed
case studies for Romania and Ukraine. Section 6 provides a brief summary of the report.
2. Overview of agricultural trend and environmental status in the region
2.1. Trend in agricultural production
Figures 3 shows the trend in cereal, wheat, maize and meat production for some example
countries in the region. As illustrated, the cereal production has stayed constant for most
countries with some recent increases in Ukraine, while meat production has decreased in
Ukraine with Turkey showing an increasing trend. Maize production has seen a steady
increase in Ukraine, which shows the most volatility in all productions.
Trend in cereal production
60000000
50000000 Bulgaria
40000000 Georgia
Moldova
Tn
30000000
Romania
20000000 Turkey
10000000 Ukrain
0
1985 1990 1995 2000 2005 2010
-
18
19. enviroGRIDS – FP7 European project
Building Capacity for a Black Sea Catchment
Observation and Assessment supporting Sustainable Development
Trend in wheat production
30000000
25000000 Bulgaria
20000000 Georgia
Moldova
Tn
15000000
Romania
10000000 Turkey
5000000 Ukraine
0
1985 1990 1995 2000 2005 2010
Trend in maize production
16000000
14000000
Bulgaria
12000000
Georgia
10000000
Moldova
Tn
8000000
Romania
6000000
Turkey
4000000
Ukraine
2000000
0
1990 1995 2000 2005 2010
Trend in meat production
4000000
3500000
Bulgaria
3000000
Georgia
2500000
Moldova
Tn
2000000
Romania
1500000
Turkey
1000000
Ukrain
500000
0
1985 1990 1995 2000 2005 2010
Figure 3. Trends in cereal, wheat, maize, and meat production in some Black Sea countries
-
19
20. enviroGRIDS – FP7 European project
Building Capacity for a Black Sea Catchment
Observation and Assessment supporting Sustainable Development
2.2 Agricultural land use and crop area changes
The structure of land cover is given in Table 5. Agricultural landuse has been rather
constant in all countries as shown in Figure 4. Ukraine has the largest size of arable land
and the largest per capita arable land (Figure 4), hence, the largest production as indicated
in Table 4.
Table 5. Structure of land cover/use (2008)
Countries arable land permanent crop pasture Forest area
(1000 ha) (1000 ha) (1000 ha) (1000 ha)
Bulgaria 3'061 184 1'929 3816.6
Georgia 468 115 1'940 2747
Moldova 1'822 303 360 376.8
Romania 8'721 375 4'450 6500.2
Turkey 21'555 2'950 14'617 11096.4
Ukraine 32'474 900 7'918 9653
-
20
21. enviroGRIDS – FP7 European project
Building Capacity for a Black Sea Catchment
Observation and Assessment supporting Sustainable Development
Trend in crop land change
3500
3000
Bulgaria
2500 Georgia
2000 Moldova
Ha
1500 Romania
1000 Turkey
Ukraine
500
0
1990 1995 2000 2005 2010
Trend in wheat area change
12000000
10000000 Bulgaria
8000000 Georgia
Moldova
Ha
6000000
Romania
4000000 Turkey
2000000 Ukraine
0
1990 1995 2000 2005 2010
Trend in maize land change
4000000
3500000
Bulgaria
3000000
Georgia
2500000
Moldova
ha
2000000
Romania
1500000
Turkey
1000000
Ukraine
500000
0
1990 1995 2000 2005 2010
Figure 4. The trend in agricultural landuse change showing crop lands, wheat, and maize
-
21
22. enviroGRIDS – FP7 European project
Building Capacity for a Black Sea Catchment
Observation and Assessment supporting Sustainable Development
The size of arable land per capita
0.8
0.7
0.6
0.5
ha
0.4 Series1
0.3
0.2
0.1
0
Bulgaria Georgia Moldova Romania Turkey Ukraine
Figure 5. Showing the size of arable land per capita
2.3. Water endowments and water use in agriculture
Agriculture is an important sector in terms of total water use in the Black Sea region. In
many areas, crop yield has been boosted over the last decades by newly established
irrigation schemes. Increasing water withdrawal in many areas has caused environmental
problems such as lower water tables, salinization and damage to terrestrial and aquatic
habitats due to the installation of dams and reservoirs. In some areas, this has led to
overexploitation of surface and groundwater resources. This may constrain agriculture
and yields. The problem may be aggravated by climate change which already has led to
severe droughts in the region in recent years.
In Ukraine, until 1992 irrigation infrastructure was installed on a total area of 2,624000
ha. The highest construction rate of irrigation systems was registered between 1965 and
1985. After 1992 the construction of new irrigation systems was virtually stopped and
several of the existing schemes went out of operation. While the area actually irrigated
was still 2,291,600 ha in 1990, it decreased to 1,845,100 ha in 1995, 1,402,700 ha in 1998
-
22
23. enviroGRIDS – FP7 European project
Building Capacity for a Black Sea Catchment
Observation and Assessment supporting Sustainable Development
and only 543,300 ha in 2001. In 2002 area actually irrigated was 730,100 ha and in 2003
it was 731,400 ha. The reported lack of government funds to provide for proper operation
and maintenance of the irrigation canals (total length 59,300 km), pumping stations (in
total 13,700) and other hydro-technical constructions (in total 475,000) indicates that the
area actually irrigated will, at least in the near future, very likely not reach the extent
observed in the beginning of the 1990s again.
In Romania, the total agricultural land reclaimed for irrigation reached its maximum in
1996 at 3,210,000 ha and declined later to 3,176,000 ha in 2003.
As Turkey has the smallest water resources in the region, its irrigation is constraint by its
water resources. For this reason it requires new water resources. The area equipped for
irrigation in Turkey was 4,185,910 ha in 1994. The area actually irrigated was 3,143,000
ha in 1994.
In Bulgaria, the area equipped for irrigation was 1,288,000 ha in 1990 but declined later
to 673,000 ha in 1995 and 545,160 ha in 2003. Even stronger was the decline in the area
actually used for irrigation. While in 1985 about 1,014,000 ha of cultivated land was
irrigated the area actually irrigated declined to 842,000 ha in 1989, to about 100,000 ha in
the period 1992-1996 and to about 40,000 ha nowadays. Large parts of the irrigation
infrastructure constructed before 1990 deteriorated because of the break up of large farms
and the lack of finance for restructuring irrigation systems to meet the needs of small
farmers.
For Georgia, in the Soviet period, infrastructure was built to irrigate 469,000 ha of
agricultural land, mainly located in the more arid east of the country. In the 1990s, civil
strife, war, vandalism and theft, as well as problems associated with land reform, the
transition to a market economy, and the loss of markets with traditional trading partners,
-
23
24. enviroGRIDS – FP7 European project
Building Capacity for a Black Sea Catchment
Observation and Assessment supporting Sustainable Development
contributed to a significant reduction in the irrigated area. It has been reported that only
about 160,000 ha were irrigated during the severe drought in 2000. Almost all pumping
schemes (about 143,000 ha) were out of order. Therefore, a rehabilitation program was
started by Georgia's State Department of Amelioration and Water Economy to renew the
infrastructure of existing irrigation and drainage schemes and to establish amelioration
service cooperatives. About 255,000 ha are covered by this program. Based on these
reports, the area equipped for irrigation was reduced to 300,000 ha.
2.4. Agricultural inputs
The quantities of inorganic fertilizers used in the Black Sea countries with transitional
economies were drastically reduced in the 1990s due to high prices and to the inability of
the farmers to pay for fertilizers (Fig 6). Only Turkey shows a steady increase in fertilizer
use. An increase in fertilizer use from the current low levels will be substantial with the
rise in the world food prices.
Trend of fertilizer use in some Black Sea countries
3000000
2500000 Bulgaria
2000000 Georgia
Moldova
Tn
1500000
Romania
1000000 Turkey
500000 Ukraine
0
1960 1970 1980 1990 2000 2010
Figure 6. Long-term trend of fertilizer use in Black Sea countries
-
24
25. enviroGRIDS – FP7 European project
Building Capacity for a Black Sea Catchment
Observation and Assessment supporting Sustainable Development
There are various reports of phytoplankton bloom in the Black Sea from year to year. (see
Figure 7). The possibility of new demand for biofuels might also increase the fertilizer
use. The production of biofuels could lead to significant changes in land use as well as
the fertilizer use.
Figure 7. Phytoplankton bloom in the Black Sea
Source (http://earthobservatory.nasa.gov/NaturalHazards/view.php?id=16739)
2.5. Crop production
Figure 8 shows crop yields for major grains for the years 1962 to 2010. The graphs show
considerable variations in crop yield from year to year for most countries.
-
25
26. enviroGRIDS – FP7 European project
Building Capacity for a Black Sea Catchment
Observation and Assessment supporting Sustainable Development
Barley
50
45
40
Bulgaria
35
Georgia
30
Moldova
tn/ha
25
Romania
20
Turkey
15
Ukraine
10
5
0
1960 1970 1980 1990 2000 2010
Maize
80
70
60 Bulgaria
50 Georgia
Moldova
tn/ha
40
Romania
30 Turkey
20 Ukraine
10
0
1960 1970 1980 1990 2000 2010
Millet
25
20
Bulgaria
Georgia
15
Moldova
tn/ha
Romania
10
Turkey
Ukraine
5
0
1960 1970 1980 1990 2000 2010
-
26
27. enviroGRIDS – FP7 European project
Building Capacity for a Black Sea Catchment
Observation and Assessment supporting Sustainable Development
Rye
35
30
Bulgaria
25
Georgia
20 Moldova
tn/ha
15 Romania
Turkey
10
Ukraine
5
0
1960 1970 1980 1990 2000 2010
Sorghum
60
50
Bulgaria
40
Georgia
tn/ha
30 Moldova
Romania
20 Turkey
Ukraine
10
0
1960 1970 1980 1990 2000 2010
Wheat
60
50
Bulgaria
40 Georgia
Moldova
tn/ha
30
Romania
20 Turkey
Ukraine
10
0
1960 1970 1980 1990 2000 2010
Figure 8. Showing the trend in the yield of major grain crops
-
27
28. enviroGRIDS – FP7 European project
Building Capacity for a Black Sea Catchment
Observation and Assessment supporting Sustainable Development
2.6. Environmental impacts relating to agricultural activities
In a period of only three decades, the Black Sea has suffered the catastrophic degradation
of a major part of its natural resources. Increased loads of nutrients from rivers caused an
overproduction of tiny phytoplankton, which in turn blocked the light reaching the sea
grasses and algae, essential components of the sensitive ecosystem of the northwestern
shelf. Much of the coastal ecosystem began to collapse. This problem, coupled with
pollution and irrational exploitation of fish stocks, started a sharp decline in fisheries
resources. Poor planning has destroyed much of the aesthetic resources of the coastlines.
Uncontrolled sewage pollution has led to frequent beach closures and considerable
financial losses in the tourist industry. In some places, solid waste is being dumped
directly in the sea or on valuable wetlands. Tanker accidents and operational discharges
have often caused oil pollution. These problems have reached crisis proportion at a time
when five of the Black Sea countries are facing an economic and social transition and
therefore have difficulty in taking the necessary urgent remedial actions.
In order to make an early start to environmental action and to develop a longer-term
Action Plan, the Black Sea countries requested support from the Global Environment
Facility (GEF), a fund established in 1991 under the management of the World Bank, the
United Nations Development Program (UNDP) and the UN Environment Program
(UNEP) (http://www.unep.org/) . In June 1993, an initial Phase I three-year Black Sea
Environmental Program (BSEP) (http://www.blackseaweb.net/general/enviprog.htm) was
established, later phases have assured its existence up to present.
There have been some efforts in tackling the environmental problems, including pollution
monitoring, emergency response, protection of biodiversity, environmental economics,
integrated coastal zone management, sustainable fishery, public awareness, information
exchange and data management. The Black Sea GIS was one of many products of the
BSEP. Earlier products included a thorough bibliography of the Black Sea for the period
from 1974-1994, bringing to light the extensive research published on the Black Sea
-
28
29. enviroGRIDS – FP7 European project
Building Capacity for a Black Sea Catchment
Observation and Assessment supporting Sustainable Development
during this particularly active score or time. Black Sea Information System (BLACKSIS)
(http://www.blackseaweb.net/background2/content.htm) consists of several meta-data
bases covering institutions profiles, scientists list and environmental projects description
as well as description of environmental data sets available in the region. The Black Sea
Environmental Internet Node (BSEIN) includes a wide range of the metadata and
information relevant to the environmental conditions and research in the region. Now the
Node includes these main directories: About (general information about the Black Sea),
Metadata, Data, Selected Satellite Images, The Black Sea Red Data Book, Related Sites.
BSEIN is located at the WWW server of the Marine Hydrophysical Institute (Ukraine,
Sevastopol). The mirror-site is available recently at the server of UNEP/GRID-Geneva:
http://www.grid.unep.ch/bsein/
2.6.1. The Black Sea recovery and risk of reversal
The Black Sea has endured serious anthropogenic pressures. Agricultural runoff together
with the untreated wastewater is a major source of pollution. For example, one-third of
Turkey’s and Georgia’s agricultural lands are in the Black Sea basin. As a consequence,
agriculture has an important responsibility for maintaining or improving the quality and
quantity of water resources to reach the environmental targets set for the Black Sea
region.
The nutrient input into the rivers as a result of fertilizer usage was drastically extended in
the agricultural sector in the 1960s until the 1990s. During the last two decades, nutrient
pollution has seen a decrease. The observed reduction of the agricultural pollution to the
water bodies is closely linked to the dramatically reduced use of fertilizers and the
closure of large livestock farms that followed the economic collapse in central/eastern
Europe in the early 1990s. The rebound of the fertilizer uses in association with the
increase in food prices may lead to a reversal of the situation (UNEP, 2005).
-
29
30. enviroGRIDS – FP7 European project
Building Capacity for a Black Sea Catchment
Observation and Assessment supporting Sustainable Development
2.6.2. Impact of climate change on agriculture
Crop-yield analysis by some experts (e.g., Federoff et al., 2010) reveals that warming
temperatures have already diminished the rate of production growth for major cereal crop
harvests during the past three decades. The impact of climate change on agriculture can
roughly be divided into three components: a yield effect because of increased CO2
concentrations, a temperature effect, and a water availability effect.
Using U.N. Food and Agriculture Organization data going back to 1960 in Figure 8, we
can see in the illustration of Figure 9 that for major producers in Black Sea region,
Bulgaria and Romania, the wheat yield had a decreasing trend - although changes in
precipitation did not appear to be having an effect, yet.
This loss of yield translates directly into food prices, which have been rocketing upward
in recent months and years. The new analysis suggests that the climate-related yield loss
has contributed as much as 18.9 percent to the average price of a given crop during the
period of the study. Climate change "is not disastrous but it's a multibillion-dollar-per-
year effect already", says Lobell a coauthor in Federoff et al. (2010).
http://www.blackseagrain.net/about-ukragroconsult/news-bsg/climate-change-stunts-
growth-of-global-crop-yields
Wheat
60
50
Bulgaria
40
Romania
tn/ha
30
Poly.
20 (Bulgaria)
Poly.
10 (Romania)
0
1960 1965 1970 1975 1980 1985 1990 1995 2000 2005 2010
Figure 9. Using the FAO statistical data it can be seen that yield of wheat while enjoying an
increasing trend in the 70’s to mid 80’s, has started a decreasing trend due to climate
change and increasing temperatures.
-
30
31. enviroGRIDS – FP7 European project
Building Capacity for a Black Sea Catchment
Observation and Assessment supporting Sustainable Development
3. Overview of large scale crop models in analyzing the impacts
3.1. Application for large scale crop models
3.1.1. Bio-physical crop growth models in simulating crop water productivity and yields
Crop yield is a function of many factors relating to plant genotype, water availability,
agronomic practices, soil conditions, climate, and so on. Many bio-physical crop models
have been developed to simulate the individual as well as combined effects of these
factors on crop growth. In the context of increasing water scarcity in many areas of the
world, investigating both blue and green water constraints on crop production has
received particular attention. To improve the spatial representation and visualization,
many crop models have been coupled with GIS as in the case of GIS-based EPIC
(GEPIC, Liu et al., 2007; Liu, 2009). Bio-physical crop models often require detailed
field data and knowledge about soil, management, crop growth and other parameters.
This has often limited their usability in large-scale studies. So far, there are no specific
model setups that aim at representing the diverse local agricultural systems on the
continental and global scale. In the existing large scale crop modeling, default parameters
calibrated for the conditions where the model was originally developed are generally used
as compromise. To overcome this limitation, reduced forms or empirical models have
also been adopted, as for example the Global Agro-Ecological Assessment model
(GAEA), developed by the International Institute for Applied Systems Analysis (IIASA)
and FAO. The GAEA has been used for estimating crop production potentials as a
function of climate conditions (Tubiello and Fischer 2007). But this approach does not
allow for detailed assessments of impacts of crop management scenarios on agricultural
water use and crop production.
Large-scale studies have the advantage of providing a comprehensive overview and allow
for a comparison of different regions regarding agricultural productivity and production.
The simulation quality has usually been satisfactory as simulated yields are mostly quite
evenly distributed around a 1:1-line compared to reported yields. This can partly be
-
31
32. enviroGRIDS – FP7 European project
Building Capacity for a Black Sea Catchment
Observation and Assessment supporting Sustainable Development
attributed to the globally wide range of yields and the good fit of high yields in
industrialized countries with high-input agriculture. Within specific areas, especially at
the lower end of yields, large deviations are common and yields are often far over- as
well as underestimated (Priya and Shibasaki, 2001; Stehfest et al., 2007; Wu et al., 2007;
Liu, 2009). In the case of Sub-Saharan Africa, the large-scale modeling without adjusting
the parameters to the local conditions can even lead to a misidentification of the main
stressing factors to crop growth in many areas. It can be expected that using the
unadjusted parameters for simulating climate change impacts on crop production could
cause serious errors in the results. The problems specified here in large-scale crop growth
modeling highlight the need to develop appropriate approaches to incorporate local
conditions in the model setup.
3.2. GEPIC model
EPIC is a bio-physical model that simulates plant growth and yield as a function of
climate, soil, and crop management using a set of experimentally derived algorithms
(Williams et al., 1989). It has been used for more than 20 years in a wide range of
agricultural studies and geographical locations (Gassman et al., 2005, Liu et al., 2007,
Liu et al., 2009).
The model estimates crop development on a daily time-step. Potential plant growth and
yield are calculated first and subsequently multiplied by stress factors to obtain actual
increases in biomass and yield. Besides plant development, nutrient cycling and changes
in soil structure are simulated. The main functions of plant growth are light interception,
conversion of energy and CO2 to biomass, and leaf area index (LAI) development.
Growth is constrained by water, nutrient (N and P), temperature, salinity, and aeration
stress.
-
32
33. enviroGRIDS – FP7 European project
Building Capacity for a Black Sea Catchment
Observation and Assessment supporting Sustainable Development
The original EPIC model considers only the stress with the highest impact on potential
plant growth on a given day. Based on field observations, de Barros et al. (2004)
developed a modified version of EPIC for semi-arid regions (EPICsear) to take into
account interactions between water and nutrient stresses, which they found to be most
intense under these climate conditions. The daily biomass gain is in this version
calculated as
ΔBi = ΔB pi (REG)i (REN)i (1)
where ΔBi is the daily actual biomass production [kg ha-1], ΔB pi is the daily potential
biomass production [kg ha-1], REGi is the main non-nutrient plant stress on day i [-], and
REN i is the main nutrient plant stress on day i [-]. The magnitude of each stress factor
varies between 0-1 on each day of the crop growth period. The sum of the daily
magnitudes for each stress factor for the whole growing season is referred to as “stress
days”.
The EPIC model was originally developed for the application on a uniform agricultural
unit, such as a field. The coupling of EPIC with a GIS (GEPIC hereafter) has extended its
application on large scale involving various agricultural systems. The GEPIC software,
which was applied in this study, has been described in detail by Liu et al. (2007) and Liu
(2009).
Integration of EPIC with GIS – The GEPIC Model. Loose coupling and tight coupling
are two generally used approaches to integrate simulation models with GIS (Sui and
Maggio, 1999; Huang and Jiang, 2002). The loose coupling approach relies on the
transfer of data files between GIS and simulation models (Huang and Jiang, 2002). In
contrast, the tight coupling approach is to develop models within a GIS (Huang and
Jiang, 2002). In this study, the loose coupling approach was used mainly to avoid much
redundant programming.
-
33
34. enviroGRIDS – FP7 European project
Building Capacity for a Black Sea Catchment
Observation and Assessment supporting Sustainable Development
The GIS software ArcGIS (Version 9.0) was applied for the development of the GEPIC
model. ArcGIS is used as input editor, programmer and output displayer. Visual Basic for
Applications (VBA) is the main computer language used by the GEPIC model to develop
the user interface, access input data, generate EPIC required input files, control the
execution of the EPIC model, create output data, and visualize the output maps. VBA is a
simplified version of Visual Basic and is embedded in ArcGIS.. VBA can use the ArcGIS
Desktop’s built-in functionalities,, making the programming much easier. (the sentence is
deleted because you say it in line 258)
Some features of UTIL (Universal Text Integration Language) are used in the process of
transferring raw input data into EPIC required input data. UTIL is a data file editor that
comes with the EPIC model, and can edit the EPIC specific input data files by executing
a series of command-lines (Dumesnil, 1993).
Figure 10 The schematic representation of the integration of EPIC with GIS
-
34
35. enviroGRIDS – FP7 European project
Building Capacity for a Black Sea Catchment
Observation and Assessment supporting Sustainable Development
The steps of the development of the GEPIC model are illustrated in Figure 1. Input data
are first added into GEPIC in terms of GIS raster datasets. Basic “GIS input datasets”
include maps of DEM (Digital Elevation Model), slope, soil, climate, land use, irrigation
and fertilizer. Climate and soil maps show the “code number” of the climate and soil files
in each grid. These code numbers are connected with corresponding climate and soil
files. Land use map indicates different land use types, including irrigated and rain-fed
agriculture. Maps of DEM, slope, irrigation, and fertilizer show the real values of
elevation (m), slope (dimensionless), maximum annual irrigation (mm), and maximum
annual fertilizer application (kg ha-1), respectively.
After adding the raster “GIS input datasets” into GEPIC, an “input data translation
module” reads and writes input information to a “text input file”. In the text input file,
each line stands for one simulated grid, and consists of information of latitude, longitude,
elevation, slope, land use, soil code, climate code, maximum annual irrigation, maximum
fertilizer application. The information is then used to generate specific “EPIC input files”
with the help of a “UTIL” program. This process is achieved by writing command lines
into a “batch file”. The batch file consists of two types of command lines: UTIL
command line, and EPIC executive command line. UTIL command lines are used to edit
specific “EPIC input files”, while EPIC executive command lines control the running of
the EPIC model. By executing the batch file, GEPIC runs the EPIC model for each
simulated grid one by one. After one simulation, a set of “EPIC output files” are
generated. With a “output data translation module”, output variables, such as yield,
evapotranspiration, crop water productivity, are written into a “text output file”. Each
line of the “text output file” presents latitude, longitude, and output variables for one
simulation. This output file is used to generate “GIS output maps”, such as yield, ET, and
CWP maps. These maps can be visualized in GEPIC and can be edited by the user.
The GEPIC model has two unique advantages. First, it can estimate crop yield, ET, and
CWP by considering the influencing factors with a flexible spatial scale ranging from a
-
35
36. enviroGRIDS – FP7 European project
Building Capacity for a Black Sea Catchment
Observation and Assessment supporting Sustainable Development
field, catchment and nation to the entire world. Second, it has an easy to use Graphical
User Interface to access GIS data, to conduct the simulation, and to visualize the results.
3.3. SWAT model
SWAT is a basin-scale, continuous-time model that operates on a daily time step and is
developed to predict the impact of land management practices on water, sediment, and
agricultural chemical yields in large complex watersheds with varying soils, landuses,
and management conditions. The program has been successfully used in a wide range of
scales and environmental conditions from small catchments to continental level
(Gassman, et al., 2007). It performs plant growth processes as well as water quantity and
water quality modeling. In this study, we used the ArcSWAT (Olivera, et al., 2006)
program, where ArcGIS (ver. 9.1) environment is used for project development.
In SWAT, a watershed is divided into multiple sub-watersheds, which are then further
subdivided into HRUs that include homogeneous slope, landuse, and soil characteristics.
Calculated flow, sediment yield, and nutrient loading obtained for each sub-basin are then
routed through the river system.
The water in each HRU is stored in four storage volumes: snow, soil profile (0–2 m),
shallow aquifer (typically 2–20 m), and deep aquifer. Surface runoff from daily rainfall is
calculated using a modified SCS curve number method. Downward flow happens when
water content exceeds field capacity for each layer. Percolation from the bottom of soil
profile recharges the shallow aquifer. If the temperature in a particular layer is ≤ 0 oC, no
percolation is allowed from that layer. Groundwater flow contribution to total stream
flow is estimated by routing a shallow aquifer storage component to the stream (Arnold
and Allen, 1996).
Depending on data availability, potential evapotranspiration (PET) can be calculated
using different approaches. In this study, potential evapotranspiration was calculated
-
36
37. enviroGRIDS – FP7 European project
Building Capacity for a Black Sea Catchment
Observation and Assessment supporting Sustainable Development
using the Hargreaves method, which only requires minimum and maximum temperature.
The daily value of leaf area index (LAI) was applied to partition the PET into potential
soil evaporation and potential plant transpiration. LAI and root development were
estimated using the crop growth component of SWAT. This element indicates the
relationship between vegetation and hydrologic budget (Faramarzi et al., 2009, 2010; Luo
et al., 2008).
The crop growth component of SWAT, which is a simplified version of EPIC model, is
capable of simulating a wide range of crop rotation, grassland/pasture systems, and trees.
Harvest index (HI) is the fraction of above-ground plant dry biomass that is removed as
dry economic yield. Potential crop growth and yield are usually not achieved as they are
inhibited by temperature, water, nitrogen and phosphorus stress factors. In the SWAT
model the actual yield is calculated by multiplication of the actual aboveground biomass
(bioact) and actual harvest index (HIact). In a given area, bioact is affected by all
management stress factors (water, fertilizer, and temperature), while HIact is affected only
by water stress factor. The latter can be calibrated to achieve a certain water-stress-
limited yield. There are two options for irrigation and fertilization: user specified and
automatic. Automatic irrigation can be used by triggering irrigation events according to a
water stress threshold. Automatic fertilizer routine can be used to simulate fertilizer
applications based on nitrogen stress. We selected automatic irrigation and fertilization
option in this study because of the difficulty in obtaining irrigation and fertilization
schedule data for different provinces. In the model we assumed an unlimited source for
irrigation but controlled it through calibration of HIact. This is a reasonable assumption as
in most parts of Iran large amounts of water is extracted from deep aquifer or is
transferred from other river basins for irrigation purpose. The fertilizer use in the model
was limited to the available data at the provincial level and crop specific fertilizer use per
year.
-
37
38. enviroGRIDS – FP7 European project
Building Capacity for a Black Sea Catchment
Observation and Assessment supporting Sustainable Development
Plant growth is determined from leaf area development, light interception and conversion
of intercepted light into biomass assuming a plant species-specific radiation use
efficiency. Potential evapotranspiration (PET) in this study was simulated using
Hargreaves method. Actual evapotranspiration (AET) was determined based on the
methodology developed by Ritchie (1972). Leaf area index LAI and root development
were simulated on daily time steps. The daily value of LAI was used to partition PET into
potential soil evaporation and potential plant transpiration. A more detailed description of
the model is given by Neitsch, et al. (2002).
4. Data availability and sources for modeling with GEPIC and SWAT
DEM
Digital Elevation Model (DEM) extracted from the Global US Geological Survey
(USGS, 1993) public domain geographic database HYDRO1k with a spatial resolution of
1 km and 90 meter DEM from SRTM which is refined in the no data sections. The
vertical units are meter.
SOURCE:
(http://edc. usgs.gov/products/elevation/gtopo30/hydro/index.html) and
(http://srtm.csi.cgiar.org/)
Landuse
Land use map from the USGS Global Land Use/Land Cover Characterization (GLCC)
database with a spatial resolution of 1 km and distinguishing 24 land use/land cover
classes was used for the eastern part of the Black Sea Catchment
(http://edcsns17.cr.usgs.go/glcc/glc.html).
-
38
39. enviroGRIDS – FP7 European project
Building Capacity for a Black Sea Catchment
Observation and Assessment supporting Sustainable Development
CORINE land cover map (CLC1990) with 100 m spatial resolution, which provides
information for all EU countries that covers the western part of the catchment
(http://www.eea.europa.eu/data-and-maps/data/corine-land-cover-2000-raster).
The CORINE land cover map contains 43 different classes. These two maps are
combined and resized so that the final map with spatial resolution of 100 m covers the
whole catchment.
SOURCE:
(http://edcsns17.cr.usgs.go/glcc/glc.html) and (http://www.eea.europa.eu/data-and-
maps/data/corine-land-cover-2000-raster)
River
This data (bsr.shp)was downloaded from Envirogrids ftp site and it is in 50 meter
resolution. It is projected to Lambert-Conformal-Conic.
SOURCE:
https://netstorage.unige.ch/netstorage/
Soil
Soil map obtained from the global soil map of the Food and Agriculture Organization of
the United Nations (FAO, 1995), Which provides data for 5000 soil types comprising two
layers (0–30 cm and 30–100 cm depth) at a spatial resolution of 1:5,000,000.
SOURCE:
http://www.fao.org/geonetwork/srv/en/metadata.show?id=14116
Yield (5 arc min resolution)
MIRCA2000
http://www.geo.uni-frankfurt.de/ipg/ag/dl/forschung/MIRCA/index.html
ET
-
39
40. enviroGRIDS – FP7 European project
Building Capacity for a Black Sea Catchment
Observation and Assessment supporting Sustainable Development
Data-driven estimate of global land evapotranspiration from 1982-2008, compiled using a
global monitoring network, meteorological and remote-sensing observations and a
machine-learning algorithm (Jung et. al., 2010)
Discharge stations
River discharge monthly data required for calibration-validation were obtained from
Global Runoff Data Center. for 63 hydrometric stations for the period 1970–2008. We
are trying to get more data across the region.
SOURCE:
(GRDC, http://grdc.bafg.de)
Precipitation stations and Temperature stations
Weather input data (daily precipitation, maximum and minimum temperature, Figure
2a,b) mostly from the National Climatic Data Centre (NCDC,
http://www.climate.gov/#dataServices/dataLibrary) and the European Climate
Assessment & Dataset (ECAD, http://eca.knmi.nl/dailydata/predefinedseries.php).
Periods covered by the available data were from 1970 to 2008. The WXGEN weather
generator model (Sharpley and Williams, 1990), which is incorporated in SWAT, was
used to fill gaps in the measured records.
Social Economic data
Sources:
FAO (The Food and Agriculture Organization of the United Nations) statistics:
http://www.fao.org/corp/statistics/en/
http://www.fao.org/economic/ess/ess-
events/detail/en/?dyna_fef%5Bbackuri%5D=%2Feconomic%2Fess%2Fess-
publications%2Fen%2F&dyna_fef%5Buid%5D=54350FAO Statistical Yearbook 2010
http://www.fao.org/economic/ess/ess-publications/ess-yearbook/ess-yearbook2010
-
40
41. enviroGRIDS – FP7 European project
Building Capacity for a Black Sea Catchment
Observation and Assessment supporting Sustainable Development
5. Case Study Romania
5.1. Agriculture and environmental impacts in Romania
5.1.1 Generalities
Agriculture is a major branch of the national economy and has multiple functions:
biological; ecological; main source of food for the population; economic activity;
environmental protection; a way of life; a technical and cultural tradition and, last but not
least, a type of civilisation.
The cultivation of plants in Romanian territory dates back to the Early Neolithic Age
(5500 – 3500 BC), the practice of agriculture recording in time several systems of
cultivating the soil: sod breaking, that is cropping the land for several years then
abandoning it; ploughing up, soil sickened by repeated cropping is left derelict and
cultivated again after a lapse of 5 – 20 years; fallowing, based on the simplest crop
rotation system (1 – 2 years); extensive agriculture, fast-going expansion of farming land
beginning with the 19th century, and intensive agriculture, in use since the latter half of
the 20th century (Tufescu, V., 1966).
With the progress of the forces of production, this branch has been experiencing
fundamental changes in the social structure, in the technical endowment, in the structure
and distribution of land use categories and types of crop.
5.1.2 Land reforms in Romania, brief historical overview of landed property and land
relations in modern times
Land reforms represent key moments in Romania’s agrarian life, the materialisation of
efforts to change traditional societal structures, eliminate routine and stagnation, and pave
the way for new agricultural developments (Popescu, M. et al., 2003).
-
41
42. enviroGRIDS – FP7 European project
Building Capacity for a Black Sea Catchment
Observation and Assessment supporting Sustainable Development
The land reform of 1864 was implemented in Moldavia and Wallachia after the
Unification of the two Romanian Principalities. Its aim was to abolish feudal servitudes,
limit the landed estates of the nobility, the church and the state, and appropriate land to
the peasants, who received an average of 3.77 ha/family from a total of 1,765 thou ha
allocated to this category.
The land reform of 1918 – 1921 was enacted after the First World War, within a new
historical, national and political framework: completion of the Greater Union of Romania
on December 1, 1918. Carrying out the reform was a matter of several years and brought
about major changes in the structure of landed property. According to statistical figures,
until 1937, 1,393,353 peasants (69.47% of those entitled to) received land through the
expropriation of 5,804 thou hectares. The reform dismantled the landed estates (of
thousands of hectares), leaving an important segment of owners with over 100 hectares
(Popescu, M. et al., 2003).
The land reform of 1945 came after the Second World War and the establishment of a
communist regime on August 23, 1944. Its basic aim was to liquidate the property of big
landowners. Expropriations covered 1,468 thou ha, of which 1,109 thou ha (i.e. ¾) were
divided among the peasants. Whereas the 1864 and 1918-1921 land reforms had in view
the development of a capitalist agriculture, the 1945 reform was to be a first step towards
socialisation of agriculture. The year 1949 witnessed a transition to the Soviet-based
model of socialist agriculture in which both the state and the collective property held
dominant positions.
The period of transition. As from 1989, the fall of the communist regime led to a series of
radical changes in all the fields of activity. For the national economy, transition meant the
substitution of the free market system for the old centralised system. Agriculture was one
-
42
43. enviroGRIDS – FP7 European project
Building Capacity for a Black Sea Catchment
Observation and Assessment supporting Sustainable Development
of the first economic branches to be seriously affected by the restructuring process, by
fundamental changes in the ownership of land, the basic factor of production.
The post-socialist period witnessed major transformations in the type of property over
farming lands and forest lands and the establishment of a new social-economic
organisation structure. A negative effect had the excessive fragmentation of farming land,
the emergence of large numbers of individual farms practicing subsistence agriculture,
poor services (irrigation, fertilisation, mechanisation, etc.) all of which have contributed
to the severe degradation of the quality of agricultural land. In addition the number of
livestock also fell to half over the 1990-2007 period.
Major changes accompanied Romania’s EU accession, the aquis requesting the
implementation of the Common Agricultural Policy (CAP). The key factors involved in
this complex overhaul were the political ones, they interacting with the economic,
technological and demographic factors. At the same time, the impact of global climate
change cannot be overlooked.
Changes in the type of property. One of the major changes in the transition period was
the expansion of private property over agricultural and forest lands.
-
43
44. enviroGRIDS – FP7 European project
Building Capacity for a Black Sea Catchment
Observation and Assessment supporting Sustainable Development
socialist period (1989) post-socialist period (2007)
100
95
90
85
80
75
70
65
60
55
50
45
40
35
30
25
20
15
10
5
0
Collective property State property Private property Private property
Arable Pastures Hay-fields Vine-yards Orchards
Figure 11. Land fund by categories of use and forms of property
In the socialist period (1945 – 1989), all land use categories, except for hay-fields, were
collective ownership, the state possessing the largest high-grade land uses – vine-yards
and orchards. Private owners held mainly pastures and natural hay-fields (Figure 11).
The permanent expansion of private property is the direct outcome of the collectivisation
and privatisation begun in 1990 under the provisions laid down in Land Law 18/1991
completed and modified by Law 169/1997, Law 1/2000 and Law 247/2005. On this basis,
private property was continuously enlarged up to over 95.3% of all agricultural land and
to over 34.1% of the forest land (2006).
Changes in the type of land exploitation. The land reform led to the formation of new
structures of the farmers’social-economic organisation based on private property, with
individual farms holding the highest share compared to juristic person units.
Before 1989, there were two main forms of agricultural exploitations: collective farms
(3,776 units in 1989) which held 68.8% of the overall agricultural area, average surface
2,374 ha, and state farms (411 units in 1989) which owned 29.7% of the overall
-
44
45. enviroGRIDS – FP7 European project
Building Capacity for a Black Sea Catchment
Observation and Assessment supporting Sustainable Development
agricultural area, average surface 5,000 hectares. Peasant households possessed a mere
9.5% consisting mostly of pastures and hay-fields in hill and mountain regions.
Table 6. Comparative number and size of farms
Socialist period Post – socialist period
Collective State farms Individual farms Juristic person
farms units
Number 3,776 411 3,913,651 17,699
Average area 2,374 5,001 2.29 270.45
(ha)
After 1989, Land Law 18/1991 coming into effect, landed property would crumble
excessively, large farms growing into peasant-type family exploitations.
In 2007, Romania had 3.93 million agricultural exploitations, of which 99.5% were
individual farms that used over 65% of the overall agricultural area. Average agricultural
area/individual farm was 2.29 ha, average number of plots/farm was 3.7 (Table 6).
Juristic person units held only 0.45%, average surface 270.45 ha, average number of
plots/unit 9.66, a plot having 27.95 hectares.
The efficient use of agricultural land depends on farm size (overall agricultural area and
agricultural area used). One of the characteristic features of Romanian agriculture is the
dominance of very small and small farms with little financial resources, owned by
undertrained ageing people. This situation makes it almost impossible to use new
production technologies, undertake efficient management and marketing, capable to
increase productivity in agriculture and make it competitive. Most individual farms
practice subsistence agriculture, for self-consumption of the farmers themselves.
Looking at the size-class of the agriculture area used, it appears that most of it belongs to
very small and small farms (Figure 12), large, commercial farms (50 – 100 ha and over)
holding only 0.4% of the area used. The multitude of small farms (under 5 ha/farm used
-
45
46. enviroGRIDS – FP7 European project
Building Capacity for a Black Sea Catchment
Observation and Assessment supporting Sustainable Development
area) and self-consumption hinder agriculture from becoming competitive and using the
farming land in a sustainable manner.
The total number of individual farms and of juristic person units decreased over the past
few years (2002 – 2007) by some 12% and by over 21.9%, respectively, while the
average area used increased. The average area/individual farm grew from 1.73 ha in 2002
to 2.29 ha in 2007.
1.8% 0.4% 0.4%
7.8%
89.6%
>5 5 - 10 10 - 20 20 - 50 < 50
Figure 12. Farms by size class of agricultural area used, 2007
An important role in amassing agricultural areas has the annuity programme, expecting
people to make farming an efficient activity capable to put up with European
competition. The programme encourages small owners to sell or lease their land, for 100
euro/ha/year if sold, or 50 euro/ha/year if leased. At the beginning of 2007, the number of
people petitioning for life annuity was of 37,627, which is a remarkable figure compared
to previous years: 814 in 2005 and 23,700 in 2006.
Fragmentation of agricultural lands. The fragmentation of agricultural lands was one of
the negative results of Land Law 18/1991 with significant impact on land use. The
consequence of fragmentation was the continuous degradation of the land’s productive
potential, and the impossibility of practicing a modern agriculture.
-
46
47. enviroGRIDS – FP7 European project
Building Capacity for a Black Sea Catchment
Observation and Assessment supporting Sustainable Development
0.3% 0.2%
4.8%
14.4% 22.1%
37.1% 21.2%
< 1 ha 1 - 2 ha 2 - 5 ha 5 - 10 ha 10 - 50 ha 50 - 100 ha > 100 ha
Figure 13. Agricultural area: size of plots (ha), 2005
Under the Land Law, over four million owners were restituted their agricultural property.
In many cases the area received was made up of several plots, in terms of terrain
configuration, fertility, location of crops in the field, etc. According to estimates, there
were about 15 million plots, most of them (over 42%) less than 2 ha each (Figure 13).
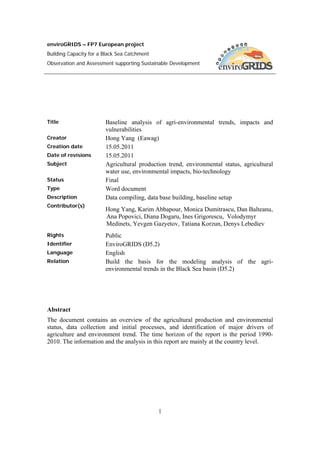
5.1.3. The role of agriculture in the national economy
After 1990, the share of agriculture in Romania’s economy kept decreasing constantly, at
a slower pace in the first years of transition and much faster after 1997. For all that, this
sector made a significant contribution to GDP (9.5% in 2001) comparatively with the EU
average (1.7 %).
-
47
48. enviroGRIDS – FP7 European project
Building Capacity for a Black Sea Catchment
Observation and Assessment supporting Sustainable Development
Table 7. The role of agriculture within the national economy
1990 1995 2000 2006
GDP contribution
18.0 19.3 11.8 9.5
Share of employed in
agriculture 28.1 33.6 40.8 30.5
Share to exports
1.4 5.0 2.3 2.1
In 2005, agriculture contributed with 9.5% to gross added value compared to 12.5% in
2000 and 20.9% in 1995. The population active in this sector represented 30.5% (2006)
per total employed population. The proportion of the former would steadily increase from
18.0% in 1990 to 40.8% in 2000, only to gradually decrease down to 30.5% in 2006
(Table 7).
5.1.4 Land use
The land fund structure. Romania is one of the European countries with important land
resources (0.68 ha agricultural land and 0.43 ha arable land per capita). In terms of
structure, the situation in 2007 was the following: 14,709.3 thou ha agricultural land
(61.8% of Romania’s surface-area), 6,740.9 thou ha forest land (28.3%), 849.9 thou ha
terrains covered with water and ponds (3.5%), 685.7 thou ha built-up area (2.8%), 390.1
thou ha roads and railways (1.6%) and 463.2 thou ha of degraded and unproductive
grounds (1.9%) (Figure 14).
Arable land/total agricultural area represented 64.5%, pastures and natural hay-fields
33%, vine-yards and wine nurseries 1.48%, orchards and fruit-tree nurseries 1.4% (Figure
15).
-
48
49. enviroGRIDS – FP7 European project
Building Capacity for a Black Sea Catchment
Observation and Assessment supporting Sustainable Development
2.8% 1.6% 1.9%
3.5%
28.3%
61.8%
Agricultural land Forets Water and ponds
Built-up area Roads and railw ays Degraded and barren lands
Figure 14. Structure of land cover/use in Romania, 2007
10.4% 1.5% 1.4%
22.6%
64.0%
Arable Pastures Hay-fields Vine-yards Orchards
Figure 15. Structure of agricultural land, 2007
Structure of agricultural lands. The diversity and specificity of the pedoclimatic systems
(mountains, hills and plains in almost equal proportions), together with the general and
regional particularities of a social history and of the economic context account for the
-
49
50. enviroGRIDS – FP7 European project
Building Capacity for a Black Sea Catchment
Observation and Assessment supporting Sustainable Development
prevalence of agricultural grounds (over 62%) – arable, pastures and hay-fields, vine-
yards and orchards, in nearly every relief step, but mainly in the plain (over 80%) – the
Romanian Plain, the West Plain, the Central and South Dobrogea Plateau, their
proportion decreasing to 40 – 60% in the hills and to under 20% in the mountains (Figure
16).
Figure 16. Land use/land cover in Romania.
A series of changes in the structure of agricultural lands took place over the 1990 – 2007
period, in that arable land, vine-yards and orchards shrank, while pastures and natural
hay-fields extended. Between 1990–2000, arable areas were sharply reduced also because
they had been abandoned by their new owners who were unable to work their plots
repossessed under Land Law 18/1991. The same happened to vine-yards and orchards,
many being abandoned or downright cleared off.
Within that same period, areas covered with vine-yards, orchards and arable land, which
are high-class uses, shrank to the benefit of low-class ones (pastures and hay-fields).
-
50