1. enviroGRIDS – FP7 European project
Building Capacity for a Black Sea Catchment
Observation and Assessment System supporting Sustainable Development
Remote Sensing Services
Title Remote Sensing Services
Creator Filiz BEKTAŞ BALÇIK (İstanbul Technical University,
Turkey)
Creation date 2012.02.10
Date of last revision 2012.03.31
Subject ESIP Platform and Hot Spot Inventory case studies
Status Finalized
Type Word document
Description Reporting Hot Spot Inventory Case studies and ESIP
Platform
Contributor(s) Filiz Bektaş Balçık, Çiğdem Göksel, Seval Sozen, Karin
Allenbach, Mamuka Gvilava, Kazi Rahman, Dorian
Gorgan, Vasile Mihon.
Rights Public
Identifier EnviroGRIDS D2.11
Language English
Relation enviroGRIDS D2.1 (Interoperability guideline)
enviroGRIDS D2.2 (Data storage guidelines)
enviroGRIDS D2.4 (Remote sensing data use and
integration guidelines)
enviroGRIDS D2.6 ( Transition plan for grid infrastructure)
enviroGRIDS D2.7 (Grid-enabled Spatial Data
Infrastructure)
enviroGRIDS D4.1 (Data Collection)
enviroGRIDS D6.1 (BSC network of GEO partners)
Abstract:
This document aims to provide a technical description of the Environment Oriented Satellite Data
Processing Platform (ESIP). Built over the gProcess platform, ESIP offers a set of Web and Grid services,
and image oriented basic operators. This platform is accessible through a web-based application called
GreenLand, especially developed for remote sensing applications. Specific workflows have been requested
through Greenland and are currently being tested in three detailed case studies: a change detection analysis
on İstanbul (Turkey) by computing vegetation indices and land cover/use classifications on Landsat 5 TM
imagery, the hydrological modelling on Rioni River basin (Georgia) and the retrieval of large remote
sensing products datasets for the entire Black Sea catchment.
GreenLand Grid-based application offers scalability when dealing with a large number of users and/or a
large processing data volume. Due to the computing and storage capabilities offered by the Grid
infrastructure, the workflow execution times are significantly reduced in comparison with
standalone/cluster processing. Therefore this powerful tool will certainly be very useful for sustainable
management of the Black Sea watershed.
An update of this deliverable will be provided by the end of the project and will include a detailed
description of each fully-processed case study.
-1-
2. enviroGRIDS – FP7 European project
Building Capacity for a Black Sea Catchment
Observation and Assessment System supporting Sustainable Development
This deliverable is part of work package 2 Spatial Data Infrastructure. It is covering the following points:
CONTENTS
REMOTE SENSING SERVICES .......................................................................................................................... 1
LIST OF FIGURES ............................................................................................................................................. 4
LIST OF TABLES ............................................................................................................................................... 5
1. INTRODUCTION............................................................................................................................................ 6
1.1
DESCRIPTION OF THE WORK .................................................................................................................................. 6
1.2
CONTRIBUTORS ..................................................................................................................................................... 6
2
ESIP PLATFORM AND GREENLAND APPLICATION ............................................................................... 9
2.1
ESIP PLATFORM ................................................................................................................................................... 9
2.1.1
ESIP Overview ............................................................................................................................................ 10
2.1.2
ESIP Architecture........................................................................................................................................ 10
2.1.2.1
Grid infrastructure................................................................................................................................. 11
2.1.3
Workflow Based Description ...................................................................................................................... 12
2.1.3.1
Process Description Graph .................................................................................................................... 12
2.1.3.2
Instantiated Process Description Graph ................................................................................................ 13
2.1.4
Basic Operators Library .............................................................................................................................. 13
2.1.5
GRASS Based Processing ........................................................................................................................... 14
2.2
GREENLAND APPLICATION ................................................................................................................................. 18
2.2.1
GreenLand Overview .................................................................................................................................. 18
2.2.2
GreenLand Architecture .............................................................................................................................. 19
2.2.3
Use Case Scenarios in GreenLand Application .......................................................................................... 19
2.2.3.1
Processing Description ......................................................................................................................... 20
2.2.3.2
Grid Based Process Execution .............................................................................................................. 26
2.2.3.3
Process Execution Monitoring .............................................................................................................. 28
2.3
ESIP AND GREENLAND SYSTEM ......................................................................................................................... 28
2.3.1
Generic Case Studies................................................................................................................................... 28
3
HOT SPOT INVENTORIES ...................................................................................................................... 31
3.1
İSTANBUL CASE STUDY ...................................................................................................................................... 31
3.1.1
Introduction ................................................................................................................................................. 31
3.1.1.1
Purpose and Scope ................................................................................................................................ 31
3.1.2
Study Area ................................................................................................................................................... 31
3.1.3
Data and Methodology ................................................................................................................................ 32
3.1.3.1
Radiometric Correction (DN to Reflectance Conversion) .................................................................... 32
3.1.3.2
Atmospheric Correction (Dark Object Subtraction) ............................................................................. 33
3.1.3.3
Vegetation Indices (NDVI and EVI) .................................................................................................... 34
3.1.3.4
Classification (Density Slicing) ............................................................................................................ 35
3.1.3.5
Classification Accuracy Assessment .................................................................................................... 35
3.1.4
Results (ENVI) ............................................................................................................................................ 37
3.1.5
Results (ESIP Platform) .............................................................................................................................. 42
3.1.5.1
Grid Based Process Execution .............................................................................................................. 42
3.2
RIONI RIVER BASIN CASE STUDY ....................................................................................................................... 43
3.2.1
Introduction ................................................................................................................................................. 43
3.2.1.1
Rioni River Basin and Case Study Description .................................................................................... 43
3.2.2
Application Methodology ........................................................................................................................... 44
3.2.2.1
Users Profile ......................................................................................................................................... 45
-2-
3. enviroGRIDS – FP7 European project
Building Capacity for a Black Sea Catchment
Observation and Assessment System supporting Sustainable Development
3.2.2.2
Applications .......................................................................................................................................... 45
3.2.2.3
Functionality ......................................................................................................................................... 46
3.2.2.4
Use Scenarios ........................................................................................................................................ 47
3.2.3
Data Resources ............................................................................................................................................ 48
3.2.3.1
Global (Remote Sensing) ...................................................................................................................... 48
3.2.3.2
Local (hydrometeorology, soils) ........................................................................................................... 52
3.2.4
Results (SWAT) .......................................................................................................................................... 55
3.2.4.1
Land (hard) data .................................................................................................................................... 55
3.2.4.2
Climate (soft) data ................................................................................................................................ 56
3.2.4.3
Hydrological modelling results ............................................................................................................. 57
3.2.5
Recommendations for model improvements .............................................................................................. 58
3.2.5.1
Specifications for ESIP and GreenLand Based Processing .................................................................. 59
3.2.6
Synergy with PEGASO (Georgia CASE Site) ............................................................................................ 59
3.3
REMOTE SENSING PRODUCTS FOR SWAT OUTPUTS VALIDATION ........................................................................ 61
3.3.1
Introduction ................................................................................................................................................. 61
3.3.2
Remote sensing products............................................................................................................................. 61
3.3.2.1
RSP commonly used in hydrologic research ........................................................................................ 61
3.2.2.3
Quality assessment ................................................................................................................................ 62
3.3.3
Evaluation on Vit river basin, Bulgaria....................................................................................................... 62
3.3.3.1
Data Storage .......................................................................................................................................... 63
3.3.4
Processes ..................................................................................................................................................... 63
3.4
GREENLAND BLACK SEA CATCHMENT APPLICATION........................................................................................... 64
3.4.1
Process description ...................................................................................................................................... 65
3.4.1.1
Products ................................................................................................................................................ 65
3.4.1.2
Upload ................................................................................................................................................... 66
3.4.1.3
Processes (band extraction, conversion, mosaic, subset) ...................................................................... 67
3.4.1.4
Export.................................................................................................................................................... 69
3.4.2
Iterations ...................................................................................................................................................... 69
3.4.3
File size ....................................................................................................................................................... 69
3.4.4
ESIP application at Black Sea catchment extent......................................................................................... 70
3.4.4.1
ESIP and GreenLand Based Processing ............................................................................................... 70
3.4.5
Future improvements .................................................................................................................................. 71
4
CONCLUSION AND RECOMMENDATIONS.............................................................................................. 71
5
ABBREVIATIONS AND ACRONYMS ........................................................................................................ 72
6
REFERENCES ......................................................................................................................................... 74
APPENDIX 1 RIONI HYDRO-METEOROLOGY ............................................................................................... 78
HYDROLOGY ................................................................................................................................................................. 78
Hydrologic Stations of Rioni River Basin................................................................................................................ 79
Description of Hydrologic Stations along Rioni River ............................................................................................ 79
Existing Reservoirs .................................................................................................................................................. 81
Planned Reservoirs ................................................................................................................................................... 82
Metadata ................................................................................................................................................................... 82
METEOROLOGY ............................................................................................................................................................. 82
Description of Meteorology Stations along Rioni River .......................................................................................... 82
Metadata ................................................................................................................................................................... 84
-3-
4. enviroGRIDS – FP7 European project
Building Capacity for a Black Sea Catchment
Observation and Assessment System supporting Sustainable Development
List of figures
FIGURE
2.1
ESIP
RELATED
ARCHITECTURE
..............................................................................................................
10
FIGURE
2.2
PDG
INTERNAL
STRUCTURE
.................................................................................................................
13
FIGURE
2.3
GREENLAND
SYSTEM
RELATED
ARCHITECTURE
.........................................................................................
19
FIGURE
2.4
USER'S
PROJECT
DETAILS
MODULE
........................................................................................................
21
FIGURE
2.5
ADD
WORKFLOWS
TO
PROJECT
.............................................................................................................
23
FIGURE
2.6
UPLOAD
LOCAL
FILES
PANEL
................................................................................................................
24
FIGURE
2.7
OGC
SERVICE
BASED
DATA
RETRIEVAL
PANEL
..........................................................................................
25
FIGURE
2.8
FTP
BASED
DATA
RETRIEVAL
PANEL
.......................................................................................................
25
FIGURE
2.9
SPECIFY
THE
WORKFLOW
INPUTS
..........................................................................................................
26
FIGURE
2.10
GRID
BASED
EXECUTION
MONITORING
PANEL
.......................................................................................
28
FIGURE
2.11
GRASS
SCRIPT
FOR
WORKFLOW
DEFINITION
..........................................................................................
29
FIGURE
2.12
PDG
AND
IPDG
DEFINITIONS
FOR
THE
NDVI
WORKFLOW
.......................................................................
30
FIGURE
3.1
STUDY
AREA
(İSTANBUL)
....................................................................................................................
31
FIGURE
3.2
FLOWCHART
OF
İSTANBUL
CASE
STUDY
.................................................................................................
32
FIGURE
3.3
IMAGE
CLASSIFICATION
.......................................................................................................................
35
FIGURE
3.4
THE
CONFUSION
MATRIX
AND
SOME
COMMON
MEASURES
OF
CLASSIFICATION
ACCURACY
THAT
MAY
BE
DERIVED
FROM
IT.
ADOPTED
FROM
FOODY,
(2002).
....................................................................................................
36
FIGURE
3.5
PRE-‐PROCESSED
DATA
(MOSAICKED
AND
SUBSET)
A)
1987
B)
2009
...........................................................
37
FIGURE
3.6
RESULTS
OF
VEGETATION
INDICES
(NDVI,
AND
EVI)
A)
1987
NDVI
B)
2009
NDVI
C)
1987
EVI,
AND
D)
2009
EVI
........................................................................................................................................................
39
FIGURE
3.7
DENSITY
SLICING
CLASSIFICATION
A)
1987
NDVI
B)
2009
NDVI
...............................................................
40
FIGURE
3.8
DENSITY
SLICING
CLASSIFICATION
A)
1987
EVI
B)
2009
EVI
.....................................................................
41
FIGURE
3.9
SELECTING
THE
EVI
INPUT
DATA
SET
.....................................................................................................
42
FIGURE
3.10
EVI
WORKFLOW
USAGE
RESULT
.........................................................................................................
43
FIGURE
3.11
ENVIROGRIDS
FUNCTIONAL
ARCHITECTURE
........................................................................................
48
FIGURE
3.12
TRMM
PRECIPITATION
TIME
SERIES
0.25º
X
0.25º
GRID
POINTS,
FALLING
WITHIN
THE
RIONI
BASIN.
............
51
FIGURE
3.13
HYDROLOGICAL
AND
METEOROLOGICAL
STATIONS
IN
THE
RIONI
BASIN
(BOX
INDICATES
LOCATION
OF
NAMAKHVANI
HYDROPOWER
CASCADE
WITH
3
PLANNED
RESERVOIRS
ON
R.
RIONI)
...............................................
53
FIGURE
3.14
SOILS
OF
GEORGIA
AND
IN
THE
RIONI
BASIN.
........................................................................................
54
FIGURE
3.15
GLOBAL
SOURCES
USED
IN
HYDROLOGICAL
MODEL
SETUP
FOR
RIONI
(SOILS,
LAND
COVER,
DEM).
(BACKGROUND
SHOWS
SUMMER
CHLOROPHYLL
IN
THE
BLACK
SEA
AND
SAMPLE
TRMM
GRID
ON
LANDWARD
SIDE.)
.........................
56
FIGURE
3.16
SWAT
SETUP
FOR
RIONI
RIVER
COLLATING
LOCAL
HYDROMET
&
GLOBAL
TRMM
PRECIPITATION
DATA.
NOTE:
OBSERVED
DATA
SEVERAL
KM
UPSTREAM
THE
SIMULATED
DATA
(ALPANA
VERSUS
OUTLET
8).
..................................
57
FIGURE
3.17
OBSERVED
VERSUS
SWAT
SIMULATED
DAILY
FLOW
CALIBRATION
.............................................................
58
FIGURE
3.18
INPUT
SOURCES,
DATA
FLOW
AND
PROCESSING
SUGGESTIONS
FOR
ESIP
BASED
PLATFORM
............................
59
FIGURE
3.19
PEGASO/EG
GEORGIA
CASE
SITE
(LEFT)
&
INDICATOR
MAP
FOR
TSKALTSMINDA
COASTAL
UNIT
(RIGHT)
...........
60
FIGURE
3.20
DATA
DOWNLOAD
AND
PREPROCESSING
WORKFLOW,
EXAMPLE
FOR
MCD15
PRODUCT
...............................
64
FIGURE
3.21
GENERAL
PROCESS
WORKFLOW
.........................................................................................................
65
FIGURE
3.22
MODIS
TILES
PRODUCTS
TO
COVER
THE
EXTENDED
BLACK
SEA
WATERSHED,
HORIZONTAL
(H)
AND
VERTICAL
(V)
POSITION
.................................................................................................................................................
68
FIGURE
3.23
DROP-‐DOWN
LIST
OF
ACCESSIBLE
PRODUCTS
FOR
GREENLAND’S
TOOLS
.....................................................
68
FIGURE
3.24
NUMBER
OF
EXPECTED
PROCESSED
PRODUCTS
ACCORDING
WORKFLOW
STEPS
.............................................
69
FIGURE
3.25
MOSAIC
OF
12
TILES
OF
LAI
BAND
(MOD15)
ON
23
APRIL
2011
...........................................................
70
FIGURE
3.26
MOSAIC
WORKFLOW
USAGE
RESULT
...................................................................................................
71
-4-
5. enviroGRIDS – FP7 European project
Building Capacity for a Black Sea Catchment
Observation and Assessment System supporting Sustainable Development
List of tables
TABLE
2.1
ARITHMETIC
OPERATORS
......................................................................................................................
13
TABLE
2.2
VEGETATION
INDEX
OPERATORS
.............................................................................................................
14
TABLE
2.3
CORRECTION
OPERATORS
.....................................................................................................................
15
TABLE
2.4
BAND
MANAGEMENT
OPERATORS
..........................................................................................................
15
TABLE
2.5
VIEW
AND
PSEUDO-‐COLOR
OPERATORS
...................................................................................................
16
TABLE
2.6
STATISTICAL
OPERATORS
......................................................................................................................
16
TABLE
2.7
CLASSIFICATION
OPERATORS
.................................................................................................................
16
TABLE
2.8
CLASS
FILE
FORMAT
.............................................................................................................................
17
TABLE
2.9
SCOPE
OPERATORS
..............................................................................................................................
17
TABLE
3.1
REMOTE
SENSING
INDICES
FORMULAS
WERE
USED
IN
THE
STUDY
TO
DEVELOP
NIR,
RED,
BLUE
DENOTES
REFLECTANCE
VALUES
DERIVED
FROM
LANDSAT
5
TM
BANDS
OF
B4,
B3,
AND
B1,
RESPECTIVELY
AND
C
1
=6,
C
2
=7.5
AND
L=1
FOR
EVI
INDEX.
............................................................................................................................
34
TABLE
3.2
GLOBAL
RS
DATA
RESOURCES
FOR
SWAT
APPLICATION
.............................................................................
49
TABLE
3.3
LIST
OF
PROVIDED
PRODUCTS
AND
THEIR
SELECTION
FOR
SWAT
RESULTS
VALIDATION
......................................
62
TABLE
3.4
LIST
OF
PROVIDED
PRODUCTS,
COVERED
PERIOD,
NUMBER
OF
DIFFERENT
DATES
SUPPLIED,
TOTAL
FOLDER
SIZE
......
63
TABLE
3.5
TESTED
PRODUCT
DESCRIPTION
.............................................................................................................
66
-5-
6. enviroGRIDS – FP7 European project
Building Capacity for a Black Sea Catchment
Observation and Assessment System supporting Sustainable Development
1. Introduction
1.1 Description of the work
The society needs and environmental predictions encourage the applications development, oriented on
supervising and analyzing different Earth Science related phenomena. This task concerns with
experimenting solutions by using visual descriptions of the satellite image processing over distributed
infrastructures, such as Grid infrastructure. The GreenLand application is developed over the ESIP
(Environment Oriented Satellite Data Processing Platform) and gProcess platforms and it is based on
simple, but powerful, notions of mathematical operators and workflows that are used in distributed and
parallel executions over the Grid infrastructure.
ESIP could be defined as a set of Web and Grid services, and image oriented basic operators such as
arithmetic (e.g. addition, division, exponent, complement etc), radiometric transformations (e.g. histogram
equalization, mean, histogram scaling etc), spatial domain transformations (e.g. blurring, convolution etc),
edge and line detection (e.g. gradient transformation), pseudo coloring, etc. The gProcess platform is used
as a middleware between the client application and the Grid infrastructure.
This task is responsible for two different subjects such as building the Environment Oriented Satellite Data
Processing Platform (ESIP) based on gProcess for environmental applications and determining
specifications for the platform based on three different hot spot inventory studies. The GreenLand
application is free Geographic Information System (GIS) software for geospatial data management and
analysis, image processing, graphics/maps production, spatial modelling, and visualization.
At the first stage, İstanbul case study conducted to examine basic image processing steps of medium
resolution Landsat 5 TM data to derive land use and land cover categories especially vegetated regions by
using different vegetation indices and density slicing classification.
A specific workflow, using GreenLand application, will be developed to facilitate the retrieval of large
dataset of existing Remote Sensing Products for the entire Black Sea watershed. First test implementation
will be run on two MODIS products; Leaf Area Index and Evapotranspiration as they have revealed a great
interest for validating SWAT results on a test site; Vit river basin in Bulgaria. Such an application will offer
an effective solution to improve data retrieval efficiency by giving an alternative of processing very large
datasets without caring about storage and calculation capacities. Moreover, by connecting the Greenland
application into the enviroGRIDS URM geo portal will encourage the reuse of already processed data
making those datasets easily accessible to enviroGRIDS consortium and users.
Data resources and methodologies outlined above are applied to handle hydrological modelling in the case
of Rioni River Basin, aiming to demonstrate the utility and compatibility of the combination of global
remote sensing and local hydrometeorological and other datasets in research and characterization of the
catchment hydrology. Objective of this particular case is to apply the remote sensing and modelling tools
(such as SWAT & ESIP), constituting integral components of the enviroGRIDS BSC Observation System.
1.2 Contributors
İstanbul Technical University: http://www.itu.edu.tr/
Filiz Bektas Balcik
Dr. Filiz BEKTAS BALCIK is an Assistant Professor at İstanbul Technical University (ITU), Department
of Geomatic Engineering. She received her PhD degree in 2010 from the same faculty at ITU. Her PhD
subject is related with wetland vegetation discrimination and mapping by using multispectral and
hyperspectral remotely sensed data. She did a part of her PhD research at International Institute for Geo-
Information Science and Earth Observation (ITC), Natural Resource Department, in the Netherlands while
she was a Huygens Nuffic PhD Scholar (2 years). She was involved in several environmental projects as a
-6-
7. enviroGRIDS – FP7 European project
Building Capacity for a Black Sea Catchment
Observation and Assessment System supporting Sustainable Development
researcher in the field of remote sensing applications on land use/land cover change detection, urbanization,
forestry, and biophysical and biochemical characteristics of savanna vegetation (in the South Africa).
Within the enviroGRIDS project, she will be involved in WP2 (Task 2.4 and Task 2.11) and WP5
(Biodiversity, Health and Energy tasks) as Remote Sensing and GIS analyst.
Cigdem Goksel
Dr. Cigdem GOKSEL is an Assistant Professor at the Istanbul Technical University (ITU), Department of
Geomatic Engineering. She received her B.Sc. degree from Geodesy and Photogrammetry Engineering
from ITU, Faculty of Civil Engineering in 1984. She received her graduate degrees M.Sc. (1989) and Ph.D.
(1996) from the same faculty in the field of Geodesy and Photogrammetry Engineering. She was visiting
scholar at Murray State University’s Mid-America Remote Sensing Center (Geosciences) KY – US during
six months in 1999. Her research interests are in monitoring of landuse/landcover changes and in remote
sensing and GIS integration for environmental studies. She supervised several research studies and projects
in the field of remote sensing and integrated technologies. She has 75 scientific publications related with
different remote sensing applications such as water basin monitoring, urbanization detection, coastal line
and epidemiologic studies.
She will be involved in enviroGRIDS in WP2 ((Task 2.4 and Task 2.11) and WP5.
Seval Sözen
Prof. Dr. Seval SOZEN is professor at the Istanbul Technical University (ITU), Department of
Environmental Engineering. She received her B.Sc. degree from Environmental Engineering from ITU,
Faculty of Civil Engineering in 1985. She received her graduate degrees M.Sc. (1987) and Ph.D. (1995)
from the same faculty in the field of Environmental Engineering.
Dr. Sözen has 26 years of teaching and research experience in the field of Environmental Science and
Technology. Her research spans environmental biotechnology (activated sludge modeling, biological
nutrient removal etc.), industrial pollution control, waste management, integrated water management and
water quality modeling. She has directed and supervised numerous research studies and projects in the field
of wastewater management, industrial pollution control, kinetics of biological processes and integrated
water management. She holds a long list of scientific publications with over 100 papers, which received
more than 500 citations.
Her key personal and academic skills include; broad knowledge of environmental and other sciences,
strong skills in applied environmental sciences, strong understanding of biological processes theory gained
from undergraduate and postgraduate study and her research experience, proven skill in water and
wastewater treatment plant design and modeling, experience in writing research and other proposals for
funding and other agencies throughout her academic career, proven organizational and academic
management skills, commercial and governmental consultancy experience, extensive publishing, editing,
and presentation track record.
Dr. Sözen supervised five European Commission (EC) funded projects at ITU. She is also trainer in
Emergency Management certified by the Federal Emergency Management Agency, USA. She was awarded
an incentive by the Scientific and Technical Research Council of Turkey in the engineering branch in 2000.
She will be involved in EnviroGRIDS as the leader of WP5 and will specifically contribute in biodiversity,
health and energy tasks. She will also promote WP2 in the evaluation of remote sensing data.
UNIGE: http://www.unige.ch/envirospace & UNEP/GRID-Geneva : http://www.grid.unep.ch
Karin Allenbach
Karin Allenbach obtains a multidisciplinary master in Earth Sciences. She pursued a postgraduated
certificate specializing in remote sensing and GIS. In 2004, she started to work at UNEP/GRID-Geneva,
where she was monitoring algal bloom and identifying land-based pollution on coastal water in the eastern
part of the Mediterranean using low resolution imagery (SeaWiFS). Since then, she has been involved in
-7-
8. enviroGRIDS – FP7 European project
Building Capacity for a Black Sea Catchment
Observation and Assessment System supporting Sustainable Development
numerous projects using low to very high resolution imagery to monitor and classify the environment on an
object analysis basis.
- IMOS: monitoring re-flooding and vegetation growth on Iraqi marshlands using low resolution imagery
(MODIS) http://imos.grid.unep.ch/
- SwissED: Swiss Environmental Domain classification consists on grouping together pixels of similar
environment rather than geographic, creating an innovative spatial framework for environmental reporting.
- Landcover-landuse classification of Geneva’s canton and surrounding based on aerial photography and
medium resolution imagery (SPOT)
- Cartography of naturals habitats of Geneva’s canton and surrounding based on aerial photography and
medium resolution imagery (SPOT)
In enviroGRIDS project, she will be involved in WP2 (Task 2.4 and Task 2.11) as a Remote Sensing
Analyst.
GeoGraphic : http://www.GeoGraphic.ge
Mamuka Gvilava
Mamuka Gvilava is engaged by the GIS and RS Consulting Center "GeoGraphic", Georgia, as the Task
Manager responsible for GeoGraphic’s contribution into the enviroGRIDS Project. He is specialized in a
wide range of environmental subjects with more than 10 years of experience gained with cooperative
projects in Georgia and in the Black Sea region.
Physicist with education and science degree, re-expanded his field of activities to environmental and social
subjects, such as integrated coastal management, environmental informatics (GIS & RS, with particular
experience in setting up the coastal monitoring and information systems for Georgia), environmental and
social impact assessment, as well as the application of green design and development methodologies.
He combines his practical hands-on experience in environmental management and research with wider
scope of policy advice serving the Ministry of Environment as the National Focal Point on Integrated
Coastal Zone Management (ICZM) and the Georgian Member of the ICZM Advisory Group to the Black
Sea Commission. Mamuka Gvilava is based in Tbilisi, Georgia, and is employed by "GeoGraphic" to lead
its enviroGRIDS team in implementing WP2 (Task 2.4 and Task 2.11) and WP7.
UNIGE: http://www.unige.ch/envirospace ACQWA [Assessing climate change impact on quality and
quantity of water. www.acqwa.ch ]
Kazi Rahman:
Expertise area: hydrology, watershed modelling, climate change impact assessment in complex
environment, currently pursuing his PhD program at the University of Geneva. He obtained his M.Sc in
Water Resources Engineering from Virje university of Brussels focusing hydrodynamic model for flood
frequency analysis.
Mr. Rahman has sound understanding on Soil and Water Assessment Tool (SWAT), an open source tool to
analyze complex environmental issues like discharge, water quality, sediment transport and soil moisture
for agricultural production.
Besides hydrological modelling he is familiar with high performance computing application in watershed
modelling. He has experience working with computing language like MATLAB, FORTRAN and R. His
PhD is funded by the EU large scale research project ACQWA [Assessing climate change impact on
quality and quantity of water. www.acqwa.ch ]. In the enviroGRIDS project he enjoys working as volunteer
in data processing for developing hydrological model.
The Technical University of Cluj-Napoca (UTC) http://www.utcluj.ro/
-8-
9. enviroGRIDS – FP7 European project
Building Capacity for a Black Sea Catchment
Observation and Assessment System supporting Sustainable Development
Dorian Gorgan
Dorian Gorgan is professor and PhD supervisor in Computer Science at the Technical University of Cluj-
Napoca. He graduated Computer Science and Automation from "Politechnica" University of Timisoara, has
PhD in Graphical Modelling and Simulation, Visual Programming, and Graphical User Interfaces at the
Technical University of Cluj-Napoca. For two years he gave technical and scientifical consultancy in
Autodesk’s projects (in Milan, Italy) in the fields of location based services (LBS) and geographical
information systems (GIS). He is the chair of the CGIS (Computer Graphics and Interactive Systems)
Laboratory, director of the MedioGrid project, a Grid software and hardware infrastructure supporting the
development of the environmental and geographical applications.
Danut Mihon
Danut Mihon is a second year PhD student at Technical University of Cluj-Napoca with extensive
experience in developing interactive applications for processing and visualization of spatial data over the
Grid infrastructure. He is part of the CGIS (Computer Graphics and Interactive Systems) Laboratory and it
is involved in several environmental and remote sensing projects funded by the European Union. His work
is also confirmed by the national and international list of publications.
2 ESIP platform and GreenLand Application
2.1 ESIP platform
The Environment oriented Satellite Data Processing Platform (ESIP) (Bâcu et al., 2010) is based on the
gProcess (Bâcu et al., 2009) platform. ESIP could be defined as a set of Web and Grid services, and image
oriented basic operators such as arithmetic (e.g. addition, division, exponent, complement etc), radiometric
transformations (e.g. histogram equalization, mean, histogram scaling etc), spatial domain transformations
-9-
10. enviroGRIDS – FP7 European project
Building Capacity for a Black Sea Catchment
Observation and Assessment System supporting Sustainable Development
(e.g. blurring, convolution etc), edge and line detection (e.g. gradient transformation), pseudo coloring,
geometric transformations (e.g. rotation, scale etc), statistics (e.g. compute histogram, standard deviation
pixel values etc), and spatial domain transforms (e.g. forward and inverse Fourier transformation etc).
2.1.1 ESIP Overview
The ESIP platform uses process description graphs to define algorithms implemented as executable
workflows. A process description graph (PDG) is represented like a DAG (Direct Acyclic Graph) by
composing basic operators, services and sub-graphs. The operators are always identified as atomic
components and represent the smallest ESIP unit that could be executed without further decomposition.
Some components can be already developed as Grid or Web services, and by combining this functions, we
could benefit of code reusability. In some cases, a subset of a graph can be used in creating hyper-graphs
that in the Grid execution phase are expanded into their corresponding basic operators. The PDG represents
a pattern that does not specify any particular inputs for these operators. We are specifying only the input
type (e.g. satellite image, integer, float, string, etc.) but not the concrete value. By attaching input resources
to the PDG, we obtain an iPDG (instantiated Process Description Graph). Only the iPDGs can be executed
over the Grid infrastructure.
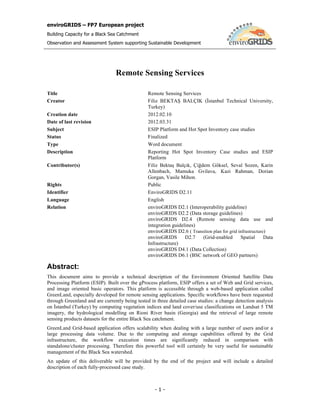
2.1.2 ESIP Architecture
The ESIP platform is an interactive toolset supporting the flexible description, instantiation, scheduling and
execution of the Grid processing. The ESIP is built over the gProcess platform that represents a collection
of Grid services and tools providing the following basic functionality:
Visual manipulation based interactive description of the Grid based satellite image processing by pattern
workflow like directed acyclic graph (DAG);
Development of hyper-graphs as combinations of basic operators, Grid and Web services, and sub-graphs;
Pattern workflow instantiation for particular satellite image;
Satellite data management, access and visualization;
Process execution control and visualization;
Optimal execution for appropriate mapping of the processing over the Grid resources. The optimal
processing is achieved in terms of code optimization, total execution time, and data communication costs
over the Grid.
- 10 -
Figure 2.1 ESIP related architecture
11. enviroGRIDS – FP7 European project
Building Capacity for a Black Sea Catchment
Observation and Assessment System supporting Sustainable Development
The ESIP structure, from architectural point of view, is represented by the gProcess internal design that is
based on a client-server model (Figure 2.1). Different components (Editor, Manager and Executor) that
have a Web service interface and a user interaction component, make part of the ESIP platform. The Web
services are used to expose different functionality and the interaction components respond to the requests
initiated by users at the GreenLand graphical interface level. The EditorWS provides information about
available resources (e.g. lists of operations, sub-graphs, services, satellite image types, data types etc).
Information about workflows (i.e. PDG, iPDG) and fetching and uploading resources (e.g. workflow,
operators, services, sub-graphs, data, etc.) are retrieved by the ManagerWS.
The ExecutorWS executes instantiated workflows (iPDG) over the Grid infrastructure. Another feature of
the ExecutorWS is the monitoring of workflows execution. The EditorIC supports the user’s editing
operations for workflow development. The ManagerIC instantiates workflows for particular satellite data
and manage the model resources (e.g. operators, services, sub-graphs, satellite data, etc.). The ViewerIC
displays the input and output data (e.g. initial and processed satellite images) on the client site, and gets and
displays the monitoring data.
At the server side the Grid infrastructure supports the access to computing resources and distributed
databases through a set of services such as EditorWS, ManagerWS, ExecutorWS, and ViewerWS. The
client side encapsulates Client Java API, User Oriented Application Level, and the software applications,
such as GreenLand. The Web and desktop applications access the gProcess services by the Client Java API
level. A set of user interaction supporting components, such as EditorIC, ManagerIC, and ViewerIC are
exposed through the User Oriented Application Level. The last level of Applications combines the editor,
manager, and viewer related functionality into complex user interaction tools.
2.1.2.1 Grid infrastructure
The Grid infrastructure (Mihon et al., 2010) is the execution environment where all the data processing takes
place. Every environmental application has a characteristic set of features, corresponding to the applicability
domain (e.g. meteorology, soil pollution, water pollution, etc). These applications require large input data
sets, that mainly consists of satellite images, like: MODIS (Moderate Resolution Imaging
Spectroradiometer), Landsat, Meris or QuickBird (some of them up to 1Gb in size).
Another important aspect regards the fact that all the applications in the Earth Science domain are using
algorithms based on big sets of parameters that have to be combined in a certain way in order to obtain the
correct results.
- 11 -
12. enviroGRIDS – FP7 European project
Building Capacity for a Black Sea Catchment
Observation and Assessment System supporting Sustainable Development
This means that on a standalone machine, obtaining reasonable execution times is almost impossible. Grid
infrastructure offers the solution to this problem, by providing parallel and distributed computation
methods. This means, that an application is divided into atomic components that could be executed on more
than one Grid nodes. In order to run a Grid based application, all the input datasets and dependency files
should be sent to a Storage Element inside the Grid infrastructure. Then the execution step follows, right
after the files are copied with success.
Grid applications are, in general, very complex and time consuming. Keeping in mind the distributed nature
of the Grid, the applications were divided into atomic components (jobs), which can be executed in parallel
on the Grid nodes. There are many languages for the description of the environmental applications that
allow the user to specify the characteristics of their applications to be run on the Grid. These languages are
divided in two main categories: script-based and workflow-based. There are several languages used to
describe these characteristics: JSDL (Job Submission Description Language), GXML (Guideline XML) or
JDL (Job Description Language). Most of these languages assume that the applications can be represented
as a set of jobs. This entire workflow is graph-structure based, where the nodes represent the jobs and the
edges describe the execution path of the application.
All the GreenLand data processing is executed over the envirogrids.vo.eu-egee.org Virtual Organization
(VO). The RO-09-UTCN site is part of this VO and it contains 1024 worker nodes and 13TB of storage
space. Some tests were also conducted on the AM-02-SEUA site that encapsulates 48 worker nodes.
2.1.3 Workflow Based Description
2.1.3.1 Process Description Graph
The Process Description Graph developed in the scope of the gProcess platform is defined as a directed
acyclic graph (DAG). The nodes describe resources, processing entities and the connections between those
components. The following types can be used to define the structure of such a graph: resources, operators,
services and sub-workflows (Figure 2.2).
Resource nodes: encapsulate a unique name and a general description. They may represent any of the
following: images, temperature files, including primitives like strings, integers or floats;
Operator nodes: have the same basic description as above but they contain a link toward an executable file
which gives the node its processing capabilities;
Service nodes: are described by service name and description as well as by method name and its
corresponding description;
Sub-graph nodes: represent the workflow of an algorithm and provide a structure which is easily
extendable. It facilitates the possibility to include a graph inside another graph thereby providing the
possibility to combine different algorithms together and execute them as a single one.
- 12 -
13. enviroGRIDS – FP7 European project
Building Capacity for a Black Sea Catchment
Observation and Assessment System supporting Sustainable Development
Figure 2.2 PDG internal structure
2.1.3.2 Instantiated Process Description Graph
The instantiated Process Description Graph is a variant of the PDG; it provides additional information to
the later, instantiating the resource nodes by specifying the values for the inputs. There are two types of
resources which can be used: files or primitive types. The previous are instantiated by a path towards the
input file while the second represents a string which can be parsed to the type mentioned within the PDG
description file.
2.1.4 Basic Operators Library
The GreenLand application is based both on simple and complex operators, which gives the user the
possibility to choose the granularity that he desires. Complex operators can be created from simpler ones by
virtue of the Process Description Graphs, which may be used to compose the fine grained operations based
on the simple or basic operators.
To be noted is the fact that all operations performed in GreenLand are done through Grass operators
(Neteler and Mitasova, 2004), be they simple/basic operators or alternatively complex/GRASS based
processing. Currently there exist a series of basic operators included within the GreenLand application.
They represent mainly arithmetical operators as listed it the following tables:
Table 2.1 Arithmetic operators
Arithmetic Operators
Add- Adds the value of 2 single band images Inputs:
1
pixel by pixel. 1.Single band GeoTiff.
Subtract-Subtracts the value of the second 2.Single band GeoTiff.
2 single band image from the first single band Outputs:
image pixel by pixel. 1. Single band GeoTiff.
- 13 -
14. enviroGRIDS – FP7 European project
Building Capacity for a Black Sea Catchment
Observation and Assessment System supporting Sustainable Development
Multiply- Multiplies the value of 2 single band
3
images pixel by pixel. Notes: Operations are done at pixel level.
Divide-Divides the first single band image by
4
the first one pixel by pixel.
AddConstant-Adds a constant value to the
5
single band image.
Inputs:
SubtractConstant- Subtracts a constant value 1. Single band GeoTiff.
6
form the single band image. 2. Constant value represented by a floating point
MultiplyConstant- Multiplies the single band number.
7 Outputs:
image by a constant value.
1. Single band GeoTiff.
DivideConstant- Divides a single band image by
8
a constant value.
Future operators may include: Convolution Operators, Forward Fourier Transform, Inverse Fourier
Transform and further Mathematical Operators (OR, XOR, LOG, EXP, etc). The list of operators is not a
complete one, since no specific request for implementation has been issued so far.
2.1.5 GRASS Based Processing
Grass based processing also includes the basic operators set. What detaches the operators described in this
section from the rest is the fact that they operate exclusively on satellite images. The ones described above
can operate on any given type of image.
The project so far has been interested in developing operators for raster images but future iterations and
developments may also include vector images and 3D raster images. The raster Grass Operators
implemented so far could be classified as: Vegetation Index, Correction, Band Manipulation, View and
Pseudo-Color, Statistics, Classification, Scope and Miscellaneous Operators.
Table 2.2 Vegetation index operators
Vegetation Index
NDVI-Normalized Difference Vegetation Index Inputs:
1.Image representing the Red band (Geotiff)
Takes two singleband images and creates a
2.Image representing the NIR band (Geotiff)
Normalized Difference Vegetation Index
1. image
Outputs:
1. NDVI image band (Geotiff). Each pixel is in
the [0,1] range
EVI-Enhanced Vegetation Index Inputs:
1.Image representing the Blue band (Geotiff)
2. Takes three singleband images and creates an
2.Image representing the Red band (Geotiff)
Enhanced Vegetation Index image,
3.Image representing the NIR band (Geotiff)
highlighting areas of increased vegetation
- 14 -
15. enviroGRIDS – FP7 European project
Building Capacity for a Black Sea Catchment
Observation and Assessment System supporting Sustainable Development
Outputs:
1. EVI image band (Geotiff). Each pixel is in the
[0, 1] range
GEMI-Global Environmental Monitoring Inputs:
Index 1.Image representing the Red band (Geotiff)
2.Image representing the NIR band (Geotiff)
Generates a Global Environmental Monitoring
3.
Index image, based on two singleband images
Outputs:
1. GEMI image band (Geotiff). Each pixel is in
the [0, 1] range
Table 2.3 Correction operators
Correction
DOS-Dark Object Subtraction r.mapcalc – Removes haze from image using a
1. dark object. One may specify the size of the
Removes haze caused by atmospheric
object (pixels).
phenomena. It operates on a singleband image
Landsat Atmospheric Correction- Inputs:
1.Landsat singleband image (Geotiff)
operator is used in removing any kind of
2.MTL or MET file representing atmospheric
atmospheric interference
conditions as detected by the satellite or added at
2.
a later stage
Outputs:
1. Geotiff image with atmospheric interference
removed
Table 2.4 Band management operators
Band Manipulation
Inputs:
Extract Band-
1.Multiband image from which a certain band
Extracts bands from Geotiff multiband images will be extracted (Geotiff)
1. 2.Band to be extracted (Integer)
Outputs:
1. Extracted singleband image (Geotiff)
Inputs:
Combine Bands-
1.Multiband or singleband image (Geotiff)
Generates a multiband image, based on two 2.Multiband or singleband image (Geotiff)
single banded (or multibanded) input images
2.
Outputs:
1.Multiband Geotiff image, which represents a
combination of the previous in the order that
they were given
- 15 -
16. enviroGRIDS – FP7 European project
Building Capacity for a Black Sea Catchment
Observation and Assessment System supporting Sustainable Development
Table 2.5 View and pseudo-color operators
View and Pseudo-Color
View-
Inputs:
Normalizes the image in the [0,255] pixel
range 1.Image to be made viewable (Geotiff)
1.
Outputs:
1.Viewable image created by automatic
transformation (Geotiff)
ViewInterval- Inputs:
Normalizes the image in the [0,255] pixel 1.Image to be made viewable (Geotiff)
range 2.Minimum value of pixel band (Float)
3.Maximum value of pixel band (Float)
2.
Outputs:
1.Viewable image created by manual
transformation (Geotiff)
Pseudo-Color- Inputs:
Combines three single banded images into a 3 1.Image representing the Blue band (Geotiff)
layer colored one 2.Image representing the Green band (Geotiff)
3.Image representing the Red band (Geotiff)
3.
Outputs:
1. Resulting pseudo-Color multiband image
(Geotiff)
Table 2.6 Statistical operators
Statistics
Statistics- Inputs:
Returns the statistic information about an 1. Single band image (Geotiff)
image.(histogram) Outputs:
1
1.Statistics file containing a histogram given in
pixels and the covered area
Information- Inputs:
Returns the general information about an 1. Single band image (Geotiff)
2 image. Outputs:
1.File containing general information about the
image
Table 2.7 Classification operators
Classification
1 Supervised Classification- Inputs:
Generates a classification map based on a 1. Multibanded image (Geotiff)
multibanded image(representing the feature 2. Vector image, providing supervised
- 16 -
17. enviroGRIDS – FP7 European project
Building Capacity for a Black Sea Catchment
Observation and Assessment System supporting Sustainable Development
vector) and spectral signatures provided classification control points. (ascii)
through a vector map.
Outputs:
1.single band image(Geotiff)
Unsupervised Classification- Inputs:
Genereates a classification map based on a 1. Multibanded image (Geotiff)
multibanded image (representing the feature 2. Classification Arguments file (Class).
2
vector) and a settings file (representing the
parameters of the classification ex: nr. of Outputs:
classes, iterations, convergence, etc.) 1.single band image(Geotiff)
Table 2.8 Class file format
Format of Class File
[classes={integer}
NEWLINE]
DEFAULT
VALUE=10
[min_size={integer}
NEWLINE]
DEFAULT
VALUE=17
[iterations={integer}
NEWLINE]
DEFAULT
VALUE=30
[convergence={floating
point
(50.0-‐100.0)}
NEWLINE]
DEFAULT
VALUE=98.0
[separation={floating
point}
NEWLINE]
DEFAULT
VALUE=0.0
The operators described above use the maximum likelihood algorithm in order to classify each unit of
information (pixel). Further operations to be implemented within the scope of the current group are:
Recoding, Density Slicing and Accuracy Assessment.
Table 2.9 Scope operators
Scope
SetProjection-
Inputs:
Reprojects and changes the geographic
reference of images.
1.
Geographically
referenced
Image
(Geotiff)
1
2.
Projection
File
(PROJ4)
3.
Region
File
2 GetProjection- Inputs:
- 17 -
18. enviroGRIDS – FP7 European project
Building Capacity for a Black Sea Catchment
Observation and Assessment System supporting Sustainable Development
Extracts the projection of a given image 1.Singleband image (Geotiff)
Outputs:
1.Projection file (PROJ4)
SetRegion- Clips images to a given region. Inputs:
1.Image to be either clipped or reprojected
(Geotiff)
2.Region to which the image shall be clipped
3
(internal grass region file)
Outputs:
1.Clipped image (Geotiff)
GetRegion- Inputs:
Extracts the region of a given image 1.Singleband image (Geotiff)
4
Outputs:
1.Region file
Mosaic- Inputs:
Mosaics two adjacent singleband images 1.First adjacent image (Geotiff)
2.Second adjacent image (Geotiff)
5
Outputs:
1.Mosaicked singleband image (Geotiff)
All images within scope operations must be geographically referenced. Images not containing any kind of
geographic reference cannot be used as input for the scope operators. No operators belonging to the
miscellaneous group have been implemented yet. Future operations include coordinate sampling.
2.2 GreenLand Application
The GreenLand application is free Geographic Information System (GIS) software for geospatial data
management and analysis, image processing, graphics/maps production, spatial modelling, and
visualization. In particular this application represents a case study for the Istanbul geographical area and for
the Rioni river, situated in the western part of Georgia. Because GreenLand operates mainly on satellite
images – containing in some cases high confidential data – the Grid infrastructure adds an extra security
layer (based on Grid certificates), besides the Web user authentication mechanism.
2.2.1 GreenLand Overview
The majority of the operators are based on mathematical formula. The GreenLand application tries to hide
their complex definitions by describing them as nodes within a graph, called workflow. The main objective
of the GreenLand application is the generation and execution of workflows, based on satellite images. In
this case each workflow could be represented as a DAG (Direct Acyclic Graph). The nodes of the graph
could take the form of a simple operator or a sub-workflow. Multiple nested levels are allowed within the
GreenLand application. The GreenLand is a Grid based application that offers scalability when dealing
with large number of users and large processing data volume. Due to the computing and storage capabilities
offered by the Grid infrastructure, the workflows execution times are significantly improved in comparison
with standalone/cluster processing. Various inputs are supported in the framework of this application, such
as: satellite images (Landsat, MODIS, Aster, etc.), executable files, primitive inputs (numbers, strings,
boolean values).
- 18 -
19. enviroGRIDS – FP7 European project
Building Capacity for a Black Sea Catchment
Observation and Assessment System supporting Sustainable Development
2.2.2 GreenLand Architecture
The GreenLand is a web based application, implementing the client-server standard (Figure 2.3). The client
side is developed using the Adobe Flex 4 technology. The server side is Java based, and uses MySql
database for storing useful information. The connection between the client side and the Grid infrastructure
is based on rest services, resident on the GreenLand application server.
The only way for a user to access the backend functionality of the GreenLand application is through its
graphical user interface. In order to hide the complexity of the Grid mechanisms, the GreenLand
application could be easily accessed as a Web application.
The rest services exposed by GreenLand are resident on the application server. When needed, they could be
easily transferred to other locations without affecting the application functionality. These services manage
the execution and monitoring of the workflows over the Grid infrastructure, but also the analysis and
interpretation of results. The development of customized workflows is another issue related to this
architectural level.
The gProcess platform interprets user requests in terms of Grid infrastructure commands. The ESIP
platform is represented in this architecture as a repository that collects the general information about each
workflow. A detailed description of these workflows is stored in the GreenLand repository.
Figure 2.3 GreenLand system related architecture
2.2.3 Use Case Scenarios in GreenLand Application
This section describes the actions flow that a user needs to follow in order to execute different kinds of
processes over the Grid infrastructure (Gorgan et al., 2010). Because this application runs over the Internet
layer, it allows the users the possibility to access it all over the world, from different physical machines,
even from mobile devices. There are three major functionalities offered throughout the GreenLand
application:
• Preprocessing phase: allows the user to prepare all the input data that is going to be used in further
Grid execution processes. At this stage the user selects all the workflows included in these
processes, specifies different attributes, groups workflows into projects, etc.;
• Execution phase: closely related with the Grid based processing. This step is performed in the
background and tries to hide the complex functions used to launch such processes;
• Monitoring phase: displays the Grid execution status in a friendly manner by using different user
interaction techniques at the application graphical interface level. All the time the user is notified
about the execution progress and it has the possibility to interfere in the overall execution process.
- 19 -
20. enviroGRIDS – FP7 European project
Building Capacity for a Black Sea Catchment
Observation and Assessment System supporting Sustainable Development
This phase also includes the results management, where all the outputs generated by Grid
executions are at the user discretion.
The following sections detail all the phases of this use case scenario, by highlighting theoretical and
practical solution implemented within the GreenLand application. All the required steps that allow the user
a correct usage of the platform are also described in the following paragraphs.
2.2.3.1 Processing Description
Before starting any kind of processing over the Grid infrastructure the user should verify if all the input
data are properly specified for all the workflows attached the selected project. By default the GreenLand
application set standard values for each type of input:
• The first image, from the available user images list, in case the input type is identified as
GeoTIFF;
• For integer of float types the default value is set to 0;
• For text based inputs, the empty string is used.
This processing description phase allows the user to prepare all the required data that is going to be used in
Grid processing. The steps that are described in the following paragraphs are organized as phases in the
GreenLand usage scenario:
A. User authentication
In order to access the GreenLand functionalities the user should first sign in the application. The
username and password are mandatory in this type of process. It is worth to mention that when a
new user account is created, also a new project is automatically generated by the application
(called Default project) that could be further used in the Grid based process executions.
B. Graphical user interface – general overview
The user interface consists of six main modules that are organized in such way in order to increase
the degree of usability for the entire application. A short description of each module is presented
below:
• User information: display the basic information of the logged in user;
• Application logos: visual representation of the GreenLand application and the
enviroGRID project;
• Menu options: contain the most used set of operations. Other actions will be provided as
sub-option of this menu set;
• Projects list: one of the concepts that are regularly used within the GreenLand framework
is the project one. A project represents the basic structure of the application that could be
processed over the Grid infrastructure. It has a unique name, provides a suggestive
description and allows multiple workflows attachment. It has a status that offers
feedback about its behavior (e.g. “Executing project” means that the project is in the
Grid execution phase and when this phase ends it will automatically set the “Execution
completed” status).
Each user has a list of active projects that could be updated with new data or could be
deleted together with the content and their output results. Creating a new project is
another available option for the logged in user;
- 20 -
21. enviroGRIDS – FP7 European project
Building Capacity for a Black Sea Catchment
Observation and Assessment System supporting Sustainable Development
• Workflows list: the workflow is another key-concept introduced by the GreenLand
application. A workflow is a graphical representation of a mathematical formula
encapsulated within operators. In its simplest form, a workflow identifies with a basic
operator. Complex workflows contain a group of operators, or sub-workflows linked
together by uni-directional communication channels. Each channel describes the order
used for executing the workflow and connects the output of an operator/workflow with
the input of another operator/workflow.
Cyclic graphs are not allowed within the workflow’s internal structure. Multiple nested
levels are supported by each workflow (e.g. a workflow could contain another workflow
that in turn it could have other inside workflows, and so on).
Each project contains a list of workflows. When a new project is created this list is
empty. That is why the default status for the project is set to “Empty project”. It is up to
the user to specify what kind of workflows it would like to add to the current selected
project;
• General information window: details all the actions performed by the user at the
graphical interface level as highlighted in Figure 2.4 (e.g. when a project is selected it
offers information about it. Or when a workflow is selected this module allows the user
to view all the inputs of the workflow and to add them the required values).
Figure 2.4 User's project details module
C. Project management
The next step of this use case scenario consists in creating a new project. This is done by using the
Create project menu option. All the user actions performed at the graphical interface level
correspond with a specific server side service. In this case the createProject service will be
- 21 -
22. enviroGRIDS – FP7 European project
Building Capacity for a Black Sea Catchment
Observation and Assessment System supporting Sustainable Development
invoked. Such a communication is always initiated by the GreenLand interface that sends a list of
parameters that describe the action behavior. The server side script is executed in the background
and after it finishes, it generates a response that is send back to the application graphical interface.
The response is processed and displayed to the user in different formats: message, execution
progress, list of operators, list of available input data, etc.
Each project requires a unique name and a short description in order to be easily identified when
the projects list grows in size. After that it is automatically added to the user’s projects list where it
displays the date when it was created and the “Empty project” status (Figure 2.4). Other possible
statuses for a project are listed below:
• Content provided: the project contains a non-empty workflows list;
• Pending execution: the user request for a Grid processing, but the data is not completely
sent to the processing nodes;
• Executing project: all the input data and the external dependencies were successfully
transferred to the Grid worker nodes and the execution is in progress;
• Execution completed: this status is generated after the project execution finishes and the
results are available for analysis and interpretation;
• Incomplete execution: generated by network failure. Once the situation is back to normal
the data processing is automatically resumed from the last point of execution;
• Error: generated by sever technical issues regarding the Grid infrastructure. In this case
the execution should be start all over again.
Updating a project with a new name or description is another option provided by the GreenLand
application. Also for an existing project new workflows could be added or the user is allowed to
remove some of the old ones.
All projects could be deleted by the user that created them. The “Pending execution” and
“Executing project” projects are exceptions for the deletion rule.
D. Workflow management
The “Empty project” status is displayed each time the user creates a new project. All the items
listed in the Workflows list could be used as content for the new generated project. In order to
access this list the user could use the Add workflows menu bar option. After that it may perform
multiple workflows selection from the right hand side list. The list item click action takes the user
to a help page that describes with technical details the inputs, outputs and the behavior of this
workflow (Figure 2.5).
It is worth to mention that multiple instances of the same workflow could be added to the same
project. Because each item added to the project should have a unique name (Figure 2.5), all these
instances will be automatically renamed by adding an underline character (“_”) followed by the
index of that instance (e.g. NDVI_1, NDVI_2, NDVI_3, etc.).
Removing workflows from a project is another feature implemented within the GreenLand
application. This operation is performed through the Remove workflow menu option and it
affects all the selected workflows from the list attached to the current project.
Adding and removing workflows to a specific project is not a persistent operation. This means that
on the next sign in action the user will find this project to be empty. In order to achieve this
purpose, the Start project button should be used. By using this option all the relations established
at the graphical interface level are also defined in the GreenLand database.
- 22 -
23. enviroGRIDS – FP7 European project
Building Capacity for a Black Sea Catchment
Observation and Assessment System supporting Sustainable Development
For each workflow that is added to the current selected project the user is able to specify a list of
inputs. Update the workflow name and description is also supported by the GreenLand
application. More information about adding these inputs are described in the chapter entitled Grid
based process execution.
Figure 2.5 Add workflows to project
E. Upload external data
After the project contains all the needed workflows, the next step consists of specifying the inputs
for all these workflows. In case an operator requires a satellite image as input the user should
select it from its own data, or from public data uploaded by other users. There are three options for
uploading data into the GreenLand application, based on OGC services, FTP or http data transfer.
It is worth to mention that after all these satellite images are completely transferred a conversion
mechanism will try to convert them into multiple single-banded images. If the conversion
succeeds then these bands of image could be used as inputs for the Grid executions, otherwise an
error message will be displayed.
In order to upload external data the user should access the DataMng. menu option. The following
features are supported by this option:
• Upload local files
Allows the user the possibility to upload into the GreenLand data repository the files
stored onto its own physical machine. This action is performed based on the http
communication protocol. Multiple files upload is also a supported feature in the
framework of this application.
In order to attach these files the user should be able to browse the folders and files
structure. This operation is done through the Attach files button. At any time the user is
- 23 -
24. enviroGRIDS – FP7 European project
Building Capacity for a Black Sea Catchment
Observation and Assessment System supporting Sustainable Development
allowed to cancel the upload process, by using the Cancel upload button. The data
transfer progress is represented through a progress bar (Figure 2.6).
Figure 2.6 Upload local files panel
• Use OGC services for data retrieval
Data transfer based on OGC services is another feature implemented within the
GreenLand application. This operation requires from the user only the http address of the
server that hosts these services. By requesting the GetCapabilities xml file, the
application will display a list of layers provided by this service and allows them to be
overlapped over an interactive map. This operation is identified as WMS (Web Map
Service) and its one of the three most important features provided by the OGC services.
The WMS implementation has only an interactive data visualization effect. The actual
data transfer is based on the WCS (Web Coverage Service) that is also supported by the
GreenLand application. When selecting an item from the layers list, some details about
this layer are automatically extracted from the GetCapabilities file: width and height of
the geographical area, type of projection, OGC version, etc. Each of this information is
editable by the user. Generally speaking, each layer covers a large geographical area. The
user, in most cases, is interested in collecting data for a smaller region. That is why the
GreenLand application allows the map based geographical area selection that will be used
in the data retrieval process (Figure 2.7).
The data that will be generated by the WCS service will have the GeoTIFF format and it
will be available as a static image. All the previous mentioned parameters (image width
and height, geographical area boundaries, etc.) are used in the request call of retrieving
the corresponding data from the WCS service.
- 24 -
25. enviroGRIDS – FP7 European project
Building Capacity for a Black Sea Catchment
Observation and Assessment System supporting Sustainable Development
Figure 2.7 OGC service based data retrieval panel
• Use FTP protocol for data retrieval
By using the FTP protocol the user is able to specify remote files in the Grid based data
processing. This requires the input of a FTP server address, followed by a username and
password authentication or by an anonymous authentication (Figure 2.8). At this moment
only a single file could be transferred at a time, but the improvement of this feature is
already one concern for the next GreenLand version. At any moment the user is able to
cancel the data transfer.
Specifying the file access type (private of public) is also supported. If the user has
another image with the same name an error message will be displayed and the FTP data
transfer will not be performed.
Figure 2.8 FTP based data retrieval panel
- 25 -
26. enviroGRIDS – FP7 European project
Building Capacity for a Black Sea Catchment
Observation and Assessment System supporting Sustainable Development
No matter what option for data uploading will be performed by the user, the conversion
mechanism will be applied on each new image transferred to the GreenLand data
repository. Based on the conversion result one of the following statuses will be set up for
each uploaded image: Checking (in progress operation), Valid (operation succeeds), Error
(the image is not compatible with the GreenLand internal format). Only images that
display the Valid status could be used as inputs for the workflows execution. The user has
the possibility to perform data management operations on all of its uploaded images, by
using the My files option. This feature allows him to search files by keywords, to change
the image privacy or to download a group of images as an archive.
This section (Processing description) highlights the main steps that should be followed by a user
in order to set up valid data that is going to be used in the Grid based execution processes. Also
some technical descriptions were detailed in order to provide a better understanding of the internal
mechanisms of the GreenLand application.
2.2.3.2 Grid Based Process Execution
After all the required workflows were properly added to the new created project, the next step consists in
specifying valid inputs for all these workflows. As mentioned in the previous sections the user has the
possibility to upload its own data. Each such data should be mapped over an input that requires a satellite
image. This is done manually, by filtering all the images own by the current logged in user and the public
images uploaded by other users. The action of specifying the workflows’ inputs should be preceded by the
workflow selection (Figure 2.9).
In some cases a workflow requires a text based input (number, string, boolean value) instead of satellite
image. In this particular case the data uploaded by the user is left aside, and it should specify a value that is
compatible with the type requested by this input (e.g. the EXT workflow needs to know the band index that
is going to be extracted from a multiband image). By using the Save button placed at the bottom of the
inputs list, the workflow will be updated with the user’s data. Renaming the workflow before the execution
is another feature provided by the GreenLand application.
The Grid execution of the selected project starts when using the Start project menu option. Before
proceeding to this step the user should double check the correctness of data. The Grid data processing
consists of the following actions:
Figure 2.9 Specify the workflow inputs
• Project validation: projects with no attached workflows could not be processed. The GreenLand
application offers the possibility to update an existing project with new workflows and to execute
- 26 -
27. enviroGRIDS – FP7 European project
Building Capacity for a Black Sea Catchment
Observation and Assessment System supporting Sustainable Development
it with this new information. In such cases the previous results will be overridden by the new ones,
generated by this second Grid execution. Before proceeding to this step a warning message will be
displayed, asking the user if it agrees with the terms of this processing;
• Verify the Grid infrastructure availability: before sending data to be processed over the Grid
infrastructure, an internal GreenLand service verifies if the Grid is accessible and if it could
perform the actions required by the user;
• Update the GreenLand database: only now the actions described by the user at the graphical
interface level are defined in the GreenLand database. The content of the project is trans-coded
into an internal ESIP format, called iPDG (instance Processing Description Graph) that stores all
the relations defined between the workflows. In this step each workflow is divided into its’ atomic
components, in order to accomplish a better execution management. An atomic component is the
smallest executable unit of a workflow. More information about this mechanism is described in the
section entitled Process description graphs;
• Set up the Grid resources: depending on the project complexity a specific number of worker nodes
are selected to process the user’s request;
• Data transfer to the Grid nodes: data required by each atomic component of the workflows will be
transferred to a specific Grid worker node;
• Grid based process execution: this step performs the data processing. It is important for the ESIP
platform to be aware of the relations established between the atomic components of the
workflows. An atomic component will not start the execution if it requires as input a result that is
generated from another job that is in the execution stage. The graph based representation of the
GreenLand project (stored in the iPDG file) allows the ESIP platform to know the status of the
execution and the atomic components that should start in the next processing phase;
• Generate the final output result: a workflow could have multiple outputs. These final outputs are
generated based on all the intermediate results of the atomic components of the workflows. When
such a final result is available it is displayed in the graphical user interface of the GreenLand
application. The project execution completes when all the inner processes are completed.
There are five statuses involved when executing data over the Grid infrastructure. Each status is suggestive
for the progress of execution:
• Submitted: displayed when allocating Grid resources and sending the project inputs and the
external dependencies (additional libraries in particular) to the Grid worker nodes;
• Running: stated throughout the entire execution of the GreenLand project;
• Completed: this means that the Grid based process execution finished and the results are available
for further analysis;
• Error: occurs when technical errors interfere with the project execution. These errors consist in:
network failure, worker nodes inaccessibility, sending wrong data to the Grid nodes, data that do
not have a physical correspondence (e.g. files that do not exist), incomplete workflows, etc. In
such cases the process should be started all over again;
• Canceled: caused by the user request in cancelling the Grid based data processing.
- 27 -