
Recomendados
Mais conteúdo relacionado
Mais de envelab
Mais de envelab (6)
Enhancing biological equivalen ts by biologically effective dose using a generic pbtk model the case of bpa and dehp
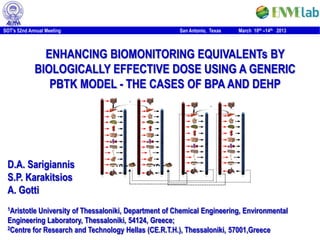
- 1. SOT’s 52nd Annual Meeting San Antonio, Texas March 10th –14th 2013 ENHANCING BIOMONITORING EQUIVALENTs BY BIOLOGICALLY EFFECTIVE DOSE USING A GENERIC PBTK MODEL - THE CASES OF BPA AND DEHP BPA - Glu & BPA – Sulf formation GI tract – portal vein GI tract – portal vein BPA - Glu & BPA – Sulf formation GI tract – portal vein GI tract – portal vein Liver Liver Liver Liver Heart Heart Heart Heart Brain Brain Brain Brain Muscles Muscles Muscles Muscles Skin Skin Skin Skin Kidneys Kidneys Kidneys Kidneys Adipose Adipose Adipose Adipose Bones Bones D.A. Sarigiannis Bones Bones Breast Breast Gonads Gonads Placenta Uterus - gonads Uterus - gonads Placenta S.P. Karakitsios Lungs Lungs Arterial blood Lungs Venous blood Arterial blood Lungs Venous blood Arterial blood Venous blood Arterial blood Venous blood A. Gotti 1AristotleUniversity of Thessaloniki, Department of Chemical Engineering, Environmental Engineering Laboratory, Thessaloniki, 54124, Greece; 2Centre for Research and Technology Hellas (CE.R.T.H.), Thessaloniki, 57001,Greece
- 2. Rationale SOT’s 52nd Annual Meeting San Antonio, Texas March 10th –14th 2013 This study attempts to refine the Risk Characterization Ratio (RCR) calculation comparing Biomonitoring Equivalents (BEs) with tissue-specific Biologically Effective Dose (BED) of the chemicals in question. This is expected to improve significantly the efficacy of risk assessment. Social Benefit Increasing benefit → Increasing cost → Social cost Optimal cost-benefit Acceptable risk Exposure reduction →
- 3. Rationale SOT’s 52nd Annual Meeting San Antonio, Texas March 10th –14th 2013 The overall methodology is demonstrated for Bisphenol-A (BPA) and di(2-ethylhexyl)phthalate (DEHP), both known to be Endocrine Disruptors (EDs).
- 4. Methodological concept – current status SOT’s 52nd Annual Meeting San Antonio, Texas March 10th –14th 2013 Estimate sum of metabolites using excretion Human dose fraction data; divide by avg. daily creatinine BE (e.g. RfC, TDI) excretion or urinary volume - UFH Simple PK considerations UFAH Animal dose UFA Animal POD UFAH Human Equiv. Estimate sum of metabolites using excretion fraction data; divide by avg. daily creatinine BEPOD POD excretion or urinary volume Simple PK considerations UFH BE
- 5. Methodological concept – current status for BPA and DEHP SOT’s 52nd Annual Meeting San Antonio, Texas March 10th –14th 2013 Threshold value systemic reference NOAEL 5 mg µg/kg_bw/day → BPA UF = 10 intra-species and 10 for inter-individual differences → EFSA, 2006 TDI 5 µg/kg bw/day NOAEL 44 mg µg/kg_bw/day → UF = 10 intra-species and 10 for inter-individual differences, 10 Health Canada, 1998 for potential teratogenicity) → TDI 5 µg/kg bw/day NOAEL 5 mg µg/kg_bw/day → UF = 10 intra-species, 10 (for adults) 20 (kids above 3 months) - DEHP ECB, 2008 25 (neonates up to 3 months) inter-individual differences) → TDI 50-20 µg/kg bw/day NOAEL 5 mg µg/kg_bw/day → UF = 10 intra-species, 10 inter-individual differences) → EFSA, 2005 TDI 50 µg/kg bw/day
- 6. Methodological concept [a] – Uncertain about MOA and PD similarities SOT’s 52nd Annual Meeting San Antonio, Texas March 10th –14th 2013 Estimate sum of metabolites using excretion Human dose fraction data; divide by avg. daily creatinine BE (e.g. RfC, TDI) excretion or urinary volume - UFH Simple PK considerations UFAH Animal dose Human PBTK UFA Human PBTK Human Human dose Animal POD UFAH Reverse dosimetry (capturing bioavailability BED differences) UFAH Human PBTK Human Equiv. Estimate sum of metabolites using excretion UFH fraction data; divide by avg. daily creatinine BEPOD POD excretion or urinary volume Simple PK considerations UFH BE BE
- 7. Methodological concept [b] – confident about MOA and PD similarities SOT’s 52nd Annual Meeting San Antonio, Texas March 10th –14th 2013 Estimate sum of metabolites using excretion Human dose fraction data; divide by avg. daily creatinine BE (e.g. RfC, TDI) excretion or urinary volume - UFH Simple PK considerations UFAH Human PBTK Animal BED to Human BED (equal (?) Human Human dose Animal dose UFA Animal BED with respect to the mode of action) Reverse dosimetry (capturing bioavailability BED differences) UFA Animal PBTK Animal POD Human PBTK UFAH UFH Human Equiv. Estimate sum of metabolites using excretion fraction data; divide by avg. daily creatinine BEPOD POD excretion or urinary volume Simple PK considerations UFH BE BE
- 8. Generic human/rodents lifelong PBTK model SOT’s 52nd Annual Meeting San Antonio, Texas March 10th –14th 2013 BPA - Glu & BPA – Sulf formation GI tract – portal vein GI tract – portal vein Breast feeding link ADME processes Liver Liver Heart Heart dC_ breast C_ breast V PS _ cell _ breast fu C_ int_ breast Lexcr dCij Brain Brain dt K _ breast Vi Qi (CAj CVij ) Metabij E limij Absorpij Pr Bindingij dt C_ breast Muscles Muscles Lexcr Q_ milk P_ milk / blood K _ breast Skin Skin Kow Fl_ tissue Fw_ tissue The blood/tissue partition coefficients are Kidneys Kidneys P_ milk / blood Kow Fl_ blood Fw_ blood contaminant specific and are estimated by the Adipose Adipose tissue lipids content and the octanol/water partition coefficient of the contaminant by the following Bones Bones formula Breast Breast Uterus - gonads Placenta Uterus - gonads Placenta Mother –Fetus interaction K ow Fltissue Fwtissue Ptissue / blood Arterial blood Lungs Arterial blood Lungs Venous blood K ow Flblood Fwblood Quterus_M Cuterus _ M Futerus _ M Cart _ M K d _ uter _ pla C placenta Cuterus _ M BPA - Glu & BPA – Sulf formation t Puterus GI tract – portal vein GI tract – portal vein Qplacenta C placenta K d _ uter _ pla C placenta Cuterus _ M Fplacenta_B Cart _ B Organ volumes (V) and blood flows (Q) were taken Liver Liver t Pplacenta from the ICRP (2002) report and the obtained data K d _ pla _ amniot C placenta Camniot Pplacenta K m _ placenta C placenta Pamniot were fitted to time (T) in order to exclude Heart Heart continuous time depended non lineal polynomial Brain Brain Qamniot K d _ pla _ amniot C placenta Camniot Pplacenta Ke _ gut _ B Cgut _ B formulas in the form of: Muscles Muscles t Pamniot V a Tb c Td e Skin Skin K e _ bile _ B Cliver _ B K a _ amniot _ B Camniot Kidneys Kidneys The permeability parameters PS were scaled Adipose Adipose according to the formula: Bones Bones 0.75 Gonads Gonads Sarigiannis DA, Karakitsios SP. A dynamic physiology based Vtissue _ child pharmacokinetic model for assessing lifelong internal dose. PStissue _ child PStissue _ adult Vtissue _ adult Arterial blood Lungs Arterial blood Lungs Venous blood AIChE 2012, Pittsburgh, PA, 2012.
- 9. BPA human/rat toxicokinetic differences SOT’s 52nd Annual Meeting San Antonio, Texas March 10th –14th 2013 3.0 Actual BED is higher in mice due Single oral dose of to enterohepatic recirculation 50μg/kg_bw ↓ 2.5 Toxicokinetic factor for animal to Human human extrapolation not quite Free plasma BPA (μg/L) necessary if PBTK model is used 2.0 Rat ↓ What about human inter-individual 1.5 variability? 1.0 0.5 0.0 1 5 9 13 17 21 25 29 33 37 41 45 49 Time (h)
- 10. BPA human inter-individual variability SOT’s 52nd Annual Meeting San Antonio, Texas March 10th –14th 2013 - Wider inter-individual variability regarding glucuronidation capacity (significantly lower clearance Adult EFSA TDI dose for neonates/infants) (50 μg/kg-bw/d) BED - Very strong plasma protein binding - First-pass metabolism decisive for clearance – wide bioavailability differences are expected from routes beyond oral (up to six times higher internal dose concentrations for inhalation compared to oral) - BPA-GLU de-conjugates to BPA in the stomach, increasing the actual dose during breast feeding, thus, the sum of BPA and BPA-GLU needs to be taken into account as BPA dose during breast feeding - BPA-GLU de-conjugates to BPA in the placenta, 0.144 0.152 0.160 0.167 0.175 0.183 increasing the actual dose during pregnancy Free plasma BPA (μg/L)
- 11. BPA daily exposure and RCR SOT’s 52nd Annual Meeting San Antonio, Texas March 10th –14th 2013 14 1.20 Fetus Premature infants 12 Bottle fed neonates 1.00 Breastfed neonates 10 Children Exposure (μg/kg_bw/d) 0.80 Adults 8 0.60 6 RCR 0.40 4 2 0.20 0 0.00 Fetus Premature Bottle fed Breastfed Children Adults infants neonates neonates EFSA BED-BE [a] BED-BE [b] Daily intake under typical RCR under different exposure scenarios methodological schemes
- 12. DEHP human/rat toxicokinetic differences SOT’s 52nd Annual Meeting San Antonio, Texas March 10th –14th 2013 0.9 Single oral dose of 250 50μg/kg_bw Human DEHP 0.8 Rat DEHP Human MEHP 200 0.7 Rat MEHP 0.6 MEHP plasma (μg/L) DEHP plasma (μg/L) Actual BED is higher in rat (especially MEHP) due 150 0.5 to enterohepatic recirculation and slower renal elimination of MEHP-Glu 0.4 ↓ Toxicokinetic factor for animal to human 100 0.3 extrapolation not quite necessary if PBTK model is used 0.2 50 0.1 0.0 0 1 5 9 13 17 21 25 29 33 37 41 45 49 Time (h)
- 13. DEHP daily exposure and RCR SOT’s 52nd Annual Meeting San Antonio, Texas March 10th –14th 2013 1.4 Adults 0.04 Adults Kids Children 1.2 0.03 Uptake (μg/kg_bw/d) 1.0 0.03 0.8 0.02 RCR 0.6 0.02 0.4 0.01 0.2 0.01 0.00 0.0 EFSA BED-BE [a] BED-BE [b] Inhalation Oral Skin Daily intake under typical RCR under different exposure scenarios methodological schemes
- 14. Conclusions SOT’s 52nd Annual Meeting San Antonio, Texas March 10th –14th 2013 • Incorporating toxicokinetic considerations in animal to human extrapolation allows multiple options for minimizing uncertainty and unnecessary conservatism, based on whether uncertainty and knowledge gaps are related mostly to MOA or toxicokinetics • Identification of inter-individual differences in bioavailability related to - inter-individual variability of enzyme related genotypes - windows of developmental susceptibility (e.g. pregnancy and infancy) due to immature detoxification processes - route of administration might be more important than inter-species differences • Refinement of RCR should rely not only on the accurate identification of toxicological thresholds, but also on the relevance of exposure scenarios in terms of age groups and administration route. • This way, unnecessary conservatism (e.g oral exposure scenarios for adults exposed to levels marginally above TDI) is avoided and exposure scenarios posing risks are identified (e.g. premature infants hosted to intensive care units exposed to BPA at levels below TDI)
- 15. SOT’s 52nd Annual Meeting San Antonio, Texas March 10th –14th 2013 Thank you for your kind attention www.enve-lab.eu A new perspective to environment-related processes
Notas do Editor
- In this figure, it is graphically illustrated the methodological concept of the INTERA approach, following the source to dose continuum.Keeping in line to the source to dose assessment, we initiate by identifying the potential indoor sources of contamination, taking into account also outdoor contributions such as traffic. From emissions, we move to environmental media concentrations, thus meaning the concentrations in the indoor air from all type of sources. After estimating the concentrations, we need to calculate human exposure from all type of possible exposure pathways and routes. Thus, besides exposure from inhaling indoor air, exposure due to non-dietary oral exposure as well as dermal exposure will be taken into account.Following, we estimate internal dose. Internal dose is the actual exposure metric, and it might be referring either to the parent compound entering human body or to the product of metabolisms. Additional advantage from the implementation of internal dose arises from the possibility of use of biomarker data. Although INTERA project is focused on exposure, exposure data or internal dose data might be further used for assessing possible health risks or the margin of safety for the indoor locations under study. All the above methodological elements described above, are currently implemented within a computational platform, which is composed by individual models. In addition, the overall modelling platform derives dynamic source to dose calculations, meaning that we can track the temporal variability of the several intermediate outcomes.At this point, we need to address that the overall assessment does not always start from emissions, but the starting point might be indoor concentration or even inhalation exposure.
- In this figure, it is graphically illustrated the methodological concept of the INTERA approach, following the source to dose continuum.Keeping in line to the source to dose assessment, we initiate by identifying the potential indoor sources of contamination, taking into account also outdoor contributions such as traffic. From emissions, we move to environmental media concentrations, thus meaning the concentrations in the indoor air from all type of sources. After estimating the concentrations, we need to calculate human exposure from all type of possible exposure pathways and routes. Thus, besides exposure from inhaling indoor air, exposure due to non-dietary oral exposure as well as dermal exposure will be taken into account.Following, we estimate internal dose. Internal dose is the actual exposure metric, and it might be referring either to the parent compound entering human body or to the product of metabolisms. Additional advantage from the implementation of internal dose arises from the possibility of use of biomarker data. Although INTERA project is focused on exposure, exposure data or internal dose data might be further used for assessing possible health risks or the margin of safety for the indoor locations under study. All the above methodological elements described above, are currently implemented within a computational platform, which is composed by individual models. In addition, the overall modelling platform derives dynamic source to dose calculations, meaning that we can track the temporal variability of the several intermediate outcomes.At this point, we need to address that the overall assessment does not always start from emissions, but the starting point might be indoor concentration or even inhalation exposure.
- In this figure, it is graphically illustrated the methodological concept of the INTERA approach, following the source to dose continuum.Keeping in line to the source to dose assessment, we initiate by identifying the potential indoor sources of contamination, taking into account also outdoor contributions such as traffic. From emissions, we move to environmental media concentrations, thus meaning the concentrations in the indoor air from all type of sources. After estimating the concentrations, we need to calculate human exposure from all type of possible exposure pathways and routes. Thus, besides exposure from inhaling indoor air, exposure due to non-dietary oral exposure as well as dermal exposure will be taken into account.Following, we estimate internal dose. Internal dose is the actual exposure metric, and it might be referring either to the parent compound entering human body or to the product of metabolisms. Additional advantage from the implementation of internal dose arises from the possibility of use of biomarker data. Although INTERA project is focused on exposure, exposure data or internal dose data might be further used for assessing possible health risks or the margin of safety for the indoor locations under study. All the above methodological elements described above, are currently implemented within a computational platform, which is composed by individual models. In addition, the overall modelling platform derives dynamic source to dose calculations, meaning that we can track the temporal variability of the several intermediate outcomes.At this point, we need to address that the overall assessment does not always start from emissions, but the starting point might be indoor concentration or even inhalation exposure.
- In this figure, it is graphically illustrated the methodological concept of the INTERA approach, following the source to dose continuum.Keeping in line to the source to dose assessment, we initiate by identifying the potential indoor sources of contamination, taking into account also outdoor contributions such as traffic. From emissions, we move to environmental media concentrations, thus meaning the concentrations in the indoor air from all type of sources. After estimating the concentrations, we need to calculate human exposure from all type of possible exposure pathways and routes. Thus, besides exposure from inhaling indoor air, exposure due to non-dietary oral exposure as well as dermal exposure will be taken into account.Following, we estimate internal dose. Internal dose is the actual exposure metric, and it might be referring either to the parent compound entering human body or to the product of metabolisms. Additional advantage from the implementation of internal dose arises from the possibility of use of biomarker data. Although INTERA project is focused on exposure, exposure data or internal dose data might be further used for assessing possible health risks or the margin of safety for the indoor locations under study. All the above methodological elements described above, are currently implemented within a computational platform, which is composed by individual models. In addition, the overall modelling platform derives dynamic source to dose calculations, meaning that we can track the temporal variability of the several intermediate outcomes.At this point, we need to address that the overall assessment does not always start from emissions, but the starting point might be indoor concentration or even inhalation exposure.
- In this figure, it is graphically illustrated the methodological concept of the INTERA approach, following the source to dose continuum.Keeping in line to the source to dose assessment, we initiate by identifying the potential indoor sources of contamination, taking into account also outdoor contributions such as traffic. From emissions, we move to environmental media concentrations, thus meaning the concentrations in the indoor air from all type of sources. After estimating the concentrations, we need to calculate human exposure from all type of possible exposure pathways and routes. Thus, besides exposure from inhaling indoor air, exposure due to non-dietary oral exposure as well as dermal exposure will be taken into account.Following, we estimate internal dose. Internal dose is the actual exposure metric, and it might be referring either to the parent compound entering human body or to the product of metabolisms. Additional advantage from the implementation of internal dose arises from the possibility of use of biomarker data. Although INTERA project is focused on exposure, exposure data or internal dose data might be further used for assessing possible health risks or the margin of safety for the indoor locations under study. All the above methodological elements described above, are currently implemented within a computational platform, which is composed by individual models. In addition, the overall modelling platform derives dynamic source to dose calculations, meaning that we can track the temporal variability of the several intermediate outcomes.At this point, we need to address that the overall assessment does not always start from emissions, but the starting point might be indoor concentration or even inhalation exposure.
- In this figure, it is graphically illustrated the methodological concept of the INTERA approach, following the source to dose continuum.Keeping in line to the source to dose assessment, we initiate by identifying the potential indoor sources of contamination, taking into account also outdoor contributions such as traffic. From emissions, we move to environmental media concentrations, thus meaning the concentrations in the indoor air from all type of sources. After estimating the concentrations, we need to calculate human exposure from all type of possible exposure pathways and routes. Thus, besides exposure from inhaling indoor air, exposure due to non-dietary oral exposure as well as dermal exposure will be taken into account.Following, we estimate internal dose. Internal dose is the actual exposure metric, and it might be referring either to the parent compound entering human body or to the product of metabolisms. Additional advantage from the implementation of internal dose arises from the possibility of use of biomarker data. Although INTERA project is focused on exposure, exposure data or internal dose data might be further used for assessing possible health risks or the margin of safety for the indoor locations under study. All the above methodological elements described above, are currently implemented within a computational platform, which is composed by individual models. In addition, the overall modelling platform derives dynamic source to dose calculations, meaning that we can track the temporal variability of the several intermediate outcomes.At this point, we need to address that the overall assessment does not always start from emissions, but the starting point might be indoor concentration or even inhalation exposure.