SlideShare uma empresa Scribd logo
1 de 24
Country Report


Vietnam


May 2011
Economist Intelligence Unit
26 Red Lion Square
London WC1R 4HQ
United Kingdom
Economist Intelligence Unit
The Economist Intelligence Unit is a specialist publisher serving companies establishing and managing
operations across national borders. For 60 years it has been a source of information on business developments,
economic and political trends, government regulations and corporate practice worldwide.
The Economist Intelligence Unit delivers its information in four ways: through its digital portfolio, where the
latest analysis is updated daily; through printed subscription products ranging from newsletters to annual
reference works; through research reports; and by organising seminars and presentations. The firm is a
member of The Economist Group.
London                                                     New York
Economist Intelligence Unit                                Economist Intelligence Unit
26 Red Lion Square                                         The Economist Group
London                                                     750 Third Avenue
WC1R 4HQ                                                   5th Floor
United Kingdom                                             New York, NY 10017, US
Tel: (44.20) 7576 8000                                     Tel: (1.212) 554 0600
Fax: (44.20) 7576 8500                                     Fax: (1.212) 586 0248
E-mail: london@eiu.com                                     E-mail: newyork@eiu.com
Hong Kong                                                  Geneva
Economist Intelligence Unit                                Economist Intelligence Unit
60/F, Central Plaza                                        Boulevard des Tranchées 16
18 Harbour Road                                            1206 Geneva
Wanchai                                                    Switzerland
Hong Kong
Tel: (852) 2585 3888                                       Tel: (41) 22 566 2470
Fax: (852) 2802 7638                                       Fax: (41) 22 346 93 47
E-mail: hongkong@eiu.com                                   E-mail: geneva@eiu.com

This report can be accessed electronically as soon as it is published by visiting store.eiu.com or by contacting a
local sales representative.

The whole report may be viewed in PDF format, or can be navigated section-by-section by using the HTML links.
In addition, the full archive of previous reports can be accessed in HTML or PDF format, and our search engine
can be used to find content of interest quickly. Our automatic alerting service will send a notification via e-
mail when new reports become available.


Copyright
© 2011 The Economist Intelligence Unit Limited. All rights reserved. Neither this publication nor
any part of it may be reproduced, stored in a retrieval system, or transmitted in any form or by any means,
electronic, mechanical, by photocopy, recording or otherwise, without the prior permission
of The Economist Intelligence Unit Limited.
All information in this report is verified to the best of the author's and the publisher's ability. However, the
Economist Intelligence Unit does not accept responsibility for any loss arising from reliance on it.
ISSN 1356-403X

Symbols for tables
“0 or 0.0” means nil or negligible; “n/a” means not available; “–” means not applicable
Printed and distributed by IntypeLibra, Units 3/4, Elm Grove Industrial Estate, Wimbledon, SW19 4HE
Vietnam                                                                                                                                      1


                                           Vietnam

                                           Executive summary
                                           3       Highlights


                                           Outlook for 2011-15
                                           4       Political outlook
                                           6       Economic policy outlook
                                           7       Economic forecast


                                           Monthly review: May 2011
                                           10      The political scene
                                           11      Economic policy
                                           13      Economic performance


                                           Data and charts
                                           15      Annual data and forecast
                                           16      Quarterly data
                                           17      Monthly data
                                           18      Annual trends charts
                                           19      Monthly trends charts
                                           20      Comparative economic indicators


                                           Country snapshot
                                           21      Basic data
                                           22      Political structure


                                Editors:       Danny Richards (editor); Kilbinder Dosanjh (consulting editor)
                 Editorial closing date:       May 6th 2011
                            All queries:       Tel: (44.20) 7576 8000 E-mail: london@eiu.com
                           Next report:        To request the latest schedule, e-mail schedule@eiu.com


Country Report May 2011                                          www.eiu.com                     © The Economist Intelligence Unit Limited 2011
2                                                                                                                                                                                             Vietnam


                                                                                                                                 CHINA
                                                                Ha Giang
                                                                                    Cao Bang
                                                   Lao Cai
                                    Bl a
                                      ck
                                           R.


                                                               Re
                                                Lai Chau        d


                                                                 R.
                                                                                  Tuyen Quang         Lang Son
                                                                                                      Lang
                                                                Yen Bai
                                                                                          Thai Nguyen
                                                Dien Bien Phu         Phu Tho
                                                                                                 Bac Giang
                                                                          Song Tay           HANOI               Cam Pha
                                                                             Ha Dong                           Hong Gai
                                                                                         Hai Duong         Haiphong

                                                                                    Nan Dinh
                                                                                 Ninh Binh

                                                                            Thanh Hoa                               Gulf of
                                                                                                                    Tonkin
                                LAOS
                                                                                         Quynh Luu


                                                                                         Vinh
                                                                                               Ha Tinh


                                                                                                          Dong Hoi


                                                                                                                     Dong Ha                                                    Paracel Is.
                                                                                                                                                                                (disputed)
                                                                                                                    Hue

                                                                                                                                  Da Nang
                         THAILAND                                                                                                  Hoi An
                                                                                                                                          Tam Ky

                                                                                                                                             Quang Ngai
                                                                                                                                                                 SOUTH CHINA
                                                                                                                          VIETNAM                                    SEA
                                                                                                                                Kon Tum

                                                                                                                                 Pleiku
                                                                                                                                                   Qui Nhon


                                                                                                                                                    Tuy Hoa

                                                                    CAMBODIA                                                     Ban Me Thuot
                                                                                                                                   Ninh Hoa
                                                                                                                                                   Nha Trang
                                                                                                                               Da Lat               Cam Ranh
                                                                                                           Loc Ninh
                                                                                                                 Bao Loc                       Phan Rang
         Gulf of
        Thailand                                                                                  Tay Ninh

                                                                                         Thu Dau
                                                                                         Thu Dau Mot          Bien Hoa           Phan Thiet
                                                                                                             Ho Chi Minh City                                   Main railway
                                                                                    Me


                                                                      Chau Doc        ko
                                                                                        ng      My Tho
                                                                                       R
                                                                      Long Xuyen                                    Vung Tau                                    Main road
                                                Dao Phu Quoc                   Vinh Long                  Ben Tre
                                                                      Rach Gia                                                                                  International boundary
                                                                                    Can Tho          Phu Vinh
                                                                                   Soc Trang                                                                    Main airport
                                                                                                                                                                Capital
 0 km         100             200                 300                  Ca Mau                Bac Lieu
                                                                                                                                                                Major town
 0 miles                100                          200                                        Con Dao                                                         Other town
 © The Economist Intelligence Unit Limited 2011


Country Report May 2011                                                                              www.eiu.com                                       © The Economist Intelligence Unit Limited 2011
Vietnam                                                                                                                            3


                                      Executive summary
                                      Highlights
                                                                                                                       May 2011

                Outlook for 2011-15   • The Communist Party of Vietnam will keep a firm grip on power in the
                                        forecast period, and, despite signs of factional splits between conservative
                                        hardliners and reformers, there is no prospect of any major internal instability.
                                      • Given the generally high level of political apathy, together with the regime’s
                                        determination to crack down hard on pro-democracy activists, the likelihood
                                        that Vietnam will suffer an upheaval similar to that in the Arab world is low.
                                      • Policymakers have embarked on a process of tightening economic policy, but
                                        concerns persist over whether there is sufficient political will to implement
                                        tougher measures that may be needed to stabilise the economy.
                                      • Real GDP growth will slow this year, to 6.4%, but it will return to an average
                                        rate of 7-7.5% a year in the remainder of the forecast period, underpinned by
                                        strong growth in consumption, investment and exports.
                                      • Inflation will accelerate to an average rate of 16.9% in 2011, before slowing to
                                        an average of 8% a year in 2012-15. Policymakers are likely to face an ongoing
                                        battle to keep the dong stable against the US dollar.
                                      • The current account will remain in deficit over the next five years, but capital
                                        and financial inflows (including official foreign borrowing) will increase from
                                        the low levels that they reached in 2009.

                   Monthly review     • The authorities have adopted something of an "arrest first, ask questions later"
                                        policy to stamp out the threat of political dissent. There have also been some
                                        high-profile legal cases against dissidents in recent months.
                                      • Vietnam appears to be fighting a losing battle to prevent the construction of a
                                        hydropower dam project in Laos, which could further disrupt the flow of
                                        water into the fertile flood plains of the Mekong delta in southern Vietnam.
                                      • The State Bank of Vietnam (the central bank) has continued to push up policy
                                        interest rates. It increased the refinance rate by 100 basis points twice in April,
                                        raising it to 14%.
                                      • Although the pace of year-on-year economic growth slowed to 5.4% in the
                                        first quarter, industrial output growth remains strong—in January-April it grew
                                        by 14% year on year, the same pace of growth recorded in 2010 as a whole.
                                      • The pace of growth in merchandise export revenue has been impressive, but
                                        the import bill continues to increase at a fast pace, rising by 29% year on year
                                        in January-April, to US$31.8bn.
                                      • Concerns over the state of the economy continue to be driven by the accele-
                                        ration in inflation, which reached 17.5% year on year in April.


Country Report May 2011                                 www.eiu.com                    © The Economist Intelligence Unit Limited 2011
4                                                                                                                            Vietnam


                                         Outlook for 2011-15
                                         Political outlook
                   Political stability   The ruling Communist Party of Vietnam (CPV) will maintain a firm grip on
                                         power in the next five years, and, despite signs of factional splits between
                                         conservative hardliners and relative reformers, there is no prospect of any
                                         major internal instability. Indeed, at the party's 11th national congress, in
                                         January, there were displays of unity as the party continued to espouse one-
                                         party rule. The congress did provide a chance for different factions to stake a
                                         claim to greater influence, but the spoils have been shared. The beleaguered
                                         prime minister, Nguyen Tan Dung, appears to have kept his post—his
                                         re-appointment will only be formally made following the formation of the
                                         13th National Assembly (NA, the legislature) after national elections, which will
                                         be held on May 22nd. Although Mr Dung's continuation in office appears to
                                         have been endorsed by the CPV, his reputation has been damaged by the near-
                                         collapse of one of the largest state-owned enterprises, the Vietnam Shipbuilding
                                         Industry Group (Vinashin), and his political opponents have appeared bent on
                                         using the debacle as a way to reduce his political power. Truong Tan Sang, the
                                         head of the CPV secretariat, is in line to become president. Although the
                                         presidency is largely a ceremonial post, Mr Sang is one of Mr Dung's most
                                         formidable rivals within the party and is regarded as being a highly influential
                                         member of the party’s conservative bloc. The post of party general secretary
                                         has gone to a Marxist theorist, Nguyen Phu Trong, who will stand down as
                                         chairman of the NA. The choice of Mr Trong, who is widely regarded as being
                                         a moderate, was possibly a compromise, providing some balance to the rivalry
                                         between Mr Dung and Mr Sang. However, given that Mr Trong is already 66,
                                         unlike his predecessor, Nong Duc Manh, he is not expected to serve two five-
                                         year terms. This suggests that internal power struggles could be reignited
                                         towards the end of the forecast period, ahead of the next congress.
                                         The CPV will continue to face objections from some quarters to its long-
                                         standing claim that it has the right to govern unchallenged. However, given
                                         the generally high level of political apathy, together with the regime’s deter-
                                         mination to crack down on activists who advocate genuine democratic reform,
                                         there is little likelihood that any opposition movement will gain traction. The
                                         likelihood that Vietnam will suffer an upheaval similar to that taking place in a
                                         number of countries in the Middle East and North Africa is therefore low.
                                         However, concerns over soaring prices could create the conditions for social
                                         unrest in the short term, while protests over land seizures could become more
                                         common during the forecast period. The fast pace of industrial development in
                                         Vietnam has entailed the increasingly rapid construction of factories, plants and
                                         large infrastructure projects, such as roads and dams, throughout the country.
                                         As a result, the number of displaced residents has risen, and some have
                                         been vocal about what they perceive as inadequate government compensation
                                         for the loss of their land. Meanwhile, corruption in local bureaucracies occa-
                                         sionally results in the embezzlement of funds earmarked to compensate people
                                         who have been evicted from their land, leaving them dispossessed and with


Country Report May 2011                                   www.eiu.com                   © The Economist Intelligence Unit Limited 2011
Vietnam                                                                                                                            5


                                      inadequate resources to rebuild their livelihoods. Public anger over such issues
                                      will intensify unless the authorities take action to punish corrupt local officials.
                                      Tensions between the government and religious and ethnic-minority groups
                                      could come to the fore again in the next five years, with the state taking a
                                      harder line against minorities. The CPV tolerates religious activity as long as
                                      it does not pose a threat to the regime, although there have been flashpoints
                                      recently in the party's dealings with the Roman Catholic church. The party
                                      has warned that "social disorder" arising from land disputes over religious
                                      property will be strictly punished. The confiscation of property belonging
                                      to the Catholic church between the 1950s and 1970s remains a sore point
                                      in relations between the Vietnamese government, the local church and the
                                      Vatican. There are 6m Catholics in Vietnam, making the Catholic church the
                                      largest organisation in the country outside the orbit of the CPV. The party
                                      leadership will also remain concerned about the potential for social unrest in
                                      the Central Highlands. The area is largely populated by ethnic-minority groups,
                                      and, owing to the fact that party membership is not common, official control in
                                      that region is relatively weak.

                     Election watch   Vietnam is a one-party communist state, and elections do not play a major role
                                      in its political life. Appointments to CPV posts take place behind closed doors,
                                      with votes conducted merely to confirm decisions that have already been
                                      made. NA delegates are chosen by popular vote, and the next such election is
                                      scheduled for May 22nd 2011. However, candidates are closely vetted by the
                                      Vietnam Fatherland Front (VFF), a CPV-controlled umbrella body that includes
                                      all of the country's "mass organisations", and only those deemed suitable are
                                      allowed to stand. According to the vice-chair of the VFF Central Committee,
                                      Nguyen Van Pha, 832 out of 1,086 candidates were recently shortlisted for the
                                      NA election, of whom 83 were self-nominated (including both members and
                                      non-members of the CPV). At the 2007 election only 43 of the 493 people
                                      elected to the NA were non-CPV members.

           International relations    Vietnam will continue to make strides in strengthening its ties with the West,
                                      particularly with the US. Vietnamese-US diplomatic ties have been bolstered by
                                      high-level exchanges in recent years, and the economic relationship between
                                      the two countries has developed rapidly. Military links have also become
                                      dramatically closer, as highlighted by joint military exercises in the South China
                                      Sea in August 2010. Despite these positive trends, US concerns over human
                                      rights and religious freedom in Vietnam will remain a source of bilateral
                                      tensions. However, such stress will not cause anything more serious than the
                                      occasional diplomatic spat. The US views Vietnam as an important ally in Asia,
                                      while Vietnam has both an economic and a security interest in maintaining
                                      close ties with the US. Although keen to become closer to the US, the current
                                      leadership in Vietnam will also seek to maintain strong relations with China.
                                      However, the two foreign policy objectives could prove difficult to balance.
                                      The most significant unresolved issue between Vietnam and China concerns
                                      competing claims to the Spratly and Paracel islands in the South China Sea,
                                      particularly in view of China’s increasingly assertive approach to matters of
                                      sovereignty. In addition to claims by Vietnam and China of full sovereignty


Country Report May 2011                                 www.eiu.com                    © The Economist Intelligence Unit Limited 2011
6                                                                                                                              Vietnam


                                          over the islands, the Philippines, Brunei, Malaysia and Taiwan have also made
                                          full or partial claims. The dispute is unlikely to be resolved in 2011-15, but all
                                          the claimants have signed the Declaration on the Code of Conduct in the East
                                          (South China) Sea, which was initiated by the Association of South-East Asian
                                          Nations (ASEAN) and commits signatories to "resolving all disputes through
                                          peaceful negotiations in accordance with international laws and practices". The
                                          disputed area is becoming increasingly important strategically, however, as it is
                                          believed to contain oil and gas deposits and is also an important shipping route.


                                          Economic policy outlook
                          Policy trends   Policymakers have embarked on a process of tightening economic policy, but
                                          concerns persist over whether there is sufficient political will to implement
                                          tougher measures that may be needed to stabilise the economy. The State Bank
                                          of Vietnam (SBV, the central bank) has tightened its monetary policy stance by
                                          pushing up its policy interest rates in recent months, but inflation is likely to
                                          remain in double digits in the short term—the sharp devaluation of the dong
                                          over the past year or so will create greater imported inflationary pressures,
                                          while the government has had to increase subsidised retail prices for fuel and
                                          electricity, owing to sharp rises in global crude oil prices recently. The govern-
                                          ment has also signalled its intention to tighten its fiscal policy stance, and
                                          further administrative measures may be introduced to slow the pace of growth
                                          in domestic credit. However, in the light of the government's general policy bias
                                          in favour of rapid economic growth rather than price stability, there is a risk that
                                          if the pace of growth does not pick up in the coming quarters (growth fell to
                                          5.4% in the first quarter of 2011) that the authorities will again loosen policy.

                          Fiscal policy   Although there is a need for the government to rein in the fiscal deficit—to cool
                                          the economy and to avoid financing problems (outstanding public debt is esti-
                                          mated to have reached nearly 57% of annual GDP at end-2010)—it will struggle
                                          to narrow the deficit during the forecast period. The government recently
                                          revealed that it would cut planned investment spending this year by D50trn
                                          (US$2.4bn), or around 7.4% of the original total budget for the year. If it is
                                          implemented, the measure would help to lower the deficit, but it could yet
                                          prove difficult to administer such cuts in expenditure. Nevertheless, the govern-
                                          ment is still expected to record a lower deficit this year than in 2010, as high
                                          crude oil prices will boost official revenue (the authorities derive substantial tax
                                          revenue and royalties from the oil and gas sector). The Economist Intelligence
                                          Unit therefore expects the budget deficit to narrow to 4.8% of GDP this year,
                                          from an estimated 5.5% in 2010 and 7% in 2009. Government revenue will
                                          continue to be supported to some extent by strong economic growth in the
                                          remainder of the forecast period, and global prices for crude oil will remain
                                          relatively high. However, heavy spending on infrastructure and social welfare
                                          programmes will keep the budget deficit at above 5% of GDP in 2012-15.

                   Monetary policy        The SBV has taken aggressive steps to tighten monetary policy in recent months,
                                          pushing up its policy rates by up to 6 percentage points since November 2010.
                                          However, the SBV is not operationally independent, and it will be under pres-


Country Report May 2011                                     www.eiu.com                   © The Economist Intelligence Unit Limited 2011
Vietnam                                                                                                                               7


                                   sure to ensure that the rising cost of financing does not undermine economic
                                   growth. The policy tools available to the central bank include a mix of both
                                   direct and indirect instruments. In the past few months the SBV has increased
                                   its refinance and discount rates in an attempt to slow the expansion of credit.
                                   However, the official target for domestic credit growth this year has only been
                                   revised down slightly from a limit of 23% to 20%. Although in March 2011 the
                                   central bank warned that it would double reserve requirements for banks that
                                   fail to reduce the ratio of lending to non-productive activities (as a percentage of
                                   total lending), to below 16% by the end of the year, the measures that have been
                                   taken so far are unlikely to be sufficient to cool an overheated economy. We
                                   therefore expect the authorities to have to tighten policy further this year.


                                   Economic forecast
      International assumptions                                        2010      2011     2012        2013        2014       2015
                                   Economic growth (%)
                                   US GDP                                2.9       2.9      2.5         2.6         2.6         2.7
                                   OECD GDP                              2.9       2.5      2.3         2.4         2.4         2.2
                                   World GDP                             3.8       3.2      3.2         3.2         3.2         3.2
                                   World trade                          12.5       7.0      6.0         6.1         6.1         5.7
                                   Inflation indicators (% unless otherwise indicated)
                                   US CPI                                1.6       2.3      2.1         2.5         2.8        2.8
                                   OECD CPI                              1.4       2.0      1.8         2.0         2.1        2.3
                                   Manufactures (measured in US$)        3.4       5.1     -0.1        -0.1         1.2        2.3
                                   Oil (Brent; US$/b)                   79.6     101.0     85.0        78.3        75.5       76.0
                                   Non-oil commodities (measured
                                    in US$)                             24.3      29.2    -11.5        -5.9        -3.0        -0.3
                                   Financial variables
                                   US$ 3-month commercial paper
                                    rate (av; %)                         0.3       0.3      0.7         1.5         2.7         2.8
                                   ¥ 3-month money market rate
                                    (av; %)                              0.4       0.2      0.4        0.6         1.4         2.0
                                   ¥:US$ (av)                          87.88     81.75    81.00      81.00       82.13       83.50

                 Economic growth   The recent sharp increases in interest rates and the acceleration in inflation will
                                   weaken private consumption and investment growth, and we have therefore
                                   revised down slightly our forecast for real GDP growth this year, to 6.4%, from
                                   6.8% previously. However, assuming that officials manage to tighten policy
                                   further and have some success in cooling the economy without severely under-
                                   mining growth momentum, we expect economic expansion to return to an
                                   average annual rate of 7-7.5% in 2012-15. Although global economic growth will
                                   slow in 2011, demand for Vietnamese goods is likely to hold up, and the manu-
                                   facturing sector is expected to ramp up production. This will require more
                                   workers, and thus keep unemployment fairly low. In addition, remittances from
                                   overseas Vietnamese will remain high, providing an important boost to private
                                   consumption. As demand for exports remains strong, investment in the form of
                                   purchases of capital goods for the manufacturing sector will pick up. Despite
                                   concerns about the quality of Vietnam's business environment and a recent
                                   downturn in planned foreign-invested projects, foreign investor interest remains
                                   strong. Demand for Vietnamese goods—particularly in the US, China and
                                   Europe—will remain strong, but import expansion will also be significant, and
                                   net exports will consequently act as a drag on real GDP growth from 2013.


Country Report May 2011                                www.eiu.com                       © The Economist Intelligence Unit Limited 2011
8                                                                                                                                    Vietnam


                                      There are still some major downside risks to this growth outlook. On the
                                      domestic front, the government still has much to do in terms of stabilising the
                                      economy and rebuilding consumer and investor confidence. In part owing to a
                                      surge in inflation and a wide current-account deficit, confidence in the dong
                                      has diminished, and there is increased demand for safe havens in the form of
                                      US dollars and gold. On the international front, there is a risk that the global
                                      economic recovery will be weaker than we currently expect. Not only would
                                      this damage exports, but it would also have a knock-on effect on consumer and
                                      business spending in Vietnam, thereby inhibiting economic growth. Given the
                                      precarious nature of the country's foreign exchange reserves—as indicated by
                                      the difficulty that the SBV has had in managing the level of the dong:US dollar
                                      exchange rate—there is cause for concern over the country's ability to finance a
                                      widening trade deficit. Citing concerns over an external payments crisis, partly
                                      owing to the sharp fall in Vietnam's reserves in the past year or so, international
                                      credit-ratings agencies have downgraded Vietnam’s sovereign debt rating, citing
                                      concerns over contradictory economic policymaking. Such downgrades and
                                      growing concerns over economic stability and the country's diminished inter-
                                      national reserves has raised speculation that a support package from the IMF
                                      may be needed.

                                      Economic growth
                                      %                                         2010 a    2011 b     2012 b    2013 b     2014 b     2015 b
                                      GDP                                         6.8 c     6.4        7.0       7.1        7.3        7.2
                                      Private consumption                         7.0       2.9        5.8       7.1        7.5        7.5
                                      Government consumption                      8.0       7.8        7.8       7.7        7.0        7.0
                                      Gross fixed investment                      8.5       5.1        7.2       8.2        9.1        9.0
                                      Exports of goods & services                15.2      13.4       13.6      12.4       12.2       12.5
                                      Imports of goods & services                17.2       9.7       10.2      11.4       11.8       12.6
                                      Domestic demand                             9.0       3.7        4.8       7.3        7.8        7.8
                                      Agriculture                                 2.8 c     3.5        3.4       3.2        3.1        3.3
                                      Industry                                    7.7 c     7.0        8.0       9.0        9.0        9.0
                                      Services                                    7.5 c     7.0        7.3       6.7        7.0        6.7
                                      a Economist Intelligence Unit estimates. b Economist Intelligence Unit forecasts. c Actual.

                          Inflation   Consumer price inflation is forecast to accelerate to 16.9% in 2011, from 9%
                                      in 2010, before slowing to an average rate of 8% a year in 2012-15. The acce-
                                      leration this year partly reflects supply-side pressures stemming from rising
                                      international commodity prices. We expect crude oil prices (dated Brent Blend)
                                      to rise by nearly 27% this year and global food prices to rise by 29%. However,
                                      global commodity prices will fall in 2012, and are expected to remain relatively
                                      stable in 2013-15, and this will help to calm supply-side price pressures. But with
                                      the authorities yet to succeed in anchoring inflation expectations, annual price
                                      increases will remain high. The continued depreciation of the dong against the
                                      US dollar in 2011-15 will also serve to make imports more expensive.

                     Exchange rates   Maintaining stability in the exchange rate between the dong and the US dollar
                                      will remain a challenge for policymakers in the next two years, and we forecast
                                      that the dong will depreciate by an annual average of 8% a year in 2011-12,
                                      before depreciating by around 2% a year in 2013-15. In the face of strong
                                      downward pressure on the dong, the SBV has devalued the currency on four


Country Report May 2011                                     www.eiu.com                         © The Economist Intelligence Unit Limited 2011
Vietnam                                                                                                                                        9


                                       occasions since November 2009, most recently in February 2011. The devalua-
                                       tions have resulted in a cumulative drop of almost 14% in the currency's value
                                       against the US dollar. Further such measures are likely to be necessary in the
                                       coming years as the dong will remain under pressure until there are clear signs
                                       that the trade deficit is narrowing and inflationary pressures are receding.
                                       Moreover, Vietnam's meagre foreign-exchange reserves mean that the SBV will
                                       not be able to stem any downward pressure by intervening in the currency
                                       markets. According to the latest available figures from the IMF, foreign-exchange
                                       reserves stood at US$14.1bn (equivalent to around eight weeks of imports) in
                                       October 2010, down from a high of US$26.4bn in March 2008. Recent media
                                       reports have quoted a government minister as saying that reserves stood at
                                       over US$10bn in December 2010, although the exact level was not specified.

                     External sector   The current account will stay in deficit during the next five years, averaging the
                                       equivalent of 5.3% of GDP a year. Despite a recovery in exports, imports will
                                       rise in line with strong growth in consumption and investment, and this means
                                       that the merchandise trade deficit will remain wide. In addition to the deficit
                                       on the merchandise trade account, the services and income accounts will also
                                       stay in the red throughout 2011-15. Tourism receipts are expected to rise steadily
                                       in the forecast period, boosting services exports. However, Vietnam will remain
                                       reliant on a host of imported services, and there will be particularly strong
                                       growth in payments for trade-related services. Outflows on the income account
                                       will rise in line with the repatriation of profits by the growing number of
                                       foreign-invested enterprises in the country. But the combined deficit on the
                                       services and income accounts will continue to be offset by a large surplus on
                                       the current transfers account. Capital and financial inflows (including official
                                       foreign borrowing) will increase from the low levels that they reached in 2009.
                                       The country's international reserves position will therefore improve over the
                                       forecast period, having deteriorated in 2009 and early 2010.

                                       Forecast summary
                                       (% unless otherwise indicated)
                                                                                 2010 a      2011 b    2012 b    2013 b    2014 b     2015 b
                                       Real GDP growth                              6.8         6.4       7.0       7.1       7.3        7.2
                                       Industrial production growth               14.0        14.0      15.5      15.5      15.0       15.0
                                       Gross agricultural production growth         2.8         3.5       3.4       3.2       3.1        3.3
                                       Consumer price inflation (av)                9.0       16.9      10.4        7.9       7.5        6.1
                                       Consumer price inflation (end-period)      11.8        15.9        8.2       7.8       7.5        6.2
                                       Lending rate                               13.1 c      19.0      18.0      12.0      11.5       11.5
                                       Government balance (% of GDP)               -5.5        -4.8      -5.3      -5.1      -5.0       -5.4
                                       Exports of goods fob (US$ bn)              71.9 c      90.3      96.3     108.2     123.2      142.6
                                       Imports of goods fob (US$ bn)              79.5 c      98.5     105.9     119.9     136.5      156.1
                                       Current-account balance (US$ bn)            -5.6 c      -6.1      -6.2      -7.3      -7.6       -7.3
                                       Current-account balance (% of GDP)          -5.4 c      -5.6      -5.3      -5.7      -5.3       -4.5
                                       External debt (end-period; US$ bn)         31.1 c      34.6      37.2      40.6      44.9       50.1
                                       Exchange rate D:US$ (av)                 19,127      21,108    22,620    23,121    23,581     24,082
                                       Exchange rate D:US$ (end-period)         19,498      21,864    22,867    23,351    23,832     24,333
                                       Exchange rate D:¥100 (av)                21,677      24,055    26,075    26,885    27,420     28,215
                                       Exchange rate D:€ (end-period)           23,982      25,253    26,182    26,620    27,256     27,997
                                       a Actual. b Economist Intelligence Unit forecasts. c Economist Intelligence Unit estimates.


Country Report May 2011                                      www.eiu.com                          © The Economist Intelligence Unit Limited 2011
10                                                                                                                     Vietnam


                                   Monthly review: May 2011
                                   The political scene
        The CPV is growing ever    The recent surge in inflation remains a political and an economic problem for
      fearful of vocal opponents   Vietnam’s leadership. Given that the rate of inflation accelerated to 17.5% year
                                   on year in April, the ruling Communist Party of Vietnam (CPV) is growing
                                   concerned about the possibility that rapidly rising prices and a weak currency
                                   will trigger social unrest. These fears appear to have been further exacerbated
                                   by the continuing wave of social unrest in some countries with authoritarian
                                   regimes in the Middle East and North Africa. The authorities have therefore
                                   adopted something of an "arrest first, ask questions later" policy to stamp out
                                   the threat of political dissent. There have also been some high-profile legal
                                   cases against dissidents in recent months, with the most recent prominent legal
                                   action being the trial of Cu Huy Ha Vu, the son of one of Vietnam’s best-
                                   known revolutionaries, Cu Huy Can, a close associate of the country's founding
                                   president, Ho Chi Minh, and who served in the first government after
                                   Vietnam’s revolutionaries declared independence from France in 1945. In early
                                   April Mr Vu was sentenced to seven years in prison having been found guilty
                                   of demanding an end to one-party Communist rule, a charge he denied. The
                                   presiding judge in the case, Nguyen Huu Chinh, ruled that the defendant's
                                   behaviour had been harmful to society. Mr Vu initially rose to prominence after
                                   filing a lawsuit against the prime minister, Nguyen Tan Dung, for encouraging
                                   Chinese firms to mine for bauxite in Vietnam’s pristine Central Highlands
                                   region. Environmental activists and Vietnamese nationalists took exception to
                                   the mining deal because of the potential ecological damage inflicted by mining
                                   for the ore and also because the deal involves Chinese companies. Legal
                                   officials dropped Mr Vu’s complaint and then blocked a subsequent lawsuit
                                   against Mr Dung for allegedly preventing the filing of class action lawsuits.
                                   Officials also appear to be growing more aware of Western criticism of their
                                   heavy-handed approach to dealing with dissidents. Mr Vu is just one of several
                                   dissidents to have been both arrested and convicted in the past few months,
                                   worsening Vietnam’s reputation among international human-rights advocates
                                   and potentially complicating the pursuit of regional free-trade discussions that
                                   include the US. However, a small number of convicted dissidents have seen
                                   their sentences reduced recently. The sentence given to a former member of the
                                   CPV, Vi Duc Hoi, for allegedly calling for multiparty democracy was cut from
                                   eight years to five years after an appeal hearing in Lang Son province, north of
                                   the capital, Hanoi. Mr Hoi helped to school top leaders during his time with the
                                   CPV but was later expelled from the party for advocating democratic reforms.
                                   Meanwhile, two prominent government critics, Le Quoc Quan and Pham Hong
                                   Son, were recently released after being arrested outside the court building
                                   where the trial of Mr Vu was under way in Hanoi. Initially picked up by police
                                   for public-order offences, the critics were released without charge. They could
                                   soon find themselves in trouble again, however, as they have said that they are
                                   considering taking legal action against police authorities for wrongful detention.


Country Report May 2011                             www.eiu.com                   © The Economist Intelligence Unit Limited 2011
Vietnam                                                                                                                        11


  Laos's plans for a dam on the      Vietnam appears to be fighting a losing battle to prevent the construction of
        Mekong raises tensions       the US$3.5bn Xayaburi hydropower dam project in Laos, which could further
                                     disrupt the flow of water into the fertile flood plains of the Mekong delta in
                                     southern Vietnam. Salinisation is already affecting the densely populated area,
                                     reducing the stock of freshwater fish and inflicting damage on rice-growing
                                     land. Environmentalists warn of a major shock to the food security of the entire
                                     region if the project goes ahead, affecting not just the millions of people who
                                     live in the Mekong delta, but potentially reducing the supply of rice to the
                                     global market, too. Some enterprising farmers have switched to farming shrimp
                                     instead, but Vietnamese officials have been pressing hard to limit the number
                                     of dams on the Mekong, which flows through China, Myanmar, Thailand, Laos
                                     and Cambodia before exiting the South China Sea through Vietnam. The
                                     government fears that if the project goes ahead, it will set a dangerous prece-
                                     dent for more hydropower projects along the river, especially in Laos, which
                                     aspires to use hydropower generation to become "the battery of South-east
                                     Asia" and kick-start its poverty-stricken economy. Vietnam’s stated goal is a
                                     ten-year moratorium on the construction of new dams along the Mekong.
                                     The Vietnamese authorities have tried to exert considerable pressure on the
                                     Communist-run government in Laos, which is normally fairly pliant when it
                                     comes to matters affecting the national interest of Vietnam. But the valuable
                                     export market in power-hungry Thailand appears too much for the Lao govern-
                                     ment to resist.
                                     Laos, Thailand, Cambodia and Vietnam held a meeting on the matter in Laos
                                     on April 19th at which Vietnam hoped to negotiate some way to stop the
                                     Xayaburi dam from going ahead. The government has won some support
                                     in the US Congress (that country's legislature), with a US senator, Jim Webb,
                                     recently arguing that the project be suspended until the full environmental
                                     impact of building dams on the Mekong is better understood. The four
                                     countries in the lower Mekong region failed to agree a common stand on the
                                     controversy, saying that the discussions would continue at a ministerial level.
                                     None of the four countries are able to veto any proposed projects. In the
                                     meantime, construction of the 1,285-mw dam continues, with a Thai contractor,
                                     Ch Karnchang, stating that it expects to sign a contract to complete construction
                                     of the dam, which is expected to begin generating electricity in 2019. There are
                                     also plans to build another ten dams along the Mekong, mostly in Laos and
                                     Cambodia, in addition to the existing four in the upper reaches of the river in
                                     China. Environmental activists say that the Chinese dams have already dis-
                                     rupted water flows downstream, contributing to a significant drought in 2010,
                                     which saw water levels in the Mekong dwindle to levels not seen in 50 years.


                                     Economic policy
         The SBV tightens policy     Vietnam's policymakers are now engaged in a scramble to contain domestic
      further, raising rates again   inflation without choking off credit to small- and medium-sized businesses
                                     (SMEs) that form the backbone of the local economy. It is a difficult balancing
                                     act. The rate of inflation hit 17.5% year on year in April—the highest rate since
                                     December 2008. Inflationary expectations remain a significant obstacle to the


Country Report May 2011                               www.eiu.com                   © The Economist Intelligence Unit Limited 2011
12                                                                                                                   Vietnam


                          government's efforts to control the situation, with signs that inflation will sur-
                          pass 20% in the coming months. The authorities have been using a variety of
                          measures to slow credit growth and increase lending rates in order to help ease
                          inflation. The State Bank of Vietnam (SBV, the central bank) raised the refinance
                          rate by 100 basis points at the beginning of April and also in early May, to reach
                          14%, and there were further increases of 100 basis points in both the reverse
                          repurchase (repo) rate (to 14%) and the discount rate (to 13%), taking effect in
                          early May. Lending rates, meanwhile, are standing at around the 19-20% level for
                          small businesses—high enough to make many of them scale back expansion
                          plans and deter others from setting up new ventures. To help them, the govern-
                          ment has announced that it will defer this year’s corporate tax payments for
                          SMEs until 2012. The corporate tax rate is 25%, and the measure applies to firms
                          with fewer than 300 employees or with capital of less than D100bn (US$4.8m).
                          However, the catch is that companies engaged in real estate, banking, stock
                          trading and providing financial services such as insurance will not be included.

                                   Policy interest rates
                                   (%, end-period)
                                        Discount rate          Refinance rate
                            16.0

                            14.0

                            12.0

                            10.0

                             8.0

                             6.0

                             4.0
                                Jan Mar May Jul Sep Nov Jan Mar May Jul Sep Nov Jan Mar May Jul Sep Nov Jan Mar May
                               2008                     09                       10                      11
                                   Source: State Bank of Vietnam.


                          Taken as a whole, the latest series of interest rate rises provide further evidence
                          that Vietnam’s leaders are taking the country’s inflationary problems seriously.
                          Increasing prices were a major topic of discussion during the CPV's national
                          congress in January, which is held every five years and sets economic policy
                          for the next five years. Although the party's leaders maintained their view
                          that Vietnam needs to maximise its economic growth potential by encouraging
                          private and state-run businesses to expand, they also placed an increasing em-
                          phasis on doing so without jeopardising the country’s fragile economic balance
                          by triggering an upsurge in inflation. In particular, they fear that quickly rising
                          prices could trigger unpredictable social consequences that could undermine
                          the authority of the CPV; Vietnam already has some experience of this. In 2008,
                          as monthly inflation rates rose, to peak at 28%, a series of strikes rippled around
                          the major industrial zones in Ho Chi Minh City in the south and Hanoi. In
                          some cases, workers who returned to their home provinces to celebrate the
                          Lunar New Year holiday did not return to work because their wages (in real
                          terms) had been so badly eroded.
                          Vietnam’s leaders struggled to get a firm grip on the problem of accelerating
                          inflation in 2007-08 and arguably only managed to avoid a worse situation at
                          the time owing to the onset of the 2008-09 global financial crisis, which tem-


Country Report May 2011                                 www.eiu.com             © The Economist Intelligence Unit Limited 2011
Vietnam                                                                                                                     13


                                  pered the cost of imported products, especially refined oil. A subsequent burst
                                  of inflation in 2010 was only partially contained; the government eased off on
                                  its monetary tightening when the threat appeared to have subsided in the
                                  middle of that year, only to see prices track upwards again. By the time the CPV
                                  met in January, inflation had already returned to double-digit growth and the
                                  government was also preparing to let fuel and electricity prices rise sharply, as
                                  the cost of subsidising them was becoming too onerous.


                                  Economic performance
    Growth in industrial output   Although the pace of year-on-year economic growth slowed to 5.4% in the first
         and exports is strong    quarter, industrial output growth remains strong. In January-April industrial
                                  output grew by 14.2% year on year—the same pace of growth recorded in 2010
                                  as a whole. Output by private firms and foreign-invested enterprises rose by
                                  nearly 17%, offsetting sluggish growth of 5% by the state-owned sector. Output
                                  of garments rose by 17.6% year on year, while footwear output grew by 17%. The
                                  electrical appliances and white-goods sectors recorded a mixed performance,
                                  with production of air-conditioners falling by nearly 7%, refrigerators by 22%
                                  and televisions by 1%, while output of washing machines grew by nearly 25%.
                                  Meanwhile, the number of motorcycles produced rose by 9% year on year in
                                  January-April.
                                  On the expenditure side, the latest data on consumption and investment indi-
                                  cators suggest that the pace of expansion is slowing. According to figures from
                                  the General Statistics Office (GSO), total retail sales of consumer goods and
                                  services jumped by 22.7% year on year in nominal terms in January-April, with
                                  the GSO stating that in real terms sales growth was at 7.7%. In 2010 as a whole
                                  the GSO put retail sales growth in real terms at 14%. Meanwhile, macro-
                                  economic uncertainty appears to be deterring some investment. While foreign
                                  direct investment inflows remained largely unchanged on a year-on-year basis,
                                  at US$3.6bn in the first four months of 2011, applications for fresh investment
                                  and new capital for existing projects fell by 48% in the first four months of
                                  the year, to just over US$4bn. The government had earlier projected that new
                                  pledges for 2011 as a whole would reach US$20bn, up from 16% in 2010.
                                  The recovery in the global economy, however, has ensured that demand for
                                  Vietnam's merchandise exports has stayed high. In April export revenue rose by
                                  36.9% year on year, to US$7.3bn, and in the first four months of the year revenue
                                  had increased by 35.7%, to US$26.9bn. Exports of textiles grew by 33% year on
                                  year in January-April, to reach US$3.9bn, while footwear exports rose by 26%, to
                                  reach US$1.7bn. Exports of most other manufactured goods posted healthy
                                  growth during the four-month period, notably electronics and computers,
                                  which grew by 11%, to US$1.1bn, and machinery, tools and spare parts, which
                                  grew by 23.7%, to reach US$1.1bn. Commodity exports also performed well,
                                  with revenue driven up by high global prices. The value of coffee exports, for
                                  example, more than doubled on a year-on-year basis in the period, to US$1.4bn,
                                  while volume was up by 37%. Crude oil exports also grew on a year-on-year
                                  basis, rising by 41% to US$2.5bn, with volume rising by just 2.5%.


Country Report May 2011                            www.eiu.com                   © The Economist Intelligence Unit Limited 2011
14                                                                                                                     Vietnam


Concerns persist over the wide     Although the pace of growth in export revenue has been impressive, the import
trade deficit and high inflation   bill continues to increase at a fast pace, rising by 29% year on year in the first
                                   four months of 2011, to US$31.8bn. Owing to both rising prices and higher
                                   import volume, the bill for imported petroleum products reached US$3.6bn in
                                   the period, representing a year-on-year increase of 64%. Steel imports rose by
                                   17% to US$2bn, while machinery and equipment imports, the largest import
                                   group, were up by 17% in the period, to US$4.7bn. The bill for imports of
                                   electronics, computers and spare parts grew by 29% on a year-on-year basis, to
                                   US$1.8bn. Vietnam’s merchandise trade deficit stayed at around US$1.4bn in
                                   April, practically unchanged from the revised level for March, pushing the total
                                   for January-April to US$4.8bn, up from US$4.5bn in the year-earlier period.
                                   In addition to the widening trade deficit, concerns over the state of the
                                   economy continue to be driven by the acceleration in inflation. The GSO has
                                   stated that the sharp rise in fuel prices at the beginning of March was the major
                                   contributing factor behind the acceleration in inflation in April, but food prices
                                   have also soared. In the breakdown of the consumer price index, prices for
                                   grains rose by 22.7% year on year and prices for other foodstuffs rose by 26.6%.
                                   Prices for drinks and cigarettes rose by 11.5%, while prices for clothing and
                                   footwear increased by 11.3% and housing and construction materials by 19%.
                                   Meanwhile, transport costs jumped by 16%, and education soared by 24.5%.


Country Report May 2011                             www.eiu.com                   © The Economist Intelligence Unit Limited 2011
Vietnam                                                                                                                                                                               15


Data and charts
Annual data and forecast
                                                   Pl ea se se e g ra p hi c b el ow


                                                                                         2006 a      2007 a        2008 a      2009 a           2010 b         2011 c         2012 c
GDP
Nominal GDP (US$ bn)                                                                     61.0         71.1          90.3        93.2           103.6 a        109.3          116.1
Nominal GDP (D trn)                                                                     974.3      1,143.7       1,485.0     1,658.4         1,981.7 a      2,306.3        2,625.2
Real GDP growth (%)                                                                       8.2          8.5           6.3         5.3             6.8 a          6.4            7.0
Expenditure on GDP (% real change)
Private consumption                                                                        8.3        10.8           9.3         3.7              7.0            2.9            5.8
Government consumption                                                                     8.5         8.9           7.5         7.6              8.0            7.8            7.8
Gross fixed investment                                                                     9.9        24.2           3.8         8.7              8.5            5.1            7.2
Exports of goods & services                                                               17.7 b      16.0 b        15.1 b      -6.0 b           15.2           13.4           13.6
Imports of goods & services                                                               18.9 b      28.2 b        15.4 b      -6.3 b           17.2            9.7           10.2
Origin of GDP (% real change)
Agriculture                                                                                3.4         3.7           4.4         2.4              2.8 a          3.5            3.4
Industry                                                                                  10.4        10.6           5.7         5.4              7.7 a          7.0            8.0
Services                                                                                   8.3         8.7           7.3         6.8              7.5 a          7.0            7.3
Population and income
Population (m)                                                                           84.4 b      85.3 b        86.1 b      87.0 b           87.8           88.7           89.5
GDP per head (US$ at PPP)                                                               2,358 b     2,606 b       2,803 b     2,950 b          3,150          3,371          3,667
Recorded unemployment (av; %)                                                             4.8         4.6           4.7         4.6              4.4 a          4.1            4.1
Fiscal indicators (% of GDP)
Central government balance                                                                -2.9        -7.3          -5.2        -7.0             -5.5 a         -4.8           -5.3
Net public debt                                                                           42.9 b      45.6 b        43.9 b      49.8 b           57.1           56.0           55.4
Prices and financial indicators
Exchange rate D:US$ (end-period)                                                       16,055      16,010        17,433      18,472           19,498 a       21,864         22,867
Exchange rate D:€ (end-period)                                                         21,188      23,379        24,234      26,474           26,478 a       28,861         29,041
Consumer prices (end-period; %)                                                           6.6        12.6          20.0         6.5             11.8 a         15.9            8.2
Stock of money M1 (% change)                                                             20.7        48.9           -0.4       30.4              1.8           11.2           12.3
Stock of money M2 (% change)                                                             29.7        49.1          20.7        26.2             25.5           22.1           16.7
Lending interest rate (av; %)                                                            11.2        11.2          15.8        10.1             13.1           19.0           18.0
Current account (US$ m)
Trade balance                                                                           -2,776     -10,438       -12,782      -8,307          -7,655         -8,198         -9,521
  Goods: exports fob                                                                    39,826      48,561        62,685      57,096          71,893         90,334         96,350
  Goods: imports fob                                                                   -42,602     -58,999       -75,467     -65,403         -79,548        -98,531       -105,870
Services balance                                                                            -8        -755          -915      -1,230            -966         -1,375           -974
Income balance                                                                          -1,429      -2,190        -4,401      -3,028          -4,587         -4,652         -5,161
Current transfers balance                                                                4,049       6,430         7,311       6,448           7,585          8,103          9,477
Current-account balance                                                                   -164      -6,953       -10,787      -6,117          -5,623         -6,121         -6,178
External debt (US$ m)
Debt stock                                                                             20,126      23,865        26,158      27,366 b         31,123         34,640         37,230
Debt service paid                                                                         949       1,249         1,344       1,114 b          1,210          1,392          1,530
  Principal repayments                                                                    495         640           776         710 b            739            793            824
  Interest                                                                                454         609           568         404 b            471            599            706
International reserves (US$ m)
Total international reserves                                                           13,591      23,748        24,176      16,803           13,280         15,730         15,989
a Actual. b Economist Intelligence Unit estimates. c Economist Intelligence Unit forecasts.
Source: IMF, International Financial Statistics.


Country Report May 2011                                                                            www.eiu.com                           © The Economist Intelligence Unit Limited 2011
16                                                                                                                                                                      Vietnam


Quarterly data
                                                    Pl ea se se e g ra p hi c b el ow


                                                                                          2009                          2010                                           2011
                                                                                          2 Qtr     3 Qtr     4 Qtr     1 Qtr     2 Qtr       3 Qtr        4 Qtr       1 Qtr
Prices
Consumer prices (2005=100)                                                               151.5     153.6      156.2    162.6     165.1       166.6        173.2        183.4
Consumer prices (% change, year on year)                                                   6.2       2.6        4.6      7.5       9.0         8.4         10.8         12.8
Financial indicators
Exchange rate D:US$ (av)                                                                 17,785    17,820    18,094    18,742    18,993     19,278       19,495       20,234
Exchange rate D:US$ (end-period)                                                         17,801    17,841    18,472    19,080    19,065     19,485       19,498       20,908
Deposit rate (av; %)                                                                        7.3       7.9       9.5      10.3      11.1        n/a          n/a          n/a
Lending rate (av; %)                                                                        9.6      10.2      11.0      12.0      13.4        n/a          n/a          n/a
Refinancing rate (end-period; %)                                                            7.0       7.0       8.0       8.0       8.0        8.0          8.7         10.7
Treasury bill rate (av; %)                                                                  7.6       8.4       9.4      11.2       n/a        n/a          n/a          n/a
M1 (end-period; D trn)                                                                    507.8     515.5     565.2     520.5     548.3      563.5          n/a          n/a
M1 (% change, year on year)                                                                48.5      60.2      30.4      12.6       8.0        9.3          n/a          n/a
M2 (end-period; D trn)                                                                  1,776.0   1,842.3   1,910.6   1,982.4   2,166.6    2,325.0          n/a          n/a
M2 (% change, year on year)                                                                37.1      36.7      26.2      20.5      22.0       26.2          n/a          n/a
Foreign trade (US$ m)
Exports fob                                                                              13,572    14,026    15,214    14,345    17,961     18,984       20,366       19,386
Imports cif                                                                             -17,416   -18,813   -20,865   -17,775   -20,736    -21,232      -24,037      -22,784
Trade balance                                                                            -3,844    -4,787    -5,651    -3,430    -2,775     -2,248       -3,671       -3,398
Foreign payments (US$ m)
Merchandise trade balance                                                               -2653.0   -3654.0   -4328.0   -2239.0   -1535.0     -733.0           n/a         n/a
Services balance                                                                            -28      -498      -472      -149      -103       -354           n/a         n/a
Income balance                                                                             -846      -575      -621    -1,430      -763     -1,034           n/a         n/a
Net transfer payments                                                                     1,561     1,618     1,721     2,051     1,835      2,170           n/a         n/a
Current-account balance                                                                  -1,966    -3,109    -3,700    -1,767      -566         49           n/a         n/a
Reserves excl gold (end-period)                                                          20,260    18,769    16,447    13,854    14,121     14,111           n/a         n/a
Sources: IMF, International Financial Statistics.


Country Report May 2011                                                                             www.eiu.com                    © The Economist Intelligence Unit Limited 2011
Vietnam                                                                                                                                                                                   17


Monthly data
                                                            Pl ea se se e g ra p hi c b el ow


                      Jan      Feb      Mar                                                       Apr      May       Jun       Jul     Aug       Sep         Oct        Nov         Dec
Exchange rate D:US$ (av)
2009              17,463   17,482 17,553                                                        17,776   17,785   17,796    17,809   17,816   17,834     17,852      17,960     18,472
2010              18,472   18,679 19,077                                                        19,011   18,987   18,981    19,086   19,262   19,485     19,491      19,498     19,498
2011              19,498   20,329 20,877                                                        20,845      n/a      n/a       n/a      n/a      n/a        n/a         n/a        n/a
Exchange rate D:US$ (end-period)
2009              17,475   17,475 17,756                                                        17,784   17,784   17,801    17,815   17,823   17,841     17,862      18,485     18,472
2010              18,472   18,925 19,080                                                        18,960   18,980   19,065    19,095   19,485   19,485     19,495      19,498     19,498
2011              19,498   20,875 20,908                                                        20,625      n/a      n/a       n/a      n/a      n/a        n/a         n/a        n/a
Money supply M1 (% change, year on year)
2009                 -3.8      5.2     16.7                                                       27.1     34.7     48.5      54.9     58.4     60.2        59.2        57.5       30.4
2010                22.8      23.8     12.6                                                        7.7      8.4      8.0       8.1      9.6      9.3         9.0         n/a        n/a
2011                  n/a      n/a      n/a                                                        n/a      n/a      n/a       n/a      n/a      n/a         n/a         n/a        n/a
Money supply M2 (% change, year on year)
2009                20.8      24.1     26.5                                                       32.5     33.9     37.1      38.5     38.6     36.7        36.5        35.1       26.2
2010                22.5      22.6     20.5                                                       19.4     19.5     22.0      20.7     25.0     26.2        25.4         n/a        n/a
2011                  n/a      n/a      n/a                                                        n/a      n/a      n/a       n/a      n/a      n/a         n/a         n/a        n/a
Deposit rate (av; %)
2009                  7.0      6.5      7.1                                                        7.2      7.3      7.5       7.6      8.0      8.1         8.4        10.0       10.2
2010                10.2      10.2     10.3                                                       11.0     11.2     11.2      11.1     11.1      n/a         n/a         n/a        n/a
2011                  n/a      n/a      n/a                                                        n/a      n/a      n/a       n/a      n/a      n/a         n/a         n/a        n/a
Lending rate (av; %)
2009                10.1       9.4      9.2                                                        9.2      9.6     10.0      10.0     10.3     10.4        10.5        10.5       12.0
2010                12.0      12.0     12.0                                                       13.9     13.2     13.2      13.3     13.0      n/a         n/a         n/a        n/a
2011                  n/a      n/a      n/a                                                        n/a      n/a      n/a       n/a      n/a      n/a         n/a         n/a        n/a
Consumer prices (av; % change, year on year)
2009                19.4      15.5     12.0                                                        9.2     5.6       3.9      3.3      2.0       2.4         3.0         4.3        6.5
2010                  5.9      7.8      8.7                                                        9.2     9.0       8.7      8.2      8.2       8.9         9.7        11.1       11.8
2011                12.2      12.3     13.9                                                       17.5     n/a       n/a      n/a      n/a       n/a         n/a         n/a        n/a
Goods exports fob (US$ m)
2009               3,842     5,097    5,346                                                      4,287    4,454    4,831     4,825    4,639    4,562       5,043      4,704       5,467
2010               5,013     3,740    5,592                                                      5,332    6,312    6,317     6,029    6,857    6,098       6,227      6,450       7,498
2011               7,091     4,848    7,447                                                      7,300      n/a      n/a       n/a      n/a      n/a         n/a        n/a         n/a
Goods imports cif (US$ m)
2009               3,456     4,257    5,141                                                      5,600    5,796    6,020     6,415    5,982    6,416       6,664      6,806       7,395
2010               5,958     5,070    6,747                                                      6,494    7,183    7,059     7,007    7,252    6,973       7,304      7,700       8,792
2011               7,968     5,960    8,856                                                      8,700      n/a      n/a       n/a      n/a      n/a         n/a        n/a         n/a
Trade balance fob-cif (US$ m)
2009                 386       840      205                                                     -1,313   -1,342   -1,189    -1,590   -1,343   -1,854      -1,621     -2,102      -1,928
2010                -945    -1,330   -1,155                                                     -1,162     -871     -742      -978     -395     -875      -1,077     -1,250      -1,294
2011                -877    -1,112   -1,409                                                     -1,400      n/a      n/a       n/a      n/a      n/a         n/a        n/a         n/a
Foreign-exchange reserves excl gold (US$ m)
2009              22,830   22,653 23,008                                                        20,931   20,790   20,260    19,072   18,802   18,769     18,320      17,400     16,447
2010              15,735   15,492 13,854                                                        14,332   13,936   14,121    13,917   13,727   14,111     14,098         n/a        n/a
2011                  n/a      n/a      n/a                                                        n/a      n/a      n/a       n/a      n/a      n/a        n/a         n/a        n/a
Sources: IMF, International Financial Statistics; Haver Analytics.


Country Report May 2011                                                                                       www.eiu.com                     © The Economist Intelligence Unit Limited 2011
18                                                                                                                                                                                                          Vietnam


Annual trends charts
                                                          Pl ea se se e g ra p hi c b el ow


                                                                                                       Annual trends charts

              Real GDP growth                                                                                                      Consumer price inflation
              (% change)                                                                                                           (av; %)

                   Vietnam            Asia (excl Japan)                                        World                                    Vietnam             Asia (excl Japan)        World
       10.0                                                                                                                 25.0

        8.0
                                                                                                                            20.0
        6.0

        4.0                                                                                                                 15.0

        2.0                                                                                                                 10.0
        0.0
                                                                                                                             5.0
       -2.0

       -4.0                                                                                                                  0.0
                 2006        07        08        09                    10                         11          12                      2006        07        08        09        10     11          12

              Source: Economist Intelligence Unit.                                                                                 Source: Economist Intelligence Unit.


              GDP per head                                                                                                         Trade balance
              (US$; PPP)                                                                                                           (% of GDP)

                   Vietnam           Asia (excl Japan)                                        World                                     Vietnam            Asia (excl Japan)
     14,000                                                                                                                  8.0

     12,000                                                                                                                  4.0
     10,000
                                                                                                                             0.0
      8,000
                                                                                                                            -4.0
      6,000
                                                                                                                            -8.0
      4,000

      2,000                                                                                                                -12.0

          0                                                                                                                -16.0
                 2006        07        08        09                     10                        11          12                      2006        07        08        09        10     11          12

              Source: Economist Intelligence Unit.                                                                                 Source: Economist Intelligence Unit.


              Main exports, 2009                                                                                                   Main imports, 2009
              (% of total)                                                                                                         (% of total)
        Others                                                                                            Garments           Others                                                          Machinery &
        41.4                                                                                                  16.0           49.6                                                             equipment
                                                                                                                                                                                                    17.6
                                                                                                           Crude oil
                                                                                                               10.9                                                                           Petroleum
                                                                                                                                                                                                     8.9
                                                                                                          Fisheries
                                                                                                                7.5                                                                                Steel
                                                                                                                                                                                                     7.7
                                                                                                          Footwear
                                                                                                               7.2                                                                                Fabrics
                                                                                                                                                                                                      6.1
        Coffee                                                                                         Electronics &                                                                        Electronics &
        3.0                                                                                               computers                                                                           computers
                                                                                                                 4.8                                                                                  5.7
        Wood products                                                                                          Rice                                                                             Vehicles
        4.5                                                                                                     4.6                                                                                  4.4

              Source: Economist Intelligence Unit.                                                                                 Source: Economist Intelligence Unit.


Country Report May 2011                                                                                            www.eiu.com                                   © The Economist Intelligence Unit Limited 2011
Vietnam 201105
Vietnam 201105
Vietnam 201105
Vietnam 201105

Mais conteúdo relacionado

Destaque

Civil Identity - Just the Facts about Who You are - Soc 101
Civil Identity  - Just the Facts about Who You are - Soc 101Civil Identity  - Just the Facts about Who You are - Soc 101
Civil Identity - Just the Facts about Who You are - Soc 101ProfessorofHumanites3
 
Presentatie groepslesdocent a 2012 augustus
Presentatie groepslesdocent a 2012 augustusPresentatie groepslesdocent a 2012 augustus
Presentatie groepslesdocent a 2012 augustuskengy's support
 
Engage at Melcrum Summit 2012
Engage at Melcrum Summit 2012Engage at Melcrum Summit 2012
Engage at Melcrum Summit 2012Engage Group
 
Driving and Accountable and Collaborative Culture
Driving and Accountable and Collaborative CultureDriving and Accountable and Collaborative Culture
Driving and Accountable and Collaborative CultureCynthia Clay
 
Trainers Matter: Making the Case for VILT
Trainers Matter: Making the Case for VILTTrainers Matter: Making the Case for VILT
Trainers Matter: Making the Case for VILTCynthia Clay
 
InMobi Profile for South Africa
InMobi Profile for South AfricaInMobi Profile for South Africa
InMobi Profile for South AfricaDaryn Smith
 
Sit method
Sit methodSit method
Sit methodumashdon
 
使用 Amazon Athena 直接分析儲存於 S3 的巨量資料
使用 Amazon Athena 直接分析儲存於 S3 的巨量資料使用 Amazon Athena 直接分析儲存於 S3 的巨量資料
使用 Amazon Athena 直接分析儲存於 S3 的巨量資料Amazon Web Services
 

Destaque (9)

LOLER leaflet
LOLER leafletLOLER leaflet
LOLER leaflet
 
Civil Identity - Just the Facts about Who You are - Soc 101
Civil Identity  - Just the Facts about Who You are - Soc 101Civil Identity  - Just the Facts about Who You are - Soc 101
Civil Identity - Just the Facts about Who You are - Soc 101
 
Presentatie groepslesdocent a 2012 augustus
Presentatie groepslesdocent a 2012 augustusPresentatie groepslesdocent a 2012 augustus
Presentatie groepslesdocent a 2012 augustus
 
Engage at Melcrum Summit 2012
Engage at Melcrum Summit 2012Engage at Melcrum Summit 2012
Engage at Melcrum Summit 2012
 
Driving and Accountable and Collaborative Culture
Driving and Accountable and Collaborative CultureDriving and Accountable and Collaborative Culture
Driving and Accountable and Collaborative Culture
 
Trainers Matter: Making the Case for VILT
Trainers Matter: Making the Case for VILTTrainers Matter: Making the Case for VILT
Trainers Matter: Making the Case for VILT
 
InMobi Profile for South Africa
InMobi Profile for South AfricaInMobi Profile for South Africa
InMobi Profile for South Africa
 
Sit method
Sit methodSit method
Sit method
 
使用 Amazon Athena 直接分析儲存於 S3 的巨量資料
使用 Amazon Athena 直接分析儲存於 S3 的巨量資料使用 Amazon Athena 直接分析儲存於 S3 的巨量資料
使用 Amazon Athena 直接分析儲存於 S3 的巨量資料
 

Semelhante a Vietnam 201105

20101101 saudi arabia_country_report(2)
20101101 saudi arabia_country_report(2)20101101 saudi arabia_country_report(2)
20101101 saudi arabia_country_report(2)Abdulhadi Abdullah
 
asian-cities---vn-residential-2h-2015
asian-cities---vn-residential-2h-2015asian-cities---vn-residential-2h-2015
asian-cities---vn-residential-2h-2015Tan Tran
 
Evbn report-retail-final-report.compressed
Evbn report-retail-final-report.compressedEvbn report-retail-final-report.compressed
Evbn report-retail-final-report.compressednguyen phuoc nguyen
 
Ngành Bán lẻ | Báo cáo kênh phân phối và bán lẻ Việt Nam
Ngành Bán lẻ | Báo cáo kênh phân phối và bán lẻ Việt NamNgành Bán lẻ | Báo cáo kênh phân phối và bán lẻ Việt Nam
Ngành Bán lẻ | Báo cáo kênh phân phối và bán lẻ Việt NamJackie Nguyen
 
Asia driving the global economy
Asia driving the global economyAsia driving the global economy
Asia driving the global economyGapa News
 
Asia Analysis, No. 13, 16 March 2011
Asia Analysis, No. 13, 16 March 2011Asia Analysis, No. 13, 16 March 2011
Asia Analysis, No. 13, 16 March 2011Swedbank
 
After the Fall: The Path Forward for China’s Economy and Stock Market
After the Fall: The Path Forward for China’s Economy and Stock MarketAfter the Fall: The Path Forward for China’s Economy and Stock Market
After the Fall: The Path Forward for China’s Economy and Stock MarketFederal Reserve Bank of San Francisco
 
Mr castilla
Mr castillaMr castilla
Mr castillainperu
 
AFC Vietnam Fund Presentation 2015.04.09
AFC Vietnam Fund Presentation 2015.04.09AFC Vietnam Fund Presentation 2015.04.09
AFC Vietnam Fund Presentation 2015.04.09Thomas Hugger
 
Q.1 2013 Cushman & Wakefield Market beat report
Q.1 2013 Cushman & Wakefield Market beat reportQ.1 2013 Cushman & Wakefield Market beat report
Q.1 2013 Cushman & Wakefield Market beat reportTrang Le
 
IR Presentation
IR PresentationIR Presentation
IR Presentationraucan163
 
Financial developemnt and economic growth in ten Asian countries.pdf
Financial developemnt and economic growth in ten Asian countries.pdfFinancial developemnt and economic growth in ten Asian countries.pdf
Financial developemnt and economic growth in ten Asian countries.pdfHanaTiti
 
Vietnam Banking Report 2020 - FiinResearch
Vietnam Banking Report 2020 - FiinResearchVietnam Banking Report 2020 - FiinResearch
Vietnam Banking Report 2020 - FiinResearchFiinGroup JSC
 
AFC Vietnam Fund Presentation 10.7.2018
AFC Vietnam Fund Presentation 10.7.2018AFC Vietnam Fund Presentation 10.7.2018
AFC Vietnam Fund Presentation 10.7.2018Thomas Hugger
 
Asia Frontier Capital - AFC Vietnam Fund presentation 2015.08.09
Asia Frontier Capital - AFC Vietnam Fund presentation 2015.08.09Asia Frontier Capital - AFC Vietnam Fund presentation 2015.08.09
Asia Frontier Capital - AFC Vietnam Fund presentation 2015.08.09Thomas Hugger
 

Semelhante a Vietnam 201105 (20)

20101101 saudi arabia_country_report(2)
20101101 saudi arabia_country_report(2)20101101 saudi arabia_country_report(2)
20101101 saudi arabia_country_report(2)
 
asian-cities---vn-residential-2h-2015
asian-cities---vn-residential-2h-2015asian-cities---vn-residential-2h-2015
asian-cities---vn-residential-2h-2015
 
Evbn report-retail-final-report.compressed
Evbn report-retail-final-report.compressedEvbn report-retail-final-report.compressed
Evbn report-retail-final-report.compressed
 
Ngành Bán lẻ | Báo cáo kênh phân phối và bán lẻ Việt Nam
Ngành Bán lẻ | Báo cáo kênh phân phối và bán lẻ Việt NamNgành Bán lẻ | Báo cáo kênh phân phối và bán lẻ Việt Nam
Ngành Bán lẻ | Báo cáo kênh phân phối và bán lẻ Việt Nam
 
Asia driving the global economy
Asia driving the global economyAsia driving the global economy
Asia driving the global economy
 
Asia Analysis, No. 13, 16 March 2011
Asia Analysis, No. 13, 16 March 2011Asia Analysis, No. 13, 16 March 2011
Asia Analysis, No. 13, 16 March 2011
 
After the Fall: The Path Forward for China’s Economy and Stock Market
After the Fall: The Path Forward for China’s Economy and Stock MarketAfter the Fall: The Path Forward for China’s Economy and Stock Market
After the Fall: The Path Forward for China’s Economy and Stock Market
 
Mr castilla
Mr castillaMr castilla
Mr castilla
 
GFCI #20
GFCI #20GFCI #20
GFCI #20
 
Global Financial Centers Index
Global Financial Centers IndexGlobal Financial Centers Index
Global Financial Centers Index
 
Vietnam Investment Report Q4 2015 (EN)
Vietnam Investment Report Q4 2015 (EN)Vietnam Investment Report Q4 2015 (EN)
Vietnam Investment Report Q4 2015 (EN)
 
AFC Vietnam Fund Presentation 2015.04.09
AFC Vietnam Fund Presentation 2015.04.09AFC Vietnam Fund Presentation 2015.04.09
AFC Vietnam Fund Presentation 2015.04.09
 
Q.1 2013 Cushman & Wakefield Market beat report
Q.1 2013 Cushman & Wakefield Market beat reportQ.1 2013 Cushman & Wakefield Market beat report
Q.1 2013 Cushman & Wakefield Market beat report
 
IR Presentation
IR PresentationIR Presentation
IR Presentation
 
Financial developemnt and economic growth in ten Asian countries.pdf
Financial developemnt and economic growth in ten Asian countries.pdfFinancial developemnt and economic growth in ten Asian countries.pdf
Financial developemnt and economic growth in ten Asian countries.pdf
 
Vietnam Banking Report 2020 - FiinResearch
Vietnam Banking Report 2020 - FiinResearchVietnam Banking Report 2020 - FiinResearch
Vietnam Banking Report 2020 - FiinResearch
 
Vietnam Market Overview 3 Q12
Vietnam Market Overview 3 Q12Vietnam Market Overview 3 Q12
Vietnam Market Overview 3 Q12
 
AFC Vietnam Fund Presentation 10.7.2018
AFC Vietnam Fund Presentation 10.7.2018AFC Vietnam Fund Presentation 10.7.2018
AFC Vietnam Fund Presentation 10.7.2018
 
Asia Frontier Capital - AFC Vietnam Fund presentation 2015.08.09
Asia Frontier Capital - AFC Vietnam Fund presentation 2015.08.09Asia Frontier Capital - AFC Vietnam Fund presentation 2015.08.09
Asia Frontier Capital - AFC Vietnam Fund presentation 2015.08.09
 
Hilton-Baird Financial Solutions SME Trends Index April 2011 Report
Hilton-Baird Financial Solutions SME Trends Index April 2011 ReportHilton-Baird Financial Solutions SME Trends Index April 2011 Report
Hilton-Baird Financial Solutions SME Trends Index April 2011 Report
 

Mais de IDEE JSC

Vietnam country profile
Vietnam country profileVietnam country profile
Vietnam country profileIDEE JSC
 
Vietnam country profile
Vietnam country profileVietnam country profile
Vietnam country profileIDEE JSC
 
Vietnam market size
Vietnam market sizeVietnam market size
Vietnam market sizeIDEE JSC
 
Tmca conceptualizing and_researching_employer_branding
Tmca conceptualizing and_researching_employer_brandingTmca conceptualizing and_researching_employer_branding
Tmca conceptualizing and_researching_employer_brandingIDEE JSC
 
Southwest employee branding
Southwest employee brandingSouthwest employee branding
Southwest employee brandingIDEE JSC
 
Nefa.branding.report10.17.05
Nefa.branding.report10.17.05Nefa.branding.report10.17.05
Nefa.branding.report10.17.05IDEE JSC
 
Internalbranding
InternalbrandingInternalbranding
InternalbrandingIDEE JSC
 
Iabc employee engagementreport2010final
Iabc employee engagementreport2010finalIabc employee engagementreport2010final
Iabc employee engagementreport2010finalIDEE JSC
 
Global local branding
Global local brandingGlobal local branding
Global local brandingIDEE JSC
 
Erm brochure emplyer_branding
Erm brochure emplyer_brandingErm brochure emplyer_branding
Erm brochure emplyer_brandingIDEE JSC
 
Employment marketing branding_2007projectsummaryreport
Employment marketing branding_2007projectsummaryreportEmployment marketing branding_2007projectsummaryreport
Employment marketing branding_2007projectsummaryreportIDEE JSC
 
Employer branding in_the_e-world
Employer branding in_the_e-worldEmployer branding in_the_e-world
Employer branding in_the_e-worldIDEE JSC
 
Employer branding
Employer brandingEmployer branding
Employer brandingIDEE JSC
 
Employee engagement
Employee engagementEmployee engagement
Employee engagementIDEE JSC
 
Employee branding-online
Employee branding-onlineEmployee branding-online
Employee branding-onlineIDEE JSC
 
Cause branding ls_apresentation042308
Cause branding ls_apresentation042308Cause branding ls_apresentation042308
Cause branding ls_apresentation042308IDEE JSC
 

Mais de IDEE JSC (20)

Vietnam country profile
Vietnam country profileVietnam country profile
Vietnam country profile
 
Vietnam country profile
Vietnam country profileVietnam country profile
Vietnam country profile
 
Vietnam market size
Vietnam market sizeVietnam market size
Vietnam market size
 
Vnmbfr
VnmbfrVnmbfr
Vnmbfr
 
Tmca conceptualizing and_researching_employer_branding
Tmca conceptualizing and_researching_employer_brandingTmca conceptualizing and_researching_employer_branding
Tmca conceptualizing and_researching_employer_branding
 
Southwest employee branding
Southwest employee brandingSouthwest employee branding
Southwest employee branding
 
Shrm
ShrmShrm
Shrm
 
Nefa.branding.report10.17.05
Nefa.branding.report10.17.05Nefa.branding.report10.17.05
Nefa.branding.report10.17.05
 
Kit
KitKit
Kit
 
Internalbranding
InternalbrandingInternalbranding
Internalbranding
 
Iabc employee engagementreport2010final
Iabc employee engagementreport2010finalIabc employee engagementreport2010final
Iabc employee engagementreport2010final
 
Global local branding
Global local brandingGlobal local branding
Global local branding
 
Erm brochure emplyer_branding
Erm brochure emplyer_brandingErm brochure emplyer_branding
Erm brochure emplyer_branding
 
Employment marketing branding_2007projectsummaryreport
Employment marketing branding_2007projectsummaryreportEmployment marketing branding_2007projectsummaryreport
Employment marketing branding_2007projectsummaryreport
 
Employer branding in_the_e-world
Employer branding in_the_e-worldEmployer branding in_the_e-world
Employer branding in_the_e-world
 
Employer branding
Employer brandingEmployer branding
Employer branding
 
Employee engagement
Employee engagementEmployee engagement
Employee engagement
 
Employee branding-online
Employee branding-onlineEmployee branding-online
Employee branding-online
 
Cci dfs
Cci dfsCci dfs
Cci dfs
 
Cause branding ls_apresentation042308
Cause branding ls_apresentation042308Cause branding ls_apresentation042308
Cause branding ls_apresentation042308
 

Último

Call Girls In Sikandarpur Gurgaon ❤️8860477959_Russian 100% Genuine Escorts I...
Call Girls In Sikandarpur Gurgaon ❤️8860477959_Russian 100% Genuine Escorts I...Call Girls In Sikandarpur Gurgaon ❤️8860477959_Russian 100% Genuine Escorts I...
Call Girls In Sikandarpur Gurgaon ❤️8860477959_Russian 100% Genuine Escorts I...lizamodels9
 
8447779800, Low rate Call girls in Uttam Nagar Delhi NCR
8447779800, Low rate Call girls in Uttam Nagar Delhi NCR8447779800, Low rate Call girls in Uttam Nagar Delhi NCR
8447779800, Low rate Call girls in Uttam Nagar Delhi NCRashishs7044
 
8447779800, Low rate Call girls in New Ashok Nagar Delhi NCR
8447779800, Low rate Call girls in New Ashok Nagar Delhi NCR8447779800, Low rate Call girls in New Ashok Nagar Delhi NCR
8447779800, Low rate Call girls in New Ashok Nagar Delhi NCRashishs7044
 
Flow Your Strategy at Flight Levels Day 2024
Flow Your Strategy at Flight Levels Day 2024Flow Your Strategy at Flight Levels Day 2024
Flow Your Strategy at Flight Levels Day 2024Kirill Klimov
 
Digital Transformation in the PLM domain - distrib.pdf
Digital Transformation in the PLM domain - distrib.pdfDigital Transformation in the PLM domain - distrib.pdf
Digital Transformation in the PLM domain - distrib.pdfJos Voskuil
 
8447779800, Low rate Call girls in Kotla Mubarakpur Delhi NCR
8447779800, Low rate Call girls in Kotla Mubarakpur Delhi NCR8447779800, Low rate Call girls in Kotla Mubarakpur Delhi NCR
8447779800, Low rate Call girls in Kotla Mubarakpur Delhi NCRashishs7044
 
Contemporary Economic Issues Facing the Filipino Entrepreneur (1).pptx
Contemporary Economic Issues Facing the Filipino Entrepreneur (1).pptxContemporary Economic Issues Facing the Filipino Entrepreneur (1).pptx
Contemporary Economic Issues Facing the Filipino Entrepreneur (1).pptxMarkAnthonyAurellano
 
Buy gmail accounts.pdf Buy Old Gmail Accounts
Buy gmail accounts.pdf Buy Old Gmail AccountsBuy gmail accounts.pdf Buy Old Gmail Accounts
Buy gmail accounts.pdf Buy Old Gmail AccountsBuy Verified Accounts
 
Call Girls In Sikandarpur Gurgaon ❤️8860477959_Russian 100% Genuine Escorts I...
Call Girls In Sikandarpur Gurgaon ❤️8860477959_Russian 100% Genuine Escorts I...Call Girls In Sikandarpur Gurgaon ❤️8860477959_Russian 100% Genuine Escorts I...
Call Girls In Sikandarpur Gurgaon ❤️8860477959_Russian 100% Genuine Escorts I...lizamodels9
 
Keppel Ltd. 1Q 2024 Business Update Presentation Slides
Keppel Ltd. 1Q 2024 Business Update  Presentation SlidesKeppel Ltd. 1Q 2024 Business Update  Presentation Slides
Keppel Ltd. 1Q 2024 Business Update Presentation SlidesKeppelCorporation
 
Investment in The Coconut Industry by Nancy Cheruiyot
Investment in The Coconut Industry by Nancy CheruiyotInvestment in The Coconut Industry by Nancy Cheruiyot
Investment in The Coconut Industry by Nancy Cheruiyotictsugar
 
FULL ENJOY Call girls in Paharganj Delhi | 8377087607
FULL ENJOY Call girls in Paharganj Delhi | 8377087607FULL ENJOY Call girls in Paharganj Delhi | 8377087607
FULL ENJOY Call girls in Paharganj Delhi | 8377087607dollysharma2066
 
Kenya’s Coconut Value Chain by Gatsby Africa
Kenya’s Coconut Value Chain by Gatsby AfricaKenya’s Coconut Value Chain by Gatsby Africa
Kenya’s Coconut Value Chain by Gatsby Africaictsugar
 
Lowrate Call Girls In Sector 18 Noida ❤️8860477959 Escorts 100% Genuine Servi...
Lowrate Call Girls In Sector 18 Noida ❤️8860477959 Escorts 100% Genuine Servi...Lowrate Call Girls In Sector 18 Noida ❤️8860477959 Escorts 100% Genuine Servi...
Lowrate Call Girls In Sector 18 Noida ❤️8860477959 Escorts 100% Genuine Servi...lizamodels9
 
Kenya Coconut Production Presentation by Dr. Lalith Perera
Kenya Coconut Production Presentation by Dr. Lalith PereraKenya Coconut Production Presentation by Dr. Lalith Perera
Kenya Coconut Production Presentation by Dr. Lalith Pereraictsugar
 
BEST Call Girls In Old Faridabad ✨ 9773824855 ✨ Escorts Service In Delhi Ncr,
BEST Call Girls In Old Faridabad ✨ 9773824855 ✨ Escorts Service In Delhi Ncr,BEST Call Girls In Old Faridabad ✨ 9773824855 ✨ Escorts Service In Delhi Ncr,
BEST Call Girls In Old Faridabad ✨ 9773824855 ✨ Escorts Service In Delhi Ncr,noida100girls
 
Intro to BCG's Carbon Emissions Benchmark_vF.pdf
Intro to BCG's Carbon Emissions Benchmark_vF.pdfIntro to BCG's Carbon Emissions Benchmark_vF.pdf
Intro to BCG's Carbon Emissions Benchmark_vF.pdfpollardmorgan
 
Innovation Conference 5th March 2024.pdf
Innovation Conference 5th March 2024.pdfInnovation Conference 5th March 2024.pdf
Innovation Conference 5th March 2024.pdfrichard876048
 
APRIL2024_UKRAINE_xml_0000000000000 .pdf
APRIL2024_UKRAINE_xml_0000000000000 .pdfAPRIL2024_UKRAINE_xml_0000000000000 .pdf
APRIL2024_UKRAINE_xml_0000000000000 .pdfRbc Rbcua
 
Call Girls Miyapur 7001305949 all area service COD available Any Time
Call Girls Miyapur 7001305949 all area service COD available Any TimeCall Girls Miyapur 7001305949 all area service COD available Any Time
Call Girls Miyapur 7001305949 all area service COD available Any Timedelhimodelshub1
 

Último (20)

Call Girls In Sikandarpur Gurgaon ❤️8860477959_Russian 100% Genuine Escorts I...
Call Girls In Sikandarpur Gurgaon ❤️8860477959_Russian 100% Genuine Escorts I...Call Girls In Sikandarpur Gurgaon ❤️8860477959_Russian 100% Genuine Escorts I...
Call Girls In Sikandarpur Gurgaon ❤️8860477959_Russian 100% Genuine Escorts I...
 
8447779800, Low rate Call girls in Uttam Nagar Delhi NCR
8447779800, Low rate Call girls in Uttam Nagar Delhi NCR8447779800, Low rate Call girls in Uttam Nagar Delhi NCR
8447779800, Low rate Call girls in Uttam Nagar Delhi NCR
 
8447779800, Low rate Call girls in New Ashok Nagar Delhi NCR
8447779800, Low rate Call girls in New Ashok Nagar Delhi NCR8447779800, Low rate Call girls in New Ashok Nagar Delhi NCR
8447779800, Low rate Call girls in New Ashok Nagar Delhi NCR
 
Flow Your Strategy at Flight Levels Day 2024
Flow Your Strategy at Flight Levels Day 2024Flow Your Strategy at Flight Levels Day 2024
Flow Your Strategy at Flight Levels Day 2024
 
Digital Transformation in the PLM domain - distrib.pdf
Digital Transformation in the PLM domain - distrib.pdfDigital Transformation in the PLM domain - distrib.pdf
Digital Transformation in the PLM domain - distrib.pdf
 
8447779800, Low rate Call girls in Kotla Mubarakpur Delhi NCR
8447779800, Low rate Call girls in Kotla Mubarakpur Delhi NCR8447779800, Low rate Call girls in Kotla Mubarakpur Delhi NCR
8447779800, Low rate Call girls in Kotla Mubarakpur Delhi NCR
 
Contemporary Economic Issues Facing the Filipino Entrepreneur (1).pptx
Contemporary Economic Issues Facing the Filipino Entrepreneur (1).pptxContemporary Economic Issues Facing the Filipino Entrepreneur (1).pptx
Contemporary Economic Issues Facing the Filipino Entrepreneur (1).pptx
 
Buy gmail accounts.pdf Buy Old Gmail Accounts
Buy gmail accounts.pdf Buy Old Gmail AccountsBuy gmail accounts.pdf Buy Old Gmail Accounts
Buy gmail accounts.pdf Buy Old Gmail Accounts
 
Call Girls In Sikandarpur Gurgaon ❤️8860477959_Russian 100% Genuine Escorts I...
Call Girls In Sikandarpur Gurgaon ❤️8860477959_Russian 100% Genuine Escorts I...Call Girls In Sikandarpur Gurgaon ❤️8860477959_Russian 100% Genuine Escorts I...
Call Girls In Sikandarpur Gurgaon ❤️8860477959_Russian 100% Genuine Escorts I...
 
Keppel Ltd. 1Q 2024 Business Update Presentation Slides
Keppel Ltd. 1Q 2024 Business Update  Presentation SlidesKeppel Ltd. 1Q 2024 Business Update  Presentation Slides
Keppel Ltd. 1Q 2024 Business Update Presentation Slides
 
Investment in The Coconut Industry by Nancy Cheruiyot
Investment in The Coconut Industry by Nancy CheruiyotInvestment in The Coconut Industry by Nancy Cheruiyot
Investment in The Coconut Industry by Nancy Cheruiyot
 
FULL ENJOY Call girls in Paharganj Delhi | 8377087607
FULL ENJOY Call girls in Paharganj Delhi | 8377087607FULL ENJOY Call girls in Paharganj Delhi | 8377087607
FULL ENJOY Call girls in Paharganj Delhi | 8377087607
 
Kenya’s Coconut Value Chain by Gatsby Africa
Kenya’s Coconut Value Chain by Gatsby AfricaKenya’s Coconut Value Chain by Gatsby Africa
Kenya’s Coconut Value Chain by Gatsby Africa
 
Lowrate Call Girls In Sector 18 Noida ❤️8860477959 Escorts 100% Genuine Servi...
Lowrate Call Girls In Sector 18 Noida ❤️8860477959 Escorts 100% Genuine Servi...Lowrate Call Girls In Sector 18 Noida ❤️8860477959 Escorts 100% Genuine Servi...
Lowrate Call Girls In Sector 18 Noida ❤️8860477959 Escorts 100% Genuine Servi...
 
Kenya Coconut Production Presentation by Dr. Lalith Perera
Kenya Coconut Production Presentation by Dr. Lalith PereraKenya Coconut Production Presentation by Dr. Lalith Perera
Kenya Coconut Production Presentation by Dr. Lalith Perera
 
BEST Call Girls In Old Faridabad ✨ 9773824855 ✨ Escorts Service In Delhi Ncr,
BEST Call Girls In Old Faridabad ✨ 9773824855 ✨ Escorts Service In Delhi Ncr,BEST Call Girls In Old Faridabad ✨ 9773824855 ✨ Escorts Service In Delhi Ncr,
BEST Call Girls In Old Faridabad ✨ 9773824855 ✨ Escorts Service In Delhi Ncr,
 
Intro to BCG's Carbon Emissions Benchmark_vF.pdf
Intro to BCG's Carbon Emissions Benchmark_vF.pdfIntro to BCG's Carbon Emissions Benchmark_vF.pdf
Intro to BCG's Carbon Emissions Benchmark_vF.pdf
 
Innovation Conference 5th March 2024.pdf
Innovation Conference 5th March 2024.pdfInnovation Conference 5th March 2024.pdf
Innovation Conference 5th March 2024.pdf
 
APRIL2024_UKRAINE_xml_0000000000000 .pdf
APRIL2024_UKRAINE_xml_0000000000000 .pdfAPRIL2024_UKRAINE_xml_0000000000000 .pdf
APRIL2024_UKRAINE_xml_0000000000000 .pdf
 
Call Girls Miyapur 7001305949 all area service COD available Any Time
Call Girls Miyapur 7001305949 all area service COD available Any TimeCall Girls Miyapur 7001305949 all area service COD available Any Time
Call Girls Miyapur 7001305949 all area service COD available Any Time
 

Vietnam 201105

  • 1. Country Report Vietnam May 2011 Economist Intelligence Unit 26 Red Lion Square London WC1R 4HQ United Kingdom
  • 2. Economist Intelligence Unit The Economist Intelligence Unit is a specialist publisher serving companies establishing and managing operations across national borders. For 60 years it has been a source of information on business developments, economic and political trends, government regulations and corporate practice worldwide. The Economist Intelligence Unit delivers its information in four ways: through its digital portfolio, where the latest analysis is updated daily; through printed subscription products ranging from newsletters to annual reference works; through research reports; and by organising seminars and presentations. The firm is a member of The Economist Group. London New York Economist Intelligence Unit Economist Intelligence Unit 26 Red Lion Square The Economist Group London 750 Third Avenue WC1R 4HQ 5th Floor United Kingdom New York, NY 10017, US Tel: (44.20) 7576 8000 Tel: (1.212) 554 0600 Fax: (44.20) 7576 8500 Fax: (1.212) 586 0248 E-mail: london@eiu.com E-mail: newyork@eiu.com Hong Kong Geneva Economist Intelligence Unit Economist Intelligence Unit 60/F, Central Plaza Boulevard des Tranchées 16 18 Harbour Road 1206 Geneva Wanchai Switzerland Hong Kong Tel: (852) 2585 3888 Tel: (41) 22 566 2470 Fax: (852) 2802 7638 Fax: (41) 22 346 93 47 E-mail: hongkong@eiu.com E-mail: geneva@eiu.com This report can be accessed electronically as soon as it is published by visiting store.eiu.com or by contacting a local sales representative. The whole report may be viewed in PDF format, or can be navigated section-by-section by using the HTML links. In addition, the full archive of previous reports can be accessed in HTML or PDF format, and our search engine can be used to find content of interest quickly. Our automatic alerting service will send a notification via e- mail when new reports become available. Copyright © 2011 The Economist Intelligence Unit Limited. All rights reserved. Neither this publication nor any part of it may be reproduced, stored in a retrieval system, or transmitted in any form or by any means, electronic, mechanical, by photocopy, recording or otherwise, without the prior permission of The Economist Intelligence Unit Limited. All information in this report is verified to the best of the author's and the publisher's ability. However, the Economist Intelligence Unit does not accept responsibility for any loss arising from reliance on it. ISSN 1356-403X Symbols for tables “0 or 0.0” means nil or negligible; “n/a” means not available; “–” means not applicable Printed and distributed by IntypeLibra, Units 3/4, Elm Grove Industrial Estate, Wimbledon, SW19 4HE
  • 3. Vietnam 1 Vietnam Executive summary 3 Highlights Outlook for 2011-15 4 Political outlook 6 Economic policy outlook 7 Economic forecast Monthly review: May 2011 10 The political scene 11 Economic policy 13 Economic performance Data and charts 15 Annual data and forecast 16 Quarterly data 17 Monthly data 18 Annual trends charts 19 Monthly trends charts 20 Comparative economic indicators Country snapshot 21 Basic data 22 Political structure Editors: Danny Richards (editor); Kilbinder Dosanjh (consulting editor) Editorial closing date: May 6th 2011 All queries: Tel: (44.20) 7576 8000 E-mail: london@eiu.com Next report: To request the latest schedule, e-mail schedule@eiu.com Country Report May 2011 www.eiu.com © The Economist Intelligence Unit Limited 2011
  • 4. 2 Vietnam CHINA Ha Giang Cao Bang Lao Cai Bl a ck R. Re Lai Chau d R. Tuyen Quang Lang Son Lang Yen Bai Thai Nguyen Dien Bien Phu Phu Tho Bac Giang Song Tay HANOI Cam Pha Ha Dong Hong Gai Hai Duong Haiphong Nan Dinh Ninh Binh Thanh Hoa Gulf of Tonkin LAOS Quynh Luu Vinh Ha Tinh Dong Hoi Dong Ha Paracel Is. (disputed) Hue Da Nang THAILAND Hoi An Tam Ky Quang Ngai SOUTH CHINA VIETNAM SEA Kon Tum Pleiku Qui Nhon Tuy Hoa CAMBODIA Ban Me Thuot Ninh Hoa Nha Trang Da Lat Cam Ranh Loc Ninh Bao Loc Phan Rang Gulf of Thailand Tay Ninh Thu Dau Thu Dau Mot Bien Hoa Phan Thiet Ho Chi Minh City Main railway Me Chau Doc ko ng My Tho R Long Xuyen Vung Tau Main road Dao Phu Quoc Vinh Long Ben Tre Rach Gia International boundary Can Tho Phu Vinh Soc Trang Main airport Capital 0 km 100 200 300 Ca Mau Bac Lieu Major town 0 miles 100 200 Con Dao Other town © The Economist Intelligence Unit Limited 2011 Country Report May 2011 www.eiu.com © The Economist Intelligence Unit Limited 2011
  • 5. Vietnam 3 Executive summary Highlights May 2011 Outlook for 2011-15 • The Communist Party of Vietnam will keep a firm grip on power in the forecast period, and, despite signs of factional splits between conservative hardliners and reformers, there is no prospect of any major internal instability. • Given the generally high level of political apathy, together with the regime’s determination to crack down hard on pro-democracy activists, the likelihood that Vietnam will suffer an upheaval similar to that in the Arab world is low. • Policymakers have embarked on a process of tightening economic policy, but concerns persist over whether there is sufficient political will to implement tougher measures that may be needed to stabilise the economy. • Real GDP growth will slow this year, to 6.4%, but it will return to an average rate of 7-7.5% a year in the remainder of the forecast period, underpinned by strong growth in consumption, investment and exports. • Inflation will accelerate to an average rate of 16.9% in 2011, before slowing to an average of 8% a year in 2012-15. Policymakers are likely to face an ongoing battle to keep the dong stable against the US dollar. • The current account will remain in deficit over the next five years, but capital and financial inflows (including official foreign borrowing) will increase from the low levels that they reached in 2009. Monthly review • The authorities have adopted something of an "arrest first, ask questions later" policy to stamp out the threat of political dissent. There have also been some high-profile legal cases against dissidents in recent months. • Vietnam appears to be fighting a losing battle to prevent the construction of a hydropower dam project in Laos, which could further disrupt the flow of water into the fertile flood plains of the Mekong delta in southern Vietnam. • The State Bank of Vietnam (the central bank) has continued to push up policy interest rates. It increased the refinance rate by 100 basis points twice in April, raising it to 14%. • Although the pace of year-on-year economic growth slowed to 5.4% in the first quarter, industrial output growth remains strong—in January-April it grew by 14% year on year, the same pace of growth recorded in 2010 as a whole. • The pace of growth in merchandise export revenue has been impressive, but the import bill continues to increase at a fast pace, rising by 29% year on year in January-April, to US$31.8bn. • Concerns over the state of the economy continue to be driven by the accele- ration in inflation, which reached 17.5% year on year in April. Country Report May 2011 www.eiu.com © The Economist Intelligence Unit Limited 2011
  • 6. 4 Vietnam Outlook for 2011-15 Political outlook Political stability The ruling Communist Party of Vietnam (CPV) will maintain a firm grip on power in the next five years, and, despite signs of factional splits between conservative hardliners and relative reformers, there is no prospect of any major internal instability. Indeed, at the party's 11th national congress, in January, there were displays of unity as the party continued to espouse one- party rule. The congress did provide a chance for different factions to stake a claim to greater influence, but the spoils have been shared. The beleaguered prime minister, Nguyen Tan Dung, appears to have kept his post—his re-appointment will only be formally made following the formation of the 13th National Assembly (NA, the legislature) after national elections, which will be held on May 22nd. Although Mr Dung's continuation in office appears to have been endorsed by the CPV, his reputation has been damaged by the near- collapse of one of the largest state-owned enterprises, the Vietnam Shipbuilding Industry Group (Vinashin), and his political opponents have appeared bent on using the debacle as a way to reduce his political power. Truong Tan Sang, the head of the CPV secretariat, is in line to become president. Although the presidency is largely a ceremonial post, Mr Sang is one of Mr Dung's most formidable rivals within the party and is regarded as being a highly influential member of the party’s conservative bloc. The post of party general secretary has gone to a Marxist theorist, Nguyen Phu Trong, who will stand down as chairman of the NA. The choice of Mr Trong, who is widely regarded as being a moderate, was possibly a compromise, providing some balance to the rivalry between Mr Dung and Mr Sang. However, given that Mr Trong is already 66, unlike his predecessor, Nong Duc Manh, he is not expected to serve two five- year terms. This suggests that internal power struggles could be reignited towards the end of the forecast period, ahead of the next congress. The CPV will continue to face objections from some quarters to its long- standing claim that it has the right to govern unchallenged. However, given the generally high level of political apathy, together with the regime’s deter- mination to crack down on activists who advocate genuine democratic reform, there is little likelihood that any opposition movement will gain traction. The likelihood that Vietnam will suffer an upheaval similar to that taking place in a number of countries in the Middle East and North Africa is therefore low. However, concerns over soaring prices could create the conditions for social unrest in the short term, while protests over land seizures could become more common during the forecast period. The fast pace of industrial development in Vietnam has entailed the increasingly rapid construction of factories, plants and large infrastructure projects, such as roads and dams, throughout the country. As a result, the number of displaced residents has risen, and some have been vocal about what they perceive as inadequate government compensation for the loss of their land. Meanwhile, corruption in local bureaucracies occa- sionally results in the embezzlement of funds earmarked to compensate people who have been evicted from their land, leaving them dispossessed and with Country Report May 2011 www.eiu.com © The Economist Intelligence Unit Limited 2011
  • 7. Vietnam 5 inadequate resources to rebuild their livelihoods. Public anger over such issues will intensify unless the authorities take action to punish corrupt local officials. Tensions between the government and religious and ethnic-minority groups could come to the fore again in the next five years, with the state taking a harder line against minorities. The CPV tolerates religious activity as long as it does not pose a threat to the regime, although there have been flashpoints recently in the party's dealings with the Roman Catholic church. The party has warned that "social disorder" arising from land disputes over religious property will be strictly punished. The confiscation of property belonging to the Catholic church between the 1950s and 1970s remains a sore point in relations between the Vietnamese government, the local church and the Vatican. There are 6m Catholics in Vietnam, making the Catholic church the largest organisation in the country outside the orbit of the CPV. The party leadership will also remain concerned about the potential for social unrest in the Central Highlands. The area is largely populated by ethnic-minority groups, and, owing to the fact that party membership is not common, official control in that region is relatively weak. Election watch Vietnam is a one-party communist state, and elections do not play a major role in its political life. Appointments to CPV posts take place behind closed doors, with votes conducted merely to confirm decisions that have already been made. NA delegates are chosen by popular vote, and the next such election is scheduled for May 22nd 2011. However, candidates are closely vetted by the Vietnam Fatherland Front (VFF), a CPV-controlled umbrella body that includes all of the country's "mass organisations", and only those deemed suitable are allowed to stand. According to the vice-chair of the VFF Central Committee, Nguyen Van Pha, 832 out of 1,086 candidates were recently shortlisted for the NA election, of whom 83 were self-nominated (including both members and non-members of the CPV). At the 2007 election only 43 of the 493 people elected to the NA were non-CPV members. International relations Vietnam will continue to make strides in strengthening its ties with the West, particularly with the US. Vietnamese-US diplomatic ties have been bolstered by high-level exchanges in recent years, and the economic relationship between the two countries has developed rapidly. Military links have also become dramatically closer, as highlighted by joint military exercises in the South China Sea in August 2010. Despite these positive trends, US concerns over human rights and religious freedom in Vietnam will remain a source of bilateral tensions. However, such stress will not cause anything more serious than the occasional diplomatic spat. The US views Vietnam as an important ally in Asia, while Vietnam has both an economic and a security interest in maintaining close ties with the US. Although keen to become closer to the US, the current leadership in Vietnam will also seek to maintain strong relations with China. However, the two foreign policy objectives could prove difficult to balance. The most significant unresolved issue between Vietnam and China concerns competing claims to the Spratly and Paracel islands in the South China Sea, particularly in view of China’s increasingly assertive approach to matters of sovereignty. In addition to claims by Vietnam and China of full sovereignty Country Report May 2011 www.eiu.com © The Economist Intelligence Unit Limited 2011
  • 8. 6 Vietnam over the islands, the Philippines, Brunei, Malaysia and Taiwan have also made full or partial claims. The dispute is unlikely to be resolved in 2011-15, but all the claimants have signed the Declaration on the Code of Conduct in the East (South China) Sea, which was initiated by the Association of South-East Asian Nations (ASEAN) and commits signatories to "resolving all disputes through peaceful negotiations in accordance with international laws and practices". The disputed area is becoming increasingly important strategically, however, as it is believed to contain oil and gas deposits and is also an important shipping route. Economic policy outlook Policy trends Policymakers have embarked on a process of tightening economic policy, but concerns persist over whether there is sufficient political will to implement tougher measures that may be needed to stabilise the economy. The State Bank of Vietnam (SBV, the central bank) has tightened its monetary policy stance by pushing up its policy interest rates in recent months, but inflation is likely to remain in double digits in the short term—the sharp devaluation of the dong over the past year or so will create greater imported inflationary pressures, while the government has had to increase subsidised retail prices for fuel and electricity, owing to sharp rises in global crude oil prices recently. The govern- ment has also signalled its intention to tighten its fiscal policy stance, and further administrative measures may be introduced to slow the pace of growth in domestic credit. However, in the light of the government's general policy bias in favour of rapid economic growth rather than price stability, there is a risk that if the pace of growth does not pick up in the coming quarters (growth fell to 5.4% in the first quarter of 2011) that the authorities will again loosen policy. Fiscal policy Although there is a need for the government to rein in the fiscal deficit—to cool the economy and to avoid financing problems (outstanding public debt is esti- mated to have reached nearly 57% of annual GDP at end-2010)—it will struggle to narrow the deficit during the forecast period. The government recently revealed that it would cut planned investment spending this year by D50trn (US$2.4bn), or around 7.4% of the original total budget for the year. If it is implemented, the measure would help to lower the deficit, but it could yet prove difficult to administer such cuts in expenditure. Nevertheless, the govern- ment is still expected to record a lower deficit this year than in 2010, as high crude oil prices will boost official revenue (the authorities derive substantial tax revenue and royalties from the oil and gas sector). The Economist Intelligence Unit therefore expects the budget deficit to narrow to 4.8% of GDP this year, from an estimated 5.5% in 2010 and 7% in 2009. Government revenue will continue to be supported to some extent by strong economic growth in the remainder of the forecast period, and global prices for crude oil will remain relatively high. However, heavy spending on infrastructure and social welfare programmes will keep the budget deficit at above 5% of GDP in 2012-15. Monetary policy The SBV has taken aggressive steps to tighten monetary policy in recent months, pushing up its policy rates by up to 6 percentage points since November 2010. However, the SBV is not operationally independent, and it will be under pres- Country Report May 2011 www.eiu.com © The Economist Intelligence Unit Limited 2011
  • 9. Vietnam 7 sure to ensure that the rising cost of financing does not undermine economic growth. The policy tools available to the central bank include a mix of both direct and indirect instruments. In the past few months the SBV has increased its refinance and discount rates in an attempt to slow the expansion of credit. However, the official target for domestic credit growth this year has only been revised down slightly from a limit of 23% to 20%. Although in March 2011 the central bank warned that it would double reserve requirements for banks that fail to reduce the ratio of lending to non-productive activities (as a percentage of total lending), to below 16% by the end of the year, the measures that have been taken so far are unlikely to be sufficient to cool an overheated economy. We therefore expect the authorities to have to tighten policy further this year. Economic forecast International assumptions 2010 2011 2012 2013 2014 2015 Economic growth (%) US GDP 2.9 2.9 2.5 2.6 2.6 2.7 OECD GDP 2.9 2.5 2.3 2.4 2.4 2.2 World GDP 3.8 3.2 3.2 3.2 3.2 3.2 World trade 12.5 7.0 6.0 6.1 6.1 5.7 Inflation indicators (% unless otherwise indicated) US CPI 1.6 2.3 2.1 2.5 2.8 2.8 OECD CPI 1.4 2.0 1.8 2.0 2.1 2.3 Manufactures (measured in US$) 3.4 5.1 -0.1 -0.1 1.2 2.3 Oil (Brent; US$/b) 79.6 101.0 85.0 78.3 75.5 76.0 Non-oil commodities (measured in US$) 24.3 29.2 -11.5 -5.9 -3.0 -0.3 Financial variables US$ 3-month commercial paper rate (av; %) 0.3 0.3 0.7 1.5 2.7 2.8 ¥ 3-month money market rate (av; %) 0.4 0.2 0.4 0.6 1.4 2.0 ¥:US$ (av) 87.88 81.75 81.00 81.00 82.13 83.50 Economic growth The recent sharp increases in interest rates and the acceleration in inflation will weaken private consumption and investment growth, and we have therefore revised down slightly our forecast for real GDP growth this year, to 6.4%, from 6.8% previously. However, assuming that officials manage to tighten policy further and have some success in cooling the economy without severely under- mining growth momentum, we expect economic expansion to return to an average annual rate of 7-7.5% in 2012-15. Although global economic growth will slow in 2011, demand for Vietnamese goods is likely to hold up, and the manu- facturing sector is expected to ramp up production. This will require more workers, and thus keep unemployment fairly low. In addition, remittances from overseas Vietnamese will remain high, providing an important boost to private consumption. As demand for exports remains strong, investment in the form of purchases of capital goods for the manufacturing sector will pick up. Despite concerns about the quality of Vietnam's business environment and a recent downturn in planned foreign-invested projects, foreign investor interest remains strong. Demand for Vietnamese goods—particularly in the US, China and Europe—will remain strong, but import expansion will also be significant, and net exports will consequently act as a drag on real GDP growth from 2013. Country Report May 2011 www.eiu.com © The Economist Intelligence Unit Limited 2011
  • 10. 8 Vietnam There are still some major downside risks to this growth outlook. On the domestic front, the government still has much to do in terms of stabilising the economy and rebuilding consumer and investor confidence. In part owing to a surge in inflation and a wide current-account deficit, confidence in the dong has diminished, and there is increased demand for safe havens in the form of US dollars and gold. On the international front, there is a risk that the global economic recovery will be weaker than we currently expect. Not only would this damage exports, but it would also have a knock-on effect on consumer and business spending in Vietnam, thereby inhibiting economic growth. Given the precarious nature of the country's foreign exchange reserves—as indicated by the difficulty that the SBV has had in managing the level of the dong:US dollar exchange rate—there is cause for concern over the country's ability to finance a widening trade deficit. Citing concerns over an external payments crisis, partly owing to the sharp fall in Vietnam's reserves in the past year or so, international credit-ratings agencies have downgraded Vietnam’s sovereign debt rating, citing concerns over contradictory economic policymaking. Such downgrades and growing concerns over economic stability and the country's diminished inter- national reserves has raised speculation that a support package from the IMF may be needed. Economic growth % 2010 a 2011 b 2012 b 2013 b 2014 b 2015 b GDP 6.8 c 6.4 7.0 7.1 7.3 7.2 Private consumption 7.0 2.9 5.8 7.1 7.5 7.5 Government consumption 8.0 7.8 7.8 7.7 7.0 7.0 Gross fixed investment 8.5 5.1 7.2 8.2 9.1 9.0 Exports of goods & services 15.2 13.4 13.6 12.4 12.2 12.5 Imports of goods & services 17.2 9.7 10.2 11.4 11.8 12.6 Domestic demand 9.0 3.7 4.8 7.3 7.8 7.8 Agriculture 2.8 c 3.5 3.4 3.2 3.1 3.3 Industry 7.7 c 7.0 8.0 9.0 9.0 9.0 Services 7.5 c 7.0 7.3 6.7 7.0 6.7 a Economist Intelligence Unit estimates. b Economist Intelligence Unit forecasts. c Actual. Inflation Consumer price inflation is forecast to accelerate to 16.9% in 2011, from 9% in 2010, before slowing to an average rate of 8% a year in 2012-15. The acce- leration this year partly reflects supply-side pressures stemming from rising international commodity prices. We expect crude oil prices (dated Brent Blend) to rise by nearly 27% this year and global food prices to rise by 29%. However, global commodity prices will fall in 2012, and are expected to remain relatively stable in 2013-15, and this will help to calm supply-side price pressures. But with the authorities yet to succeed in anchoring inflation expectations, annual price increases will remain high. The continued depreciation of the dong against the US dollar in 2011-15 will also serve to make imports more expensive. Exchange rates Maintaining stability in the exchange rate between the dong and the US dollar will remain a challenge for policymakers in the next two years, and we forecast that the dong will depreciate by an annual average of 8% a year in 2011-12, before depreciating by around 2% a year in 2013-15. In the face of strong downward pressure on the dong, the SBV has devalued the currency on four Country Report May 2011 www.eiu.com © The Economist Intelligence Unit Limited 2011
  • 11. Vietnam 9 occasions since November 2009, most recently in February 2011. The devalua- tions have resulted in a cumulative drop of almost 14% in the currency's value against the US dollar. Further such measures are likely to be necessary in the coming years as the dong will remain under pressure until there are clear signs that the trade deficit is narrowing and inflationary pressures are receding. Moreover, Vietnam's meagre foreign-exchange reserves mean that the SBV will not be able to stem any downward pressure by intervening in the currency markets. According to the latest available figures from the IMF, foreign-exchange reserves stood at US$14.1bn (equivalent to around eight weeks of imports) in October 2010, down from a high of US$26.4bn in March 2008. Recent media reports have quoted a government minister as saying that reserves stood at over US$10bn in December 2010, although the exact level was not specified. External sector The current account will stay in deficit during the next five years, averaging the equivalent of 5.3% of GDP a year. Despite a recovery in exports, imports will rise in line with strong growth in consumption and investment, and this means that the merchandise trade deficit will remain wide. In addition to the deficit on the merchandise trade account, the services and income accounts will also stay in the red throughout 2011-15. Tourism receipts are expected to rise steadily in the forecast period, boosting services exports. However, Vietnam will remain reliant on a host of imported services, and there will be particularly strong growth in payments for trade-related services. Outflows on the income account will rise in line with the repatriation of profits by the growing number of foreign-invested enterprises in the country. But the combined deficit on the services and income accounts will continue to be offset by a large surplus on the current transfers account. Capital and financial inflows (including official foreign borrowing) will increase from the low levels that they reached in 2009. The country's international reserves position will therefore improve over the forecast period, having deteriorated in 2009 and early 2010. Forecast summary (% unless otherwise indicated) 2010 a 2011 b 2012 b 2013 b 2014 b 2015 b Real GDP growth 6.8 6.4 7.0 7.1 7.3 7.2 Industrial production growth 14.0 14.0 15.5 15.5 15.0 15.0 Gross agricultural production growth 2.8 3.5 3.4 3.2 3.1 3.3 Consumer price inflation (av) 9.0 16.9 10.4 7.9 7.5 6.1 Consumer price inflation (end-period) 11.8 15.9 8.2 7.8 7.5 6.2 Lending rate 13.1 c 19.0 18.0 12.0 11.5 11.5 Government balance (% of GDP) -5.5 -4.8 -5.3 -5.1 -5.0 -5.4 Exports of goods fob (US$ bn) 71.9 c 90.3 96.3 108.2 123.2 142.6 Imports of goods fob (US$ bn) 79.5 c 98.5 105.9 119.9 136.5 156.1 Current-account balance (US$ bn) -5.6 c -6.1 -6.2 -7.3 -7.6 -7.3 Current-account balance (% of GDP) -5.4 c -5.6 -5.3 -5.7 -5.3 -4.5 External debt (end-period; US$ bn) 31.1 c 34.6 37.2 40.6 44.9 50.1 Exchange rate D:US$ (av) 19,127 21,108 22,620 23,121 23,581 24,082 Exchange rate D:US$ (end-period) 19,498 21,864 22,867 23,351 23,832 24,333 Exchange rate D:¥100 (av) 21,677 24,055 26,075 26,885 27,420 28,215 Exchange rate D:€ (end-period) 23,982 25,253 26,182 26,620 27,256 27,997 a Actual. b Economist Intelligence Unit forecasts. c Economist Intelligence Unit estimates. Country Report May 2011 www.eiu.com © The Economist Intelligence Unit Limited 2011
  • 12. 10 Vietnam Monthly review: May 2011 The political scene The CPV is growing ever The recent surge in inflation remains a political and an economic problem for fearful of vocal opponents Vietnam’s leadership. Given that the rate of inflation accelerated to 17.5% year on year in April, the ruling Communist Party of Vietnam (CPV) is growing concerned about the possibility that rapidly rising prices and a weak currency will trigger social unrest. These fears appear to have been further exacerbated by the continuing wave of social unrest in some countries with authoritarian regimes in the Middle East and North Africa. The authorities have therefore adopted something of an "arrest first, ask questions later" policy to stamp out the threat of political dissent. There have also been some high-profile legal cases against dissidents in recent months, with the most recent prominent legal action being the trial of Cu Huy Ha Vu, the son of one of Vietnam’s best- known revolutionaries, Cu Huy Can, a close associate of the country's founding president, Ho Chi Minh, and who served in the first government after Vietnam’s revolutionaries declared independence from France in 1945. In early April Mr Vu was sentenced to seven years in prison having been found guilty of demanding an end to one-party Communist rule, a charge he denied. The presiding judge in the case, Nguyen Huu Chinh, ruled that the defendant's behaviour had been harmful to society. Mr Vu initially rose to prominence after filing a lawsuit against the prime minister, Nguyen Tan Dung, for encouraging Chinese firms to mine for bauxite in Vietnam’s pristine Central Highlands region. Environmental activists and Vietnamese nationalists took exception to the mining deal because of the potential ecological damage inflicted by mining for the ore and also because the deal involves Chinese companies. Legal officials dropped Mr Vu’s complaint and then blocked a subsequent lawsuit against Mr Dung for allegedly preventing the filing of class action lawsuits. Officials also appear to be growing more aware of Western criticism of their heavy-handed approach to dealing with dissidents. Mr Vu is just one of several dissidents to have been both arrested and convicted in the past few months, worsening Vietnam’s reputation among international human-rights advocates and potentially complicating the pursuit of regional free-trade discussions that include the US. However, a small number of convicted dissidents have seen their sentences reduced recently. The sentence given to a former member of the CPV, Vi Duc Hoi, for allegedly calling for multiparty democracy was cut from eight years to five years after an appeal hearing in Lang Son province, north of the capital, Hanoi. Mr Hoi helped to school top leaders during his time with the CPV but was later expelled from the party for advocating democratic reforms. Meanwhile, two prominent government critics, Le Quoc Quan and Pham Hong Son, were recently released after being arrested outside the court building where the trial of Mr Vu was under way in Hanoi. Initially picked up by police for public-order offences, the critics were released without charge. They could soon find themselves in trouble again, however, as they have said that they are considering taking legal action against police authorities for wrongful detention. Country Report May 2011 www.eiu.com © The Economist Intelligence Unit Limited 2011
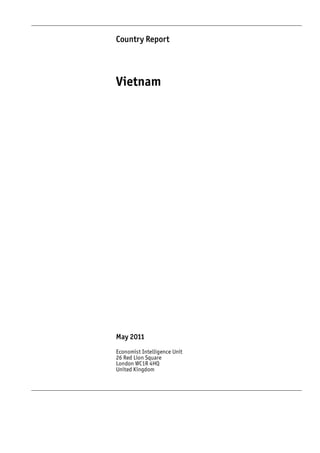
  • 13. Vietnam 11 Laos's plans for a dam on the Vietnam appears to be fighting a losing battle to prevent the construction of Mekong raises tensions the US$3.5bn Xayaburi hydropower dam project in Laos, which could further disrupt the flow of water into the fertile flood plains of the Mekong delta in southern Vietnam. Salinisation is already affecting the densely populated area, reducing the stock of freshwater fish and inflicting damage on rice-growing land. Environmentalists warn of a major shock to the food security of the entire region if the project goes ahead, affecting not just the millions of people who live in the Mekong delta, but potentially reducing the supply of rice to the global market, too. Some enterprising farmers have switched to farming shrimp instead, but Vietnamese officials have been pressing hard to limit the number of dams on the Mekong, which flows through China, Myanmar, Thailand, Laos and Cambodia before exiting the South China Sea through Vietnam. The government fears that if the project goes ahead, it will set a dangerous prece- dent for more hydropower projects along the river, especially in Laos, which aspires to use hydropower generation to become "the battery of South-east Asia" and kick-start its poverty-stricken economy. Vietnam’s stated goal is a ten-year moratorium on the construction of new dams along the Mekong. The Vietnamese authorities have tried to exert considerable pressure on the Communist-run government in Laos, which is normally fairly pliant when it comes to matters affecting the national interest of Vietnam. But the valuable export market in power-hungry Thailand appears too much for the Lao govern- ment to resist. Laos, Thailand, Cambodia and Vietnam held a meeting on the matter in Laos on April 19th at which Vietnam hoped to negotiate some way to stop the Xayaburi dam from going ahead. The government has won some support in the US Congress (that country's legislature), with a US senator, Jim Webb, recently arguing that the project be suspended until the full environmental impact of building dams on the Mekong is better understood. The four countries in the lower Mekong region failed to agree a common stand on the controversy, saying that the discussions would continue at a ministerial level. None of the four countries are able to veto any proposed projects. In the meantime, construction of the 1,285-mw dam continues, with a Thai contractor, Ch Karnchang, stating that it expects to sign a contract to complete construction of the dam, which is expected to begin generating electricity in 2019. There are also plans to build another ten dams along the Mekong, mostly in Laos and Cambodia, in addition to the existing four in the upper reaches of the river in China. Environmental activists say that the Chinese dams have already dis- rupted water flows downstream, contributing to a significant drought in 2010, which saw water levels in the Mekong dwindle to levels not seen in 50 years. Economic policy The SBV tightens policy Vietnam's policymakers are now engaged in a scramble to contain domestic further, raising rates again inflation without choking off credit to small- and medium-sized businesses (SMEs) that form the backbone of the local economy. It is a difficult balancing act. The rate of inflation hit 17.5% year on year in April—the highest rate since December 2008. Inflationary expectations remain a significant obstacle to the Country Report May 2011 www.eiu.com © The Economist Intelligence Unit Limited 2011
  • 14. 12 Vietnam government's efforts to control the situation, with signs that inflation will sur- pass 20% in the coming months. The authorities have been using a variety of measures to slow credit growth and increase lending rates in order to help ease inflation. The State Bank of Vietnam (SBV, the central bank) raised the refinance rate by 100 basis points at the beginning of April and also in early May, to reach 14%, and there were further increases of 100 basis points in both the reverse repurchase (repo) rate (to 14%) and the discount rate (to 13%), taking effect in early May. Lending rates, meanwhile, are standing at around the 19-20% level for small businesses—high enough to make many of them scale back expansion plans and deter others from setting up new ventures. To help them, the govern- ment has announced that it will defer this year’s corporate tax payments for SMEs until 2012. The corporate tax rate is 25%, and the measure applies to firms with fewer than 300 employees or with capital of less than D100bn (US$4.8m). However, the catch is that companies engaged in real estate, banking, stock trading and providing financial services such as insurance will not be included. Policy interest rates (%, end-period) Discount rate Refinance rate 16.0 14.0 12.0 10.0 8.0 6.0 4.0 Jan Mar May Jul Sep Nov Jan Mar May Jul Sep Nov Jan Mar May Jul Sep Nov Jan Mar May 2008 09 10 11 Source: State Bank of Vietnam. Taken as a whole, the latest series of interest rate rises provide further evidence that Vietnam’s leaders are taking the country’s inflationary problems seriously. Increasing prices were a major topic of discussion during the CPV's national congress in January, which is held every five years and sets economic policy for the next five years. Although the party's leaders maintained their view that Vietnam needs to maximise its economic growth potential by encouraging private and state-run businesses to expand, they also placed an increasing em- phasis on doing so without jeopardising the country’s fragile economic balance by triggering an upsurge in inflation. In particular, they fear that quickly rising prices could trigger unpredictable social consequences that could undermine the authority of the CPV; Vietnam already has some experience of this. In 2008, as monthly inflation rates rose, to peak at 28%, a series of strikes rippled around the major industrial zones in Ho Chi Minh City in the south and Hanoi. In some cases, workers who returned to their home provinces to celebrate the Lunar New Year holiday did not return to work because their wages (in real terms) had been so badly eroded. Vietnam’s leaders struggled to get a firm grip on the problem of accelerating inflation in 2007-08 and arguably only managed to avoid a worse situation at the time owing to the onset of the 2008-09 global financial crisis, which tem- Country Report May 2011 www.eiu.com © The Economist Intelligence Unit Limited 2011
  • 15. Vietnam 13 pered the cost of imported products, especially refined oil. A subsequent burst of inflation in 2010 was only partially contained; the government eased off on its monetary tightening when the threat appeared to have subsided in the middle of that year, only to see prices track upwards again. By the time the CPV met in January, inflation had already returned to double-digit growth and the government was also preparing to let fuel and electricity prices rise sharply, as the cost of subsidising them was becoming too onerous. Economic performance Growth in industrial output Although the pace of year-on-year economic growth slowed to 5.4% in the first and exports is strong quarter, industrial output growth remains strong. In January-April industrial output grew by 14.2% year on year—the same pace of growth recorded in 2010 as a whole. Output by private firms and foreign-invested enterprises rose by nearly 17%, offsetting sluggish growth of 5% by the state-owned sector. Output of garments rose by 17.6% year on year, while footwear output grew by 17%. The electrical appliances and white-goods sectors recorded a mixed performance, with production of air-conditioners falling by nearly 7%, refrigerators by 22% and televisions by 1%, while output of washing machines grew by nearly 25%. Meanwhile, the number of motorcycles produced rose by 9% year on year in January-April. On the expenditure side, the latest data on consumption and investment indi- cators suggest that the pace of expansion is slowing. According to figures from the General Statistics Office (GSO), total retail sales of consumer goods and services jumped by 22.7% year on year in nominal terms in January-April, with the GSO stating that in real terms sales growth was at 7.7%. In 2010 as a whole the GSO put retail sales growth in real terms at 14%. Meanwhile, macro- economic uncertainty appears to be deterring some investment. While foreign direct investment inflows remained largely unchanged on a year-on-year basis, at US$3.6bn in the first four months of 2011, applications for fresh investment and new capital for existing projects fell by 48% in the first four months of the year, to just over US$4bn. The government had earlier projected that new pledges for 2011 as a whole would reach US$20bn, up from 16% in 2010. The recovery in the global economy, however, has ensured that demand for Vietnam's merchandise exports has stayed high. In April export revenue rose by 36.9% year on year, to US$7.3bn, and in the first four months of the year revenue had increased by 35.7%, to US$26.9bn. Exports of textiles grew by 33% year on year in January-April, to reach US$3.9bn, while footwear exports rose by 26%, to reach US$1.7bn. Exports of most other manufactured goods posted healthy growth during the four-month period, notably electronics and computers, which grew by 11%, to US$1.1bn, and machinery, tools and spare parts, which grew by 23.7%, to reach US$1.1bn. Commodity exports also performed well, with revenue driven up by high global prices. The value of coffee exports, for example, more than doubled on a year-on-year basis in the period, to US$1.4bn, while volume was up by 37%. Crude oil exports also grew on a year-on-year basis, rising by 41% to US$2.5bn, with volume rising by just 2.5%. Country Report May 2011 www.eiu.com © The Economist Intelligence Unit Limited 2011
  • 16. 14 Vietnam Concerns persist over the wide Although the pace of growth in export revenue has been impressive, the import trade deficit and high inflation bill continues to increase at a fast pace, rising by 29% year on year in the first four months of 2011, to US$31.8bn. Owing to both rising prices and higher import volume, the bill for imported petroleum products reached US$3.6bn in the period, representing a year-on-year increase of 64%. Steel imports rose by 17% to US$2bn, while machinery and equipment imports, the largest import group, were up by 17% in the period, to US$4.7bn. The bill for imports of electronics, computers and spare parts grew by 29% on a year-on-year basis, to US$1.8bn. Vietnam’s merchandise trade deficit stayed at around US$1.4bn in April, practically unchanged from the revised level for March, pushing the total for January-April to US$4.8bn, up from US$4.5bn in the year-earlier period. In addition to the widening trade deficit, concerns over the state of the economy continue to be driven by the acceleration in inflation. The GSO has stated that the sharp rise in fuel prices at the beginning of March was the major contributing factor behind the acceleration in inflation in April, but food prices have also soared. In the breakdown of the consumer price index, prices for grains rose by 22.7% year on year and prices for other foodstuffs rose by 26.6%. Prices for drinks and cigarettes rose by 11.5%, while prices for clothing and footwear increased by 11.3% and housing and construction materials by 19%. Meanwhile, transport costs jumped by 16%, and education soared by 24.5%. Country Report May 2011 www.eiu.com © The Economist Intelligence Unit Limited 2011
  • 17. Vietnam 15 Data and charts Annual data and forecast Pl ea se se e g ra p hi c b el ow 2006 a 2007 a 2008 a 2009 a 2010 b 2011 c 2012 c GDP Nominal GDP (US$ bn) 61.0 71.1 90.3 93.2 103.6 a 109.3 116.1 Nominal GDP (D trn) 974.3 1,143.7 1,485.0 1,658.4 1,981.7 a 2,306.3 2,625.2 Real GDP growth (%) 8.2 8.5 6.3 5.3 6.8 a 6.4 7.0 Expenditure on GDP (% real change) Private consumption 8.3 10.8 9.3 3.7 7.0 2.9 5.8 Government consumption 8.5 8.9 7.5 7.6 8.0 7.8 7.8 Gross fixed investment 9.9 24.2 3.8 8.7 8.5 5.1 7.2 Exports of goods & services 17.7 b 16.0 b 15.1 b -6.0 b 15.2 13.4 13.6 Imports of goods & services 18.9 b 28.2 b 15.4 b -6.3 b 17.2 9.7 10.2 Origin of GDP (% real change) Agriculture 3.4 3.7 4.4 2.4 2.8 a 3.5 3.4 Industry 10.4 10.6 5.7 5.4 7.7 a 7.0 8.0 Services 8.3 8.7 7.3 6.8 7.5 a 7.0 7.3 Population and income Population (m) 84.4 b 85.3 b 86.1 b 87.0 b 87.8 88.7 89.5 GDP per head (US$ at PPP) 2,358 b 2,606 b 2,803 b 2,950 b 3,150 3,371 3,667 Recorded unemployment (av; %) 4.8 4.6 4.7 4.6 4.4 a 4.1 4.1 Fiscal indicators (% of GDP) Central government balance -2.9 -7.3 -5.2 -7.0 -5.5 a -4.8 -5.3 Net public debt 42.9 b 45.6 b 43.9 b 49.8 b 57.1 56.0 55.4 Prices and financial indicators Exchange rate D:US$ (end-period) 16,055 16,010 17,433 18,472 19,498 a 21,864 22,867 Exchange rate D:€ (end-period) 21,188 23,379 24,234 26,474 26,478 a 28,861 29,041 Consumer prices (end-period; %) 6.6 12.6 20.0 6.5 11.8 a 15.9 8.2 Stock of money M1 (% change) 20.7 48.9 -0.4 30.4 1.8 11.2 12.3 Stock of money M2 (% change) 29.7 49.1 20.7 26.2 25.5 22.1 16.7 Lending interest rate (av; %) 11.2 11.2 15.8 10.1 13.1 19.0 18.0 Current account (US$ m) Trade balance -2,776 -10,438 -12,782 -8,307 -7,655 -8,198 -9,521 Goods: exports fob 39,826 48,561 62,685 57,096 71,893 90,334 96,350 Goods: imports fob -42,602 -58,999 -75,467 -65,403 -79,548 -98,531 -105,870 Services balance -8 -755 -915 -1,230 -966 -1,375 -974 Income balance -1,429 -2,190 -4,401 -3,028 -4,587 -4,652 -5,161 Current transfers balance 4,049 6,430 7,311 6,448 7,585 8,103 9,477 Current-account balance -164 -6,953 -10,787 -6,117 -5,623 -6,121 -6,178 External debt (US$ m) Debt stock 20,126 23,865 26,158 27,366 b 31,123 34,640 37,230 Debt service paid 949 1,249 1,344 1,114 b 1,210 1,392 1,530 Principal repayments 495 640 776 710 b 739 793 824 Interest 454 609 568 404 b 471 599 706 International reserves (US$ m) Total international reserves 13,591 23,748 24,176 16,803 13,280 15,730 15,989 a Actual. b Economist Intelligence Unit estimates. c Economist Intelligence Unit forecasts. Source: IMF, International Financial Statistics. Country Report May 2011 www.eiu.com © The Economist Intelligence Unit Limited 2011
  • 18. 16 Vietnam Quarterly data Pl ea se se e g ra p hi c b el ow 2009 2010 2011 2 Qtr 3 Qtr 4 Qtr 1 Qtr 2 Qtr 3 Qtr 4 Qtr 1 Qtr Prices Consumer prices (2005=100) 151.5 153.6 156.2 162.6 165.1 166.6 173.2 183.4 Consumer prices (% change, year on year) 6.2 2.6 4.6 7.5 9.0 8.4 10.8 12.8 Financial indicators Exchange rate D:US$ (av) 17,785 17,820 18,094 18,742 18,993 19,278 19,495 20,234 Exchange rate D:US$ (end-period) 17,801 17,841 18,472 19,080 19,065 19,485 19,498 20,908 Deposit rate (av; %) 7.3 7.9 9.5 10.3 11.1 n/a n/a n/a Lending rate (av; %) 9.6 10.2 11.0 12.0 13.4 n/a n/a n/a Refinancing rate (end-period; %) 7.0 7.0 8.0 8.0 8.0 8.0 8.7 10.7 Treasury bill rate (av; %) 7.6 8.4 9.4 11.2 n/a n/a n/a n/a M1 (end-period; D trn) 507.8 515.5 565.2 520.5 548.3 563.5 n/a n/a M1 (% change, year on year) 48.5 60.2 30.4 12.6 8.0 9.3 n/a n/a M2 (end-period; D trn) 1,776.0 1,842.3 1,910.6 1,982.4 2,166.6 2,325.0 n/a n/a M2 (% change, year on year) 37.1 36.7 26.2 20.5 22.0 26.2 n/a n/a Foreign trade (US$ m) Exports fob 13,572 14,026 15,214 14,345 17,961 18,984 20,366 19,386 Imports cif -17,416 -18,813 -20,865 -17,775 -20,736 -21,232 -24,037 -22,784 Trade balance -3,844 -4,787 -5,651 -3,430 -2,775 -2,248 -3,671 -3,398 Foreign payments (US$ m) Merchandise trade balance -2653.0 -3654.0 -4328.0 -2239.0 -1535.0 -733.0 n/a n/a Services balance -28 -498 -472 -149 -103 -354 n/a n/a Income balance -846 -575 -621 -1,430 -763 -1,034 n/a n/a Net transfer payments 1,561 1,618 1,721 2,051 1,835 2,170 n/a n/a Current-account balance -1,966 -3,109 -3,700 -1,767 -566 49 n/a n/a Reserves excl gold (end-period) 20,260 18,769 16,447 13,854 14,121 14,111 n/a n/a Sources: IMF, International Financial Statistics. Country Report May 2011 www.eiu.com © The Economist Intelligence Unit Limited 2011
  • 19. Vietnam 17 Monthly data Pl ea se se e g ra p hi c b el ow Jan Feb Mar Apr May Jun Jul Aug Sep Oct Nov Dec Exchange rate D:US$ (av) 2009 17,463 17,482 17,553 17,776 17,785 17,796 17,809 17,816 17,834 17,852 17,960 18,472 2010 18,472 18,679 19,077 19,011 18,987 18,981 19,086 19,262 19,485 19,491 19,498 19,498 2011 19,498 20,329 20,877 20,845 n/a n/a n/a n/a n/a n/a n/a n/a Exchange rate D:US$ (end-period) 2009 17,475 17,475 17,756 17,784 17,784 17,801 17,815 17,823 17,841 17,862 18,485 18,472 2010 18,472 18,925 19,080 18,960 18,980 19,065 19,095 19,485 19,485 19,495 19,498 19,498 2011 19,498 20,875 20,908 20,625 n/a n/a n/a n/a n/a n/a n/a n/a Money supply M1 (% change, year on year) 2009 -3.8 5.2 16.7 27.1 34.7 48.5 54.9 58.4 60.2 59.2 57.5 30.4 2010 22.8 23.8 12.6 7.7 8.4 8.0 8.1 9.6 9.3 9.0 n/a n/a 2011 n/a n/a n/a n/a n/a n/a n/a n/a n/a n/a n/a n/a Money supply M2 (% change, year on year) 2009 20.8 24.1 26.5 32.5 33.9 37.1 38.5 38.6 36.7 36.5 35.1 26.2 2010 22.5 22.6 20.5 19.4 19.5 22.0 20.7 25.0 26.2 25.4 n/a n/a 2011 n/a n/a n/a n/a n/a n/a n/a n/a n/a n/a n/a n/a Deposit rate (av; %) 2009 7.0 6.5 7.1 7.2 7.3 7.5 7.6 8.0 8.1 8.4 10.0 10.2 2010 10.2 10.2 10.3 11.0 11.2 11.2 11.1 11.1 n/a n/a n/a n/a 2011 n/a n/a n/a n/a n/a n/a n/a n/a n/a n/a n/a n/a Lending rate (av; %) 2009 10.1 9.4 9.2 9.2 9.6 10.0 10.0 10.3 10.4 10.5 10.5 12.0 2010 12.0 12.0 12.0 13.9 13.2 13.2 13.3 13.0 n/a n/a n/a n/a 2011 n/a n/a n/a n/a n/a n/a n/a n/a n/a n/a n/a n/a Consumer prices (av; % change, year on year) 2009 19.4 15.5 12.0 9.2 5.6 3.9 3.3 2.0 2.4 3.0 4.3 6.5 2010 5.9 7.8 8.7 9.2 9.0 8.7 8.2 8.2 8.9 9.7 11.1 11.8 2011 12.2 12.3 13.9 17.5 n/a n/a n/a n/a n/a n/a n/a n/a Goods exports fob (US$ m) 2009 3,842 5,097 5,346 4,287 4,454 4,831 4,825 4,639 4,562 5,043 4,704 5,467 2010 5,013 3,740 5,592 5,332 6,312 6,317 6,029 6,857 6,098 6,227 6,450 7,498 2011 7,091 4,848 7,447 7,300 n/a n/a n/a n/a n/a n/a n/a n/a Goods imports cif (US$ m) 2009 3,456 4,257 5,141 5,600 5,796 6,020 6,415 5,982 6,416 6,664 6,806 7,395 2010 5,958 5,070 6,747 6,494 7,183 7,059 7,007 7,252 6,973 7,304 7,700 8,792 2011 7,968 5,960 8,856 8,700 n/a n/a n/a n/a n/a n/a n/a n/a Trade balance fob-cif (US$ m) 2009 386 840 205 -1,313 -1,342 -1,189 -1,590 -1,343 -1,854 -1,621 -2,102 -1,928 2010 -945 -1,330 -1,155 -1,162 -871 -742 -978 -395 -875 -1,077 -1,250 -1,294 2011 -877 -1,112 -1,409 -1,400 n/a n/a n/a n/a n/a n/a n/a n/a Foreign-exchange reserves excl gold (US$ m) 2009 22,830 22,653 23,008 20,931 20,790 20,260 19,072 18,802 18,769 18,320 17,400 16,447 2010 15,735 15,492 13,854 14,332 13,936 14,121 13,917 13,727 14,111 14,098 n/a n/a 2011 n/a n/a n/a n/a n/a n/a n/a n/a n/a n/a n/a n/a Sources: IMF, International Financial Statistics; Haver Analytics. Country Report May 2011 www.eiu.com © The Economist Intelligence Unit Limited 2011
  • 20. 18 Vietnam Annual trends charts Pl ea se se e g ra p hi c b el ow Annual trends charts Real GDP growth Consumer price inflation (% change) (av; %) Vietnam Asia (excl Japan) World Vietnam Asia (excl Japan) World 10.0 25.0 8.0 20.0 6.0 4.0 15.0 2.0 10.0 0.0 5.0 -2.0 -4.0 0.0 2006 07 08 09 10 11 12 2006 07 08 09 10 11 12 Source: Economist Intelligence Unit. Source: Economist Intelligence Unit. GDP per head Trade balance (US$; PPP) (% of GDP) Vietnam Asia (excl Japan) World Vietnam Asia (excl Japan) 14,000 8.0 12,000 4.0 10,000 0.0 8,000 -4.0 6,000 -8.0 4,000 2,000 -12.0 0 -16.0 2006 07 08 09 10 11 12 2006 07 08 09 10 11 12 Source: Economist Intelligence Unit. Source: Economist Intelligence Unit. Main exports, 2009 Main imports, 2009 (% of total) (% of total) Others Garments Others Machinery & 41.4 16.0 49.6 equipment 17.6 Crude oil 10.9 Petroleum 8.9 Fisheries 7.5 Steel 7.7 Footwear 7.2 Fabrics 6.1 Coffee Electronics & Electronics & 3.0 computers computers 4.8 5.7 Wood products Rice Vehicles 4.5 4.6 4.4 Source: Economist Intelligence Unit. Source: Economist Intelligence Unit. Country Report May 2011 www.eiu.com © The Economist Intelligence Unit Limited 2011