SlideShare uma empresa Scribd logo
1 de 18
Baixar para ler offline
M. Pandey, University of Waterloo                                                           CIVE 240 – Engineering and Sustainable Development


Fault Tree Analysis


Table of Contents
Introduction ............................................................................................................... 3
Fault Tree Analysis ................................................................................................... 3
  Basic Events ............................................................................................................ 4
  Advantages ............................................................................................................. 4
  Limitations .............................................................................................................. 4
  Notation................................................................................................................... 5
  General Procedure for Fault Tree Analysis........................................................ 6
  Rules of Fault Tree Construction ......................................................................... 7
  Considerations...................................................................................................... 11
Fault Tree Evaluation ............................................................................................. 12
  Boolean Algebra ................................................................................................... 12
    The OR Gate ....................................................................................................... 12
    The AND Gate.................................................................................................... 12
  Qualitative Analysis ............................................................................................ 14
    Minimal Cut Sets ............................................................................................... 14
    Criticality............................................................................................................ 14
  Quantitative Analysis.......................................................................................... 16
    Common-Cause Failures..................................................................................... 16
References................................................................................................................. 18


                                                                                                                        Fault Tree Analysis – Page 1
CIVE 240 – Engineering and Sustainable Development   M. Pandey, University of Waterloo


 Fault Tree Analysis – Page 2
M. Pandey, University of Waterloo                            CIVE 240 – Engineering and Sustainable Development


Introduction
    there is a need to analyze all the possible failure mechanisms in complex
    systems (e.g. nuclear power plants)
    also perform probabilistic analyses for the expected rate of failures
    estimate probabilities of events that are modelled as logical combinations
    or logical outcomes of other random events
    two main methods:
        fault tree analysis
        event tree analysis
    decision trees also exist and are used in risk analysis (combines all
    feasible alternatives, possible outcomes and their probabilities, monetary
    consequences and utility evaluations)
    other graphical methods include
        reliability block diagrams
        functional logic diagrams
        Failure Modes and Effects Analysis (FMEA)

Fault Tree Analysis
    A technique by which many events that interact to produce other events can be
                     related using simple logical relationships.

    a good reference is NRC “The Fault Tree Handbook”
    (http://www.nrc.gov/reading-rm/doc-collections/nuregs/staff/sr0492/sr0492.pdf)
    also Chapter 8 and 10 in McCormick (1981)
    one of the principal methods of probabilistic safety (or risk) analysis
    (PRA)
    developed by Bell Telephone Laboratories in 1962 for the U.S. Air Force
    Minuteman system, later adopted and extensively used by Boeing
    Company
    fault tree diagrams
        are used most often as a system-level risk assessment technique
        can model the possible combinations of equipment failures, human
        errors, and external conditions that can lead to a specific type of
        accident
        follow a top-down structure and represent a graphical model of the
        pathways within a system between basic events that can lead to a
        foreseeable loss event (or a failure) referred to as the top event
    the contributory events and conditions are interconnected using standard
    logic symbols (AND, OR, etc.), also referred to as gates
    events that must coexist to cause the top event are described using the
    AND relationship
    alternate events that can individually cause the top event are described
    using the OR relationship


                                                                                    Fault Tree Analysis – Page 3
CIVE 240 – Engineering and Sustainable Development                                  M. Pandey, University of Waterloo


                            the occurrence of a top event may or may not lead to a serious or adverse
                            consequence
                            the relative likelihood of a number of potential consequences will depend
                            on the conditions or subsequent events that follow
                            potential consequences can be systematically identified using an event
                            tree

                       Basic Events

                                             An event that cannot be developed any further.

                            all basic events are generally assumed to be statistically independent
                            unless they are common cause failures (i.e. failures arising from a
                            common cause or an initiating event)
                            basic events can be either
                                primary fault events, i.e. subsystem failure due to a basic mode such as
                                a structural fault, failure to open or close, or to start or stop, or
                                secondary fault events, i.e. subsystem failure due to excessive
                                operational or environmental stress resulting in the system element to
                                be out of tolerance

                       Advantages
                            allow the use of reliable information on component failure and other basic
                            events to estimate the overall risk associated with new system designs for
                            which no historical data exists
                            simple to understand and easy to implement
                            qualitative descriptions of potential problems and combinations of events
                            causing specific problems of interest
                            quantitative estimates of failure frequencies and likelihoods, and relative
                            importances of various failure sequences and contributing events
                            lists of recommendations for reducing risks
                            quantitative evaluations of recommendation effectiveness

                       Limitations
                            difficult to conceive all possible scenarios leading to the top event
                            construction of fault trees for large systems can be tedious
                            correlations between basic events (e.g. failure of components belonging to
                            the same batch) are difficult to model and exact solutions to correlated
                            events do not exist
                            subjective decisions regarding the level of detail and completeness are
                            often necessary


 Fault Tree Analysis – Page 4
M. Pandey, University of Waterloo                               CIVE 240 – Engineering and Sustainable Development


Notation
     Symbol                Name           Description
                                          Primary Event Symbols
                           Circle         Basic Event – a basic initiating fault requiring
                                          no further development

                           Oval           Conditioning Event – specific conditions or
                                          restrictions that apply to any logic gate (used
                                          with INHIBIT gate)
                           Diamond        Undeveloped Event – an event that is not
                                          developed further because it is of insufficient
                                          consequence or because information is
                                          unavailable
                           House          External Event – an event which is normally
                                          expected to occur (not a fault event)


                                          Intermediate Event Symbols
                           Rectangle      A fault event that occurs as a result of the
                                          logical combination of other events


                                          Gate Symbols
                           OR Gate        The union operation of events, i.e. the output
                                          event occurs if (at least) one or more of the
                                          inputs occur
                           AND Gate       The intersection operation of events, i.e. the
                                          output event occurs if and only if all the inputs
                                          occur
                           INHIBIT        The output event occurs if the (single) input
                           Gate           event occurs in the presence of an enabling
                                          condition (i.e. Conditioning Event (oval) drawn
                                          to the right of the gate)
                                          Transfer Symbols
                           Triangle-in    Indicates that the tree is developed further
                                          someplace else (e.g. another page)

                           Triangle-out   Indicates that this portion of the tree is a sub-
                                          tree connected to the corresponding Triangle-In
                                          (appears at the top of the tree)


                                                                                       Fault Tree Analysis – Page 5
CIVE 240 – Engineering and Sustainable Development                              M. Pandey, University of Waterloo


                       General Procedure for Fault Tree Analysis
                            from the U.S. Coast Guard Risk-based Decision-making Guidelines, Vol. 3
                            - Risk Assessment Tools Reference, Chapter 9 – Fault Tree Analysis (FTA)
                            (http://www.uscg.mil/hq/g-m/risk/E-Guidelines/RBDMGuide.htm)

                       Step 1.   Define the system of interest.
                                 Specify and clearly define the boundaries and initial conditions of
                                 the system for which failure information is needed.

                       Step 2.   Define the top event for the analysis.
                                 Specify the problem of interest that the analysis will address
                                 (e.g. a specific quality problem, shutdown, safety issue, etc.).

                       Step 3.   Define the treetop structure.
                                 Determine the events and conditions (i.e., intermediate events) that
                                 most directly lead to the top event.

                       Step 4.   Explore each branch in successive levels of detail.
                                 Determine the events and conditions that most directly lead to each
                                 intermediate event. Repeat the process at each successive level of
                                 the tree until the fault tree model is complete.

                       Step 5.   Solve the fault tree for the combinations of events contributing to
                                 the top event.
                                 Examine the fault tree model to identify all the possible
                                 combinations of events and conditions that can cause the top event
                                 of interest. A combination of events and conditions sufficient and
                                 necessary to cause the top event is called a minimal cut set.

                       Step 6.   Identify important dependent failure potentials and adjust the
                                 model appropriately (qualitative common cause failure analysis).
                                 Study the fault tree model and the list of minimal cut sets to identify
                                 potentially important dependencies among events. Dependencies
                                 are single occurrences that may cause multiple events or conditions
                                 to occur at the same time.

                       Step 7.   Perform quantitative analysis (if necessary).
                                 Use statistical characterizations regarding the failure and repair of
                                 specific events and conditions in the fault tree model to predict
                                 future performance for the system.

                       Step 8.   Use the results in decision making.
                                 Use results of the analysis to identify the most significant
                                 vulnerabilities in the system and to make effective recommendations
                                 for reducing the risks associated with those vulnerabilities.

 Fault Tree Analysis – Page 6
M. Pandey, University of Waterloo                         CIVE 240 – Engineering and Sustainable Development


Rules of Fault Tree Construction
    a fault tree should only be constructed once the functioning of the entire
    system is fully understood
    objective is to identify all the component failures, or combinations thereof
    that could lead to the top event (Steps 2 - 4 above)
    after McCormick (1981)

Rule 1. State the fault event as a fault, including the description and timing of
        a fault condition at some particular time.
        Include
            (a) what the fault state of that system or component is,
            (b) when that system or component is in the fault state.
        Test the fault event by asking
            (c) is it a fault?
            (d) is the what-and-when portion included in the fault statement?

Rule 2. There are two basic types of fault statements, state-of-system and
        state-of-component.
        To continue the tree,
            (a) if state-of-system fault statement, use Rule 3
            (b) if state-of-component fault statement, use Rule 4

Rule 3. A state-of-system fault may use an AND, OR, or INHIBIT gate or no
        gate at all.
        To determine which gate to use, the faults must be then
           (a) minimum necessary and sufficient fault events,
           (b) immediate fault events.

Rule 4. A state-of-component fault always uses an OR gate.
        To continue, look for the primary, secondary, and command failure
        fault events. Then state those fault events.
           (a) primary failure is failure of that component within the design
               envelope or environment
           (b) secondary failures are failures of that component due to
               excessive environments exceeding the design environment
           (c) command faults are inadvertent operation of the component
               because of a failure of a control element

Rule 5. No gate-to-gate relationships.
        Put an event statement between any two gates.

Rule 6. Expect no miracles.
        Those things that would normally occur as the result of a fault will
        occur, and only those things. Also, normal system operation may be
        expected to occur when faults occur.

                                                                                 Fault Tree Analysis – Page 7
CIVE 240 – Engineering and Sustainable Development                            M. Pandey, University of Waterloo


                       Rule 7. In an OR gate, the input does not cause output.
                               If any input exists, the output exists. Fault events under the gate may
                               be a restatement of the output events.

                       Rule 8. An AND gate defines a causal relationship.
                               If the input events coexist, the output is produced.

                       Rule 9. An INHIBIT gate describes a causal relationship between one fault
                               and another, but the indicated condition must be present.
                               The fault is the direct and sole cause of the output when that
                               specified condition is present. Inhibit conditions may be faults or
                               situations, which is why AND and INHIBIT gates differ.


 Fault Tree Analysis – Page 8
M. Pandey, University of Waterloo                              CIVE 240 – Engineering and Sustainable Development


 Example: (McCormick, 1981) Construct a fault tree for the simple electric
 motor circuit shown below.
                                    Switch      Fuse


                    Power
                                                       Motor
                    Supply


                                             Wire


Solution:
Step 1. Define the system of interest.
   Need to identify
       Intended Functions
       Physical Boundaries (to avoid overlooking key elements of a system at
       interfaces and penalizing a system by associating other equipment
       with the subject of the study)
       Analytical Boundaries (to limit the level of analysis resolution, to
       explicitly exclude certain types of events and conditions, such as
       sabotage, from the analysis)
       Initial Conditions, (including equipment that is assumed to be out of
       service initially, which affect the combinations of additional events
       necessary to produce a specific system problem)
    For this particular problem we have,
       Intended Function       – the motor is used for some (unknown)
                                 purpose
       Physical Boundaries     – power supply
       Analytical Boundaries – include all contributors in the above diagram
       Initial Conditions      – switch closed, motor on

Step 2. Define the top event.
    We are interested in the event that the motor fails to operate. Therefore,
    the top event is defined as

         Motor fails
         to operate

Step 3. Construct the fault tree, starting from the top, i.e., define the treetop
   structure. Identify the main contributing events, including all events and
   scenarios that may cause the top event.


                                                                                      Fault Tree Analysis – Page 9
CIVE 240 – Engineering and Sustainable Development                                      M. Pandey, University of Waterloo


                       Step 4. Explore each branch in successive levels of detail, following the rules
                          of fault tree construction.

                                                                        Motor fails
                                                                        to operate


                                                                             1


                                                            Defect                      No current
                                                           in motor                      to motor


                                                                                             2


                                        Switch                             Wire          Fuse fails            Power
                                         open                             failure          open                supply
                                                                          (open)                               failure


                                          3                                                  4


                                                                                                                 Fuse
                            Switch                      Switch                                              failure under
                                                                        Fuse failure
                             fails                     opened                                                   normal
                                                                      due to overload
                             open                    erroneously                                             conditions
                                                                                                                (open)
                                                                                         Fuse fails
                                                                             5
                                                                                           open


                                                                         Overload
                                                                         in circuit


                                                                             6


                                                             Wire                          Power
                                                            failure                        failure
                                                          (shorted)                       (surge)


                       Fault Tree Construction

                            Gate 1. One primary failure event is the failure of the motor itself (for
                               example, due to a wiring failure within the motor or loss of lubrication
                               to the bearings). This event is a basic event because no details of the
                               motor are given, therefore, the event cannot be developed further. The
                               other possibility is the event that no current is supplied to the motor.

Fault Tree Analysis – Page 10
M. Pandey, University of Waterloo                         CIVE 240 – Engineering and Sustainable Development


    Gate 2. The event “No current in motor” is the result of other events and
       is therefore developed further. The lack of current to the motor can
       result from a broken connection in any of the other four components in
       the circuit, including the failure of the wire or power supply (basic
       events), the switch being open, or failure of the fuse.

    Gate 3. The open switch may be due to a basic failure of the switch, or the
       event that the switch was opened erroneously. The erroneous opening
       of the switch is due to human error, which could be developed further
       into more basic events (i.e. operator is inexperienced, under stress,
       etc.). However, due to insufficient information, the event is not
       explored further. This purposely undeveloped event is therefore
       denoted with the diamond symbol.

    Gate 4. The fuse failure event may be caused by fuse failure under normal
       conditions (primary failure) or due to overload from the circuit.

    Gate 5. The secondary fuse failure can occur if the fuse does not open
       every time an overload is present in the circuit (because all conditions
       of an overload do not necessarily result in sufficient overcurrent to
       open the fuse). This is why a conditional gate, denoted by the
       hexagon, is used. The condition, i.e. “Fuse fails open” is placed in the
       connecting oval, and the conditional gate is treated similarly to an
       AND gate in subsequent tree analysis.

    Gate 6. The overload in the circuit may be caused either by a short or a
       power surge, both of which are primary (i.e. basic) events.


Considerations
    construction of a fault tree is subjective
    need to take into account
       Level of Detail – the number of basic events should be defined such
       that the size of the tree is reasonable with respect to the scope of the
       analysis
       Probability Assignment – need to stop development at the level
       where probability or failure data is available
       Meaningfulness – the level of detail should be such that the basic and
       undeveloped events correspond to the design aspects being analyzed


                                                                                Fault Tree Analysis – Page 11
CIVE 240 – Engineering and Sustainable Development                              M. Pandey, University of Waterloo


                       Fault Tree Evaluation
                            identify critical events and event combinations that lead to the top event
                            calculate the probability of the top event based on the probabilities of the
                            basic and undeveloped events in the fault tree
                            two types of analysis
                                qualitative
                                quantitative
                            based on Boolean logic

                       Boolean Algebra
                            fault trees describe the relationships between events using Boolean logic
                            a fault tree can be translated into an equivalent set of Boolean equations

                       The OR Gate
                       Represents the union of events at the gate. For event Q with two input events
                       A and B attached to the OR gate, the probability is obtained as
                            P (Q ) = P (A) + P (B ) − P (A ∩ B )                                              (1)

                            or
                            P (Q ) = P (A) + P (B ) − P (A)P (B | A)                                          (2)

                       If A and B are mutually exclusive events then P (A ∩ B ) = 0 and
                            P (Q ) = P (A) + P (B )                                                           (3)

                       If A and B are independent events then P (B | A) = P (B ) and
                            P (Q ) = P (A) + P (B ) − P (A)P (B )                                             (4)

                       If event B is completely dependent on event A then P (B | A) = 1 and
                            P (Q ) = P (A) + P (B ) − P (A)(1) = P (B )                                       (5)

                       Therefore, the approximation of
                            P (Q ) = P (A) + P (B )                                                           (6)

                       is always a conservative estimate for the probability of event Q (because
                       P (A ∩ B ) is small compared with P (A) + P (B ) for very low probability
                       events). Event Q will occur if any (at least) one of the input events to the OR
                       gate occur.

                       The AND Gate
                       Represents the intersection of events at the gate. For event Q with two input
                       events A and B attached to the AND gate, the probability is obtained as
                            P (Q ) = P (A)P (B | A) = P (B )P (A | B )                                        (7)


Fault Tree Analysis – Page 12
M. Pandey, University of Waterloo                                                CIVE 240 – Engineering and Sustainable Development


If A and B are independent events then P (B | A) = P (B ) and
P (A | B ) = P (A) therefore
    P (Q ) = P (A)P (B )                                                                                  (8)

If A and B are not independent, then Q may be significantly greater than
P (A)P (B ) . Event Q is caused only if every (all) input event attached to the
AND gate occur.


 Rules of Boolean Algebra
  Mathematical Notation                 Engineering Notation                Designation
   X ∩Y = Y ∩ X                         X ⋅Y = Y ⋅ X                        Commutative Law
   X ∪Y = Y ∪ X                         X +Y = Y + X

   X ∩ (Y ∩ Z ) = (X ∩ Y ) ∩ Z          X ⋅ (Y ⋅ Z ) = (X ⋅Y ) ⋅ Z          Associative Law
                                        X (YZ ) = (XY )Z
   X ∪ (Y ∪ Z ) = (X ∪ Y ) ∪ Z          X + (Y + Z ) = (X +Y ) + Z

   X ∩ (Y ∪ Z ) = (X ∩ Y ) ∪ (X ∩ Z )   X ⋅ (Y + Z ) = X ⋅Y + X ⋅ Z         Distributive Law
                                        X (Y + Z ) = XY + XZ
   X ∪ (Y ∩ Z ) = (X ∪Y ) ∩ (X ∪ Z )    X + (Y ⋅ Z ) = (X +Y ) ⋅ (X + Z )

   X ∩X = X                             X ⋅X = X                            Idempotent Law
   X ∪X = X                             X +X = X

   X ∩ (X ∪ Y ) = X                     X ⋅ (X + Y ) = X                    Law of Absorption
   X ∪ (X ∩ Y ) = X                     X + (X ⋅Y ) = X

   X ∩X = φ                             X ⋅X = φ                            Complementation
   X ∪X =Ω= I                           X +X = Ω= I

   X ∩Y = X ∪Y                          X ⋅Y = X + Y                        de Morgan’s Rule
   X ∪Y = X ∩Y                          X + Y = X ⋅Y

   φ∩X =φ                               φ⋅X = φ                             Operations with φ and Ω
   φ∪X = X                              φ+X = X
   Ω∩X = X                              Ω⋅X = X
   Ω∪X = Ω                              Ω+X = Ω
   φ =Ω                                 φ =Ω
   Ω=φ                                  Ω=φ

   X ∪ (X ∩ Y ) = X ∪ Y                 X + (X ⋅Y ) = X + Y                 Other relationships
   X ∩ (X ∪ Y ) = X ∩ Y                 X ⋅ (X + Y ) = X ⋅Y

 φ is the empty or null set which is equal to zero
 Ω or I is the universal set which is equal to one


                                                                                                       Fault Tree Analysis – Page 13
CIVE 240 – Engineering and Sustainable Development                                  M. Pandey, University of Waterloo


                       Qualitative Analysis
                            used for identifying
                               critical events
                               potential system weaknesses
                               best ways to reduce the risk associated with the top event
                            conducted using minimal cut sets

                       Minimal Cut Sets

                                     The smallest combination of basic events which, if they occur,
                                                   will cause the top event to occur.

                            can be seen as a specific scenario that leads to the top event
                            cut sets are combinations (intersections) of component failures sufficient
                            for the top event
                            the occurrence of all events in a minimal cut set is necessary for the
                            occurrence of the top event, i.e. if one of the failures in a cut set does not
                            occur, then the top event will not occur (by this combination)
                            there are a finite number of minimal cut sets for each fault tree, which are
                            unique for the top event
                            one-component minimal cut sets represent failures which will cause the
                            top event to occur
                            the minimal cut sets for a fault tree are obtained by
                                translating the tree to its equivalent Boolean equations
                                (assume that events are independent)
                                using top-down or bottom-up substitution
                                using the Distributive Law and Law of Absorption to remove
                                redundancies

                       Criticality
                            the importance of each minimal cut set can be based on its relative
                            contribution to the total probability of the top event
                            the minimal cut sets for a fault tree can be used to identify the most critical
                            basic events using the following criteria
                               minimal cut sets that include a small number of events represent less
                               redundancy and so have higher criticality
                               events that appear on a large number of minimal cut sets are more
                               important because they can contribute to the top event in several
                               scenarios
                            must also consider the relative probabilities of each of the events
                               the importance of each event can be based on the total probability of
                               the cut sets to which the basic event contributes (i.e. represents the
                               total probability of failure involving the event)


Fault Tree Analysis – Page 14
M. Pandey, University of Waterloo                        CIVE 240 – Engineering and Sustainable Development


 Example: Determine all the minimal cut sets for the small motor problem.

Solution:
   Let T denote the top event
   Let P denote primary events (circles)
   Let G denote intermediate events (rectangles)
   Let S denote undeveloped events (diamonds)
   Let C denote conditioning events (ovals)
                                                            T
Therefore                                                   +
   T = motor fails to operate
   P1 = defect in motor                                               G1
                                                    P1
   P2 = wire failure (open)
   P3 = power supply failure                                          +

   P4 = switch fails open
   P5 = fuse failure under normal             G2            P2        G3        P3
          conditions (open)                   +                       +
   P6 = wire failure (shorted)
   P7 = power failure (surge)          P4          S1       G4                  P5
   G1 = no current to motor
                                                            x         C1
   G2 = fuse fails open
   G3 = switch open                                         G5
   G4 = fuse failure due to overload                        +
   G5 = overload in circuit
   S1 = switch opened erroneously                   P6                P7
   C1 = fuse fails to open
Writing equations for each gate of the tree
  T = P1 + G1                                                                     (9)
  G1 = P2 + P3 + G2 + G3                                                         (10)
  G2 = P4 + S1                                                                   (11)
  G3 = G4 + P5                                                                   (12)
  G4 = C1 · G5                                                                   (13)
  G5 = P6 + P7                                                                   (14)
Using the top-down approach we get by substitution
   T = P1 + G1                                                                   (15)
     = P1 + P2 + P3 + G2 + G3                                                  (15.1)
     = P1 + P2 + P3 + P4 + S1 + G3                                             (15.2)
     = P1 + P2 + P3 + P4 + S1 + G4 + P5                                        (15.3)
     = P1 + P2 + P3 + P4 + S1 + (C1 · G5) + P5                                 (15.4)
     = P1 + P2 + P3 + P4 + S1 + P5 + C1 · (P6 + P7)                            (15.5)
     = P1 + P2 + P3 + P4 + S1 + P5 + (C1 · P6) + (C1 · P7)                     (15.6)

 The top event, therefore, contains 6 single component minimum cut sets and
 2 double component minimum cut sets.


                                                                               Fault Tree Analysis – Page 15
CIVE 240 – Engineering and Sustainable Development                                    M. Pandey, University of Waterloo


                       Quantitative Analysis
                            calculate the probability of occurrence of the top event, given the fault
                            tree and the probability of occurrence of the basic events
                            common approaches include
                                assume all basic events are independent
                                assume the probabilities of basic events are small (rare-event
                                approximation)
                            if each basic event on the fault tree occurs only once, then the tree
                            branches emanating from any given gate in the tree are independent
                            the probability of the top event is given by the probability of the union of
                            the minimum cut sets
                            results in a conservative estimate of the probability of failure

                       Common-Cause Failures

                                Multiple failures originating from a common cause that fails the system.

                            the basic events may not always be independent
                            failure events can be caused by a common environment or have factors in
                            common (e.g. an operator has miscalibrated all sensors)
                            common causes often arise from factors such as manufacturer,
                            environment, energy sources, and humans
                            the evaluation of probabilities will require conditional or joint
                            probabilities


                         Example: Calculate the probability of occurrence of the top event for the
                         simple motor example. Assume the probability of occurrence of each basic
                         event is equal to 0.01 and the probability of the event S1 “Switch opened
                         erroneously” is equal to 0.001. Also assume that the condition C1 “Fuse
                         fails open” has a probability of occurrence of 0.50.

                       Solution:
                       Using the same notation as before we are given
                                Event   Description                                             Probability
                                 P1     Defect in motor                                            0.01
                                 P2     Wire failure (open)                                        0.01
                                 P3     Power supply failure                                       0.01
                                 P4     Switch fails open                                          0.01
                                 P5     Fuse failure under normal conditions (open)                0.01
                                 P6     Wire failure (shorted)                                     0.01
                                 P7     Power failure (surge)                                      0.01
                                 S1     Switch opened erroneously                                 0.001
                                 C1     Fuse fails open                                            0.50


Fault Tree Analysis – Page 16
M. Pandey, University of Waterloo                                    CIVE 240 – Engineering and Sustainable Development


The probability of intermediate events can be evaluated using the fault tree.
The probability of the top event is given by the union of the minimum cut sets
determined before as

    T = P1 + P2 + P3 + P4 + S1 + P5 + (C1 · P6) + (C1 · P7)                      (16)
      = 0.01 + 0.01 + 0.01 + 0.01 + 0.001 + 0.01 + (0.50)(0.01) + (0.50)(0.01) (16.1)
      = 0.061                                                                  (16.2)

                                              0.061

                                               +


                                       0.01           0.051

                                                       +


                             0.011            0.01    0.02    0.01

                               +                       +


                      0.01           0.001    0.01            0.01

                                               x      0.50

                                              0.02

                                               +


                                       0.01           0.01


                                                                                           Fault Tree Analysis – Page 17
CIVE 240 – Engineering and Sustainable Development                               M. Pandey, University of Waterloo


                       References
                       McCormick, N.J. 1981. Reliability and Risk Analysis: Methods and Nuclear Power
                         Applications. Academic Press, New York.
                       United States Coast Guard. 2004. Risk-based Decision-making (RBDM)
                         Guidelines (3rd Ed.), Vol. 3 – Risk Assessment Tools Reference, Chapter 9 –
                         Fault Tree Analysis.
                         (http://www.uscg.mil/hq/g-m/risk/E-Guidelines/RBDMGuide.htm)
                       United States Nuclear Regulatory Commission (NRC). 1981. Fault Tree
                         Handbook. NUREG-0492. Systems and Reliability Research Office of
                         Nuclear Regulatory Research, Washington, D.C.
                         (http://www.nrc.gov/reading-rm/doc-collections/nuregs/staff/sr0492/sr0492.pdf)


Fault Tree Analysis – Page 18

Mais conteúdo relacionado

Mais procurados

Fault tree analysis
Fault tree analysisFault tree analysis
Fault tree analysisAkku Singh
 
FAULT & EVENT TREE ANALYSIS
FAULT & EVENT TREE ANALYSISFAULT & EVENT TREE ANALYSIS
FAULT & EVENT TREE ANALYSISNitesh Dongare
 
Fault tree analysis semiar report
Fault tree analysis semiar reportFault tree analysis semiar report
Fault tree analysis semiar reportAnusha Chethana
 
Root Cause Analysis - methods and best practice
Root Cause Analysis - methods and best practiceRoot Cause Analysis - methods and best practice
Root Cause Analysis - methods and best practiceMedgate Inc.
 
Fault tree analysis
Fault tree analysisFault tree analysis
Fault tree analysisDeep parmar
 
Failure Mode & Effect Analysis
Failure Mode & Effect AnalysisFailure Mode & Effect Analysis
Failure Mode & Effect AnalysisNafis Ahmad
 
Root Cause Corrective Action
Root Cause Corrective ActionRoot Cause Corrective Action
Root Cause Corrective ActionUbersoldat
 
Reliability Centred Maintenance Presentation
Reliability Centred Maintenance PresentationReliability Centred Maintenance Presentation
Reliability Centred Maintenance PresentationAndy_Watson_Sim
 
Rcm 4 hour overview for rcm teams
Rcm 4 hour overview for rcm teamsRcm 4 hour overview for rcm teams
Rcm 4 hour overview for rcm teamsMatthew Clemens
 
Root cause analysis - tools and process
Root cause analysis - tools and processRoot cause analysis - tools and process
Root cause analysis - tools and processCharles Cotter, PhD
 
Fault tree and event tree in risk analysis
Fault tree and event tree in risk analysisFault tree and event tree in risk analysis
Fault tree and event tree in risk analysisJennifer Gutierrez
 
HAZOP AND OPERABILITY STUDY
HAZOP AND OPERABILITY STUDY HAZOP AND OPERABILITY STUDY
HAZOP AND OPERABILITY STUDY damomech92
 
Fault Tree Analysis-Concepts and Application-Bill Vesely
Fault Tree Analysis-Concepts and Application-Bill VeselyFault Tree Analysis-Concepts and Application-Bill Vesely
Fault Tree Analysis-Concepts and Application-Bill VeselyMassimo Talia
 
Machine maintenance presentation
Machine maintenance presentationMachine maintenance presentation
Machine maintenance presentationhimu_kamrul
 
Failure Mode Effect Analysis (FMEA)
Failure Mode Effect Analysis (FMEA)Failure Mode Effect Analysis (FMEA)
Failure Mode Effect Analysis (FMEA)DEEPAK SAHOO
 

Mais procurados (20)

Fault tree analysis
Fault tree analysisFault tree analysis
Fault tree analysis
 
Fault tree analysis
Fault tree analysisFault tree analysis
Fault tree analysis
 
FAULT & EVENT TREE ANALYSIS
FAULT & EVENT TREE ANALYSISFAULT & EVENT TREE ANALYSIS
FAULT & EVENT TREE ANALYSIS
 
Root cause analysis training
Root cause analysis trainingRoot cause analysis training
Root cause analysis training
 
Fault tree analysis semiar report
Fault tree analysis semiar reportFault tree analysis semiar report
Fault tree analysis semiar report
 
Reliability engineering ppt-Internship
Reliability engineering ppt-InternshipReliability engineering ppt-Internship
Reliability engineering ppt-Internship
 
Root Cause Analysis - methods and best practice
Root Cause Analysis - methods and best practiceRoot Cause Analysis - methods and best practice
Root Cause Analysis - methods and best practice
 
Fault tree analysis
Fault tree analysisFault tree analysis
Fault tree analysis
 
Failure Mode & Effect Analysis
Failure Mode & Effect AnalysisFailure Mode & Effect Analysis
Failure Mode & Effect Analysis
 
Root Cause Corrective Action
Root Cause Corrective ActionRoot Cause Corrective Action
Root Cause Corrective Action
 
Presentation hazop introduction
Presentation hazop introductionPresentation hazop introduction
Presentation hazop introduction
 
FMEA Presentation
FMEA PresentationFMEA Presentation
FMEA Presentation
 
Reliability Centred Maintenance Presentation
Reliability Centred Maintenance PresentationReliability Centred Maintenance Presentation
Reliability Centred Maintenance Presentation
 
Rcm 4 hour overview for rcm teams
Rcm 4 hour overview for rcm teamsRcm 4 hour overview for rcm teams
Rcm 4 hour overview for rcm teams
 
Root cause analysis - tools and process
Root cause analysis - tools and processRoot cause analysis - tools and process
Root cause analysis - tools and process
 
Fault tree and event tree in risk analysis
Fault tree and event tree in risk analysisFault tree and event tree in risk analysis
Fault tree and event tree in risk analysis
 
HAZOP AND OPERABILITY STUDY
HAZOP AND OPERABILITY STUDY HAZOP AND OPERABILITY STUDY
HAZOP AND OPERABILITY STUDY
 
Fault Tree Analysis-Concepts and Application-Bill Vesely
Fault Tree Analysis-Concepts and Application-Bill VeselyFault Tree Analysis-Concepts and Application-Bill Vesely
Fault Tree Analysis-Concepts and Application-Bill Vesely
 
Machine maintenance presentation
Machine maintenance presentationMachine maintenance presentation
Machine maintenance presentation
 
Failure Mode Effect Analysis (FMEA)
Failure Mode Effect Analysis (FMEA)Failure Mode Effect Analysis (FMEA)
Failure Mode Effect Analysis (FMEA)
 

Destaque

HAZARD & OPERABILITY STUDY (HAZOP) & MATERIAL SAFETY DATA SHEET (MSDS)
HAZARD & OPERABILITY STUDY (HAZOP) & MATERIAL SAFETY DATA SHEET (MSDS)HAZARD & OPERABILITY STUDY (HAZOP) & MATERIAL SAFETY DATA SHEET (MSDS)
HAZARD & OPERABILITY STUDY (HAZOP) & MATERIAL SAFETY DATA SHEET (MSDS)Angel Darío González-Delgado
 
Hazard analysis(ppt)
Hazard analysis(ppt)Hazard analysis(ppt)
Hazard analysis(ppt)waiyin_lee
 
Building your All-Star DevOps Team – "Planning, Process and Partners"
Building your All-Star DevOps Team – "Planning, Process and Partners"Building your All-Star DevOps Team – "Planning, Process and Partners"
Building your All-Star DevOps Team – "Planning, Process and Partners"Dustin Collins
 
Law 323 tax law (part i & ii) akhtar ali and asim zulfiqar ali
Law 323 tax law (part i & ii) akhtar ali and asim zulfiqar aliLaw 323 tax law (part i & ii) akhtar ali and asim zulfiqar ali
Law 323 tax law (part i & ii) akhtar ali and asim zulfiqar aliUniversity Of Central Punjab
 
Virtual teams - Learnings from Crisis Management Teams for Distributed Agile ...
Virtual teams - Learnings from Crisis Management Teams for Distributed Agile ...Virtual teams - Learnings from Crisis Management Teams for Distributed Agile ...
Virtual teams - Learnings from Crisis Management Teams for Distributed Agile ...Rolf Häsänen
 
Risk management in-60601-1
Risk management in-60601-1Risk management in-60601-1
Risk management in-60601-1Stella Tsank
 
Principles of accounting
Principles of accountingPrinciples of accounting
Principles of accountingSuraj Rana
 
Risk management seminar -en
Risk management   seminar -enRisk management   seminar -en
Risk management seminar -enRolf Häsänen
 
Exploratory data analysis handbook (from www.nist.gov, Engineering Statistic...
Exploratory data analysis handbook (from www.nist.gov,  Engineering Statistic...Exploratory data analysis handbook (from www.nist.gov,  Engineering Statistic...
Exploratory data analysis handbook (from www.nist.gov, Engineering Statistic...Stella Tsank
 
The business book (big ideas simply explained) by dk publishing
The business book (big ideas simply explained) by dk publishingThe business book (big ideas simply explained) by dk publishing
The business book (big ideas simply explained) by dk publishingMartin Arale
 
Human error and secure systems - DevOpsDays Ohio 2015
Human error and secure systems - DevOpsDays Ohio 2015Human error and secure systems - DevOpsDays Ohio 2015
Human error and secure systems - DevOpsDays Ohio 2015Dustin Collins
 
Iso Internal Auditor
Iso Internal AuditorIso Internal Auditor
Iso Internal AuditorDanyah Hejaij
 
[] Medical notes_clinical_medicine_pocket_guide
[] Medical notes_clinical_medicine_pocket_guide[] Medical notes_clinical_medicine_pocket_guide
[] Medical notes_clinical_medicine_pocket_guideAchmad Dainuri
 

Destaque (20)

HAZARD & OPERABILITY STUDY (HAZOP) & MATERIAL SAFETY DATA SHEET (MSDS)
HAZARD & OPERABILITY STUDY (HAZOP) & MATERIAL SAFETY DATA SHEET (MSDS)HAZARD & OPERABILITY STUDY (HAZOP) & MATERIAL SAFETY DATA SHEET (MSDS)
HAZARD & OPERABILITY STUDY (HAZOP) & MATERIAL SAFETY DATA SHEET (MSDS)
 
What is a HAZOP?
What is a HAZOP?What is a HAZOP?
What is a HAZOP?
 
Hazard analysis(ppt)
Hazard analysis(ppt)Hazard analysis(ppt)
Hazard analysis(ppt)
 
Building your All-Star DevOps Team – "Planning, Process and Partners"
Building your All-Star DevOps Team – "Planning, Process and Partners"Building your All-Star DevOps Team – "Planning, Process and Partners"
Building your All-Star DevOps Team – "Planning, Process and Partners"
 
Does the moon rotate
Does the moon rotateDoes the moon rotate
Does the moon rotate
 
Law 323 tax law (part i & ii) akhtar ali and asim zulfiqar ali
Law 323 tax law (part i & ii) akhtar ali and asim zulfiqar aliLaw 323 tax law (part i & ii) akhtar ali and asim zulfiqar ali
Law 323 tax law (part i & ii) akhtar ali and asim zulfiqar ali
 
Miracles in the_quran
Miracles in the_quranMiracles in the_quran
Miracles in the_quran
 
Virtual teams - Learnings from Crisis Management Teams for Distributed Agile ...
Virtual teams - Learnings from Crisis Management Teams for Distributed Agile ...Virtual teams - Learnings from Crisis Management Teams for Distributed Agile ...
Virtual teams - Learnings from Crisis Management Teams for Distributed Agile ...
 
Risk management in-60601-1
Risk management in-60601-1Risk management in-60601-1
Risk management in-60601-1
 
Principles of accounting
Principles of accountingPrinciples of accounting
Principles of accounting
 
Risk management seminar -en
Risk management   seminar -enRisk management   seminar -en
Risk management seminar -en
 
Exploratory data analysis handbook (from www.nist.gov, Engineering Statistic...
Exploratory data analysis handbook (from www.nist.gov,  Engineering Statistic...Exploratory data analysis handbook (from www.nist.gov,  Engineering Statistic...
Exploratory data analysis handbook (from www.nist.gov, Engineering Statistic...
 
Exempt user guide ACCA
Exempt user guide ACCAExempt user guide ACCA
Exempt user guide ACCA
 
The business book (big ideas simply explained) by dk publishing
The business book (big ideas simply explained) by dk publishingThe business book (big ideas simply explained) by dk publishing
The business book (big ideas simply explained) by dk publishing
 
Hundred great muslims
Hundred great muslimsHundred great muslims
Hundred great muslims
 
Human error and secure systems - DevOpsDays Ohio 2015
Human error and secure systems - DevOpsDays Ohio 2015Human error and secure systems - DevOpsDays Ohio 2015
Human error and secure systems - DevOpsDays Ohio 2015
 
Miracles of the_quran
Miracles of the_quranMiracles of the_quran
Miracles of the_quran
 
Iso Internal Auditor
Iso Internal AuditorIso Internal Auditor
Iso Internal Auditor
 
[] Medical notes_clinical_medicine_pocket_guide
[] Medical notes_clinical_medicine_pocket_guide[] Medical notes_clinical_medicine_pocket_guide
[] Medical notes_clinical_medicine_pocket_guide
 
Labor policy in pakistan
Labor policy in pakistanLabor policy in pakistan
Labor policy in pakistan
 

Semelhante a Fault tree analysis

Fta & pokayoke
Fta & pokayokeFta & pokayoke
Fta & pokayokerashmi322
 
An overarching process to evaluate risks associated with infrastructure netwo...
An overarching process to evaluate risks associated with infrastructure netwo...An overarching process to evaluate risks associated with infrastructure netwo...
An overarching process to evaluate risks associated with infrastructure netwo...Infra Risk
 
2011-05-02 - VU Amsterdam - Testing safety critical systems
2011-05-02 - VU Amsterdam - Testing safety critical systems2011-05-02 - VU Amsterdam - Testing safety critical systems
2011-05-02 - VU Amsterdam - Testing safety critical systemsJaap van Ekris
 
2010-03-31 - VU Amsterdam - Experiences testing safety critical systems
2010-03-31 - VU Amsterdam - Experiences testing safety critical systems2010-03-31 - VU Amsterdam - Experiences testing safety critical systems
2010-03-31 - VU Amsterdam - Experiences testing safety critical systemsJaap van Ekris
 
Combating Fraud and Intrusion Threats with Event Processing
Combating Fraud and Intrusion Threats with Event ProcessingCombating Fraud and Intrusion Threats with Event Processing
Combating Fraud and Intrusion Threats with Event ProcessingTim Bass
 
L11 Transition And Key Roles and SAT ROB IRP.pptx
L11 Transition And Key Roles and SAT ROB IRP.pptxL11 Transition And Key Roles and SAT ROB IRP.pptx
L11 Transition And Key Roles and SAT ROB IRP.pptxStevenTharp2
 
Programmatic risk management workshop (handbook)
Programmatic risk management workshop (handbook)Programmatic risk management workshop (handbook)
Programmatic risk management workshop (handbook)Glen Alleman
 
A survey of online failure prediction methods
A survey of online failure prediction methodsA survey of online failure prediction methods
A survey of online failure prediction methodsunyil96
 
FMEA - Failure Mode and Effects Analysis
FMEA - Failure Mode and Effects AnalysisFMEA - Failure Mode and Effects Analysis
FMEA - Failure Mode and Effects Analysisマルセロ 白井
 

Semelhante a Fault tree analysis (20)

Industrial safety unit iv ppt
Industrial safety unit iv pptIndustrial safety unit iv ppt
Industrial safety unit iv ppt
 
stpfaulttree
stpfaulttreestpfaulttree
stpfaulttree
 
Risk assesment
Risk assesmentRisk assesment
Risk assesment
 
Fta & pokayoke
Fta & pokayokeFta & pokayoke
Fta & pokayoke
 
How Complex Systems Fail
How Complex Systems FailHow Complex Systems Fail
How Complex Systems Fail
 
Risk assessment tools and techniques
Risk assessment tools and techniquesRisk assessment tools and techniques
Risk assessment tools and techniques
 
An overarching process to evaluate risks associated with infrastructure netwo...
An overarching process to evaluate risks associated with infrastructure netwo...An overarching process to evaluate risks associated with infrastructure netwo...
An overarching process to evaluate risks associated with infrastructure netwo...
 
Vortrag LWS Schweiz
Vortrag LWS SchweizVortrag LWS Schweiz
Vortrag LWS Schweiz
 
Equipment Criticality Analysis
Equipment Criticality AnalysisEquipment Criticality Analysis
Equipment Criticality Analysis
 
2011-05-02 - VU Amsterdam - Testing safety critical systems
2011-05-02 - VU Amsterdam - Testing safety critical systems2011-05-02 - VU Amsterdam - Testing safety critical systems
2011-05-02 - VU Amsterdam - Testing safety critical systems
 
2010-03-31 - VU Amsterdam - Experiences testing safety critical systems
2010-03-31 - VU Amsterdam - Experiences testing safety critical systems2010-03-31 - VU Amsterdam - Experiences testing safety critical systems
2010-03-31 - VU Amsterdam - Experiences testing safety critical systems
 
Combating Fraud and Intrusion Threats with Event Processing
Combating Fraud and Intrusion Threats with Event ProcessingCombating Fraud and Intrusion Threats with Event Processing
Combating Fraud and Intrusion Threats with Event Processing
 
L11 Transition And Key Roles and SAT ROB IRP.pptx
L11 Transition And Key Roles and SAT ROB IRP.pptxL11 Transition And Key Roles and SAT ROB IRP.pptx
L11 Transition And Key Roles and SAT ROB IRP.pptx
 
Programmatic risk management workshop (handbook)
Programmatic risk management workshop (handbook)Programmatic risk management workshop (handbook)
Programmatic risk management workshop (handbook)
 
A survey of online failure prediction methods
A survey of online failure prediction methodsA survey of online failure prediction methods
A survey of online failure prediction methods
 
PERUMIN 31: Bow-tie Risk Analysis
PERUMIN 31: Bow-tie Risk AnalysisPERUMIN 31: Bow-tie Risk Analysis
PERUMIN 31: Bow-tie Risk Analysis
 
Sis training course_1
Sis training course_1Sis training course_1
Sis training course_1
 
Root cause analysis
Root cause analysisRoot cause analysis
Root cause analysis
 
FMEA - Failure Mode and Effects Analysis
FMEA - Failure Mode and Effects AnalysisFMEA - Failure Mode and Effects Analysis
FMEA - Failure Mode and Effects Analysis
 
CSIAC_V1N4_FINAL_2
CSIAC_V1N4_FINAL_2CSIAC_V1N4_FINAL_2
CSIAC_V1N4_FINAL_2
 

Último

Concurrency Control in Database Management system
Concurrency Control in Database Management systemConcurrency Control in Database Management system
Concurrency Control in Database Management systemChristalin Nelson
 
Science 7 Quarter 4 Module 2: Natural Resources.pptx
Science 7 Quarter 4 Module 2: Natural Resources.pptxScience 7 Quarter 4 Module 2: Natural Resources.pptx
Science 7 Quarter 4 Module 2: Natural Resources.pptxMaryGraceBautista27
 
Proudly South Africa powerpoint Thorisha.pptx
Proudly South Africa powerpoint Thorisha.pptxProudly South Africa powerpoint Thorisha.pptx
Proudly South Africa powerpoint Thorisha.pptxthorishapillay1
 
Barangay Council for the Protection of Children (BCPC) Orientation.pptx
Barangay Council for the Protection of Children (BCPC) Orientation.pptxBarangay Council for the Protection of Children (BCPC) Orientation.pptx
Barangay Council for the Protection of Children (BCPC) Orientation.pptxCarlos105
 
call girls in Kamla Market (DELHI) 🔝 >༒9953330565🔝 genuine Escort Service 🔝✔️✔️
call girls in Kamla Market (DELHI) 🔝 >༒9953330565🔝 genuine Escort Service 🔝✔️✔️call girls in Kamla Market (DELHI) 🔝 >༒9953330565🔝 genuine Escort Service 🔝✔️✔️
call girls in Kamla Market (DELHI) 🔝 >༒9953330565🔝 genuine Escort Service 🔝✔️✔️9953056974 Low Rate Call Girls In Saket, Delhi NCR
 
Grade 9 Quarter 4 Dll Grade 9 Quarter 4 DLL.pdf
Grade 9 Quarter 4 Dll Grade 9 Quarter 4 DLL.pdfGrade 9 Quarter 4 Dll Grade 9 Quarter 4 DLL.pdf
Grade 9 Quarter 4 Dll Grade 9 Quarter 4 DLL.pdfJemuel Francisco
 
Like-prefer-love -hate+verb+ing & silent letters & citizenship text.pdf
Like-prefer-love -hate+verb+ing & silent letters & citizenship text.pdfLike-prefer-love -hate+verb+ing & silent letters & citizenship text.pdf
Like-prefer-love -hate+verb+ing & silent letters & citizenship text.pdfMr Bounab Samir
 
FILIPINO PSYCHology sikolohiyang pilipino
FILIPINO PSYCHology sikolohiyang pilipinoFILIPINO PSYCHology sikolohiyang pilipino
FILIPINO PSYCHology sikolohiyang pilipinojohnmickonozaleda
 
Choosing the Right CBSE School A Comprehensive Guide for Parents
Choosing the Right CBSE School A Comprehensive Guide for ParentsChoosing the Right CBSE School A Comprehensive Guide for Parents
Choosing the Right CBSE School A Comprehensive Guide for Parentsnavabharathschool99
 
Earth Day Presentation wow hello nice great
Earth Day Presentation wow hello nice greatEarth Day Presentation wow hello nice great
Earth Day Presentation wow hello nice greatYousafMalik24
 
GRADE 4 - SUMMATIVE TEST QUARTER 4 ALL SUBJECTS
GRADE 4 - SUMMATIVE TEST QUARTER 4 ALL SUBJECTSGRADE 4 - SUMMATIVE TEST QUARTER 4 ALL SUBJECTS
GRADE 4 - SUMMATIVE TEST QUARTER 4 ALL SUBJECTSJoshuaGantuangco2
 
THEORIES OF ORGANIZATION-PUBLIC ADMINISTRATION
THEORIES OF ORGANIZATION-PUBLIC ADMINISTRATIONTHEORIES OF ORGANIZATION-PUBLIC ADMINISTRATION
THEORIES OF ORGANIZATION-PUBLIC ADMINISTRATIONHumphrey A Beña
 
USPS® Forced Meter Migration - How to Know if Your Postage Meter Will Soon be...
USPS® Forced Meter Migration - How to Know if Your Postage Meter Will Soon be...USPS® Forced Meter Migration - How to Know if Your Postage Meter Will Soon be...
USPS® Forced Meter Migration - How to Know if Your Postage Meter Will Soon be...Postal Advocate Inc.
 
Karra SKD Conference Presentation Revised.pptx
Karra SKD Conference Presentation Revised.pptxKarra SKD Conference Presentation Revised.pptx
Karra SKD Conference Presentation Revised.pptxAshokKarra1
 
ACC 2024 Chronicles. Cardiology. Exam.pdf
ACC 2024 Chronicles. Cardiology. Exam.pdfACC 2024 Chronicles. Cardiology. Exam.pdf
ACC 2024 Chronicles. Cardiology. Exam.pdfSpandanaRallapalli
 
Student Profile Sample - We help schools to connect the data they have, with ...
Student Profile Sample - We help schools to connect the data they have, with ...Student Profile Sample - We help schools to connect the data they have, with ...
Student Profile Sample - We help schools to connect the data they have, with ...Seán Kennedy
 
Visit to a blind student's school🧑‍🦯🧑‍🦯(community medicine)
Visit to a blind student's school🧑‍🦯🧑‍🦯(community medicine)Visit to a blind student's school🧑‍🦯🧑‍🦯(community medicine)
Visit to a blind student's school🧑‍🦯🧑‍🦯(community medicine)lakshayb543
 

Último (20)

LEFT_ON_C'N_ PRELIMS_EL_DORADO_2024.pptx
LEFT_ON_C'N_ PRELIMS_EL_DORADO_2024.pptxLEFT_ON_C'N_ PRELIMS_EL_DORADO_2024.pptx
LEFT_ON_C'N_ PRELIMS_EL_DORADO_2024.pptx
 
Concurrency Control in Database Management system
Concurrency Control in Database Management systemConcurrency Control in Database Management system
Concurrency Control in Database Management system
 
Science 7 Quarter 4 Module 2: Natural Resources.pptx
Science 7 Quarter 4 Module 2: Natural Resources.pptxScience 7 Quarter 4 Module 2: Natural Resources.pptx
Science 7 Quarter 4 Module 2: Natural Resources.pptx
 
Proudly South Africa powerpoint Thorisha.pptx
Proudly South Africa powerpoint Thorisha.pptxProudly South Africa powerpoint Thorisha.pptx
Proudly South Africa powerpoint Thorisha.pptx
 
Barangay Council for the Protection of Children (BCPC) Orientation.pptx
Barangay Council for the Protection of Children (BCPC) Orientation.pptxBarangay Council for the Protection of Children (BCPC) Orientation.pptx
Barangay Council for the Protection of Children (BCPC) Orientation.pptx
 
call girls in Kamla Market (DELHI) 🔝 >༒9953330565🔝 genuine Escort Service 🔝✔️✔️
call girls in Kamla Market (DELHI) 🔝 >༒9953330565🔝 genuine Escort Service 🔝✔️✔️call girls in Kamla Market (DELHI) 🔝 >༒9953330565🔝 genuine Escort Service 🔝✔️✔️
call girls in Kamla Market (DELHI) 🔝 >༒9953330565🔝 genuine Escort Service 🔝✔️✔️
 
Grade 9 Quarter 4 Dll Grade 9 Quarter 4 DLL.pdf
Grade 9 Quarter 4 Dll Grade 9 Quarter 4 DLL.pdfGrade 9 Quarter 4 Dll Grade 9 Quarter 4 DLL.pdf
Grade 9 Quarter 4 Dll Grade 9 Quarter 4 DLL.pdf
 
Like-prefer-love -hate+verb+ing & silent letters & citizenship text.pdf
Like-prefer-love -hate+verb+ing & silent letters & citizenship text.pdfLike-prefer-love -hate+verb+ing & silent letters & citizenship text.pdf
Like-prefer-love -hate+verb+ing & silent letters & citizenship text.pdf
 
FILIPINO PSYCHology sikolohiyang pilipino
FILIPINO PSYCHology sikolohiyang pilipinoFILIPINO PSYCHology sikolohiyang pilipino
FILIPINO PSYCHology sikolohiyang pilipino
 
Model Call Girl in Tilak Nagar Delhi reach out to us at 🔝9953056974🔝
Model Call Girl in Tilak Nagar Delhi reach out to us at 🔝9953056974🔝Model Call Girl in Tilak Nagar Delhi reach out to us at 🔝9953056974🔝
Model Call Girl in Tilak Nagar Delhi reach out to us at 🔝9953056974🔝
 
Choosing the Right CBSE School A Comprehensive Guide for Parents
Choosing the Right CBSE School A Comprehensive Guide for ParentsChoosing the Right CBSE School A Comprehensive Guide for Parents
Choosing the Right CBSE School A Comprehensive Guide for Parents
 
Earth Day Presentation wow hello nice great
Earth Day Presentation wow hello nice greatEarth Day Presentation wow hello nice great
Earth Day Presentation wow hello nice great
 
GRADE 4 - SUMMATIVE TEST QUARTER 4 ALL SUBJECTS
GRADE 4 - SUMMATIVE TEST QUARTER 4 ALL SUBJECTSGRADE 4 - SUMMATIVE TEST QUARTER 4 ALL SUBJECTS
GRADE 4 - SUMMATIVE TEST QUARTER 4 ALL SUBJECTS
 
THEORIES OF ORGANIZATION-PUBLIC ADMINISTRATION
THEORIES OF ORGANIZATION-PUBLIC ADMINISTRATIONTHEORIES OF ORGANIZATION-PUBLIC ADMINISTRATION
THEORIES OF ORGANIZATION-PUBLIC ADMINISTRATION
 
FINALS_OF_LEFT_ON_C'N_EL_DORADO_2024.pptx
FINALS_OF_LEFT_ON_C'N_EL_DORADO_2024.pptxFINALS_OF_LEFT_ON_C'N_EL_DORADO_2024.pptx
FINALS_OF_LEFT_ON_C'N_EL_DORADO_2024.pptx
 
USPS® Forced Meter Migration - How to Know if Your Postage Meter Will Soon be...
USPS® Forced Meter Migration - How to Know if Your Postage Meter Will Soon be...USPS® Forced Meter Migration - How to Know if Your Postage Meter Will Soon be...
USPS® Forced Meter Migration - How to Know if Your Postage Meter Will Soon be...
 
Karra SKD Conference Presentation Revised.pptx
Karra SKD Conference Presentation Revised.pptxKarra SKD Conference Presentation Revised.pptx
Karra SKD Conference Presentation Revised.pptx
 
ACC 2024 Chronicles. Cardiology. Exam.pdf
ACC 2024 Chronicles. Cardiology. Exam.pdfACC 2024 Chronicles. Cardiology. Exam.pdf
ACC 2024 Chronicles. Cardiology. Exam.pdf
 
Student Profile Sample - We help schools to connect the data they have, with ...
Student Profile Sample - We help schools to connect the data they have, with ...Student Profile Sample - We help schools to connect the data they have, with ...
Student Profile Sample - We help schools to connect the data they have, with ...
 
Visit to a blind student's school🧑‍🦯🧑‍🦯(community medicine)
Visit to a blind student's school🧑‍🦯🧑‍🦯(community medicine)Visit to a blind student's school🧑‍🦯🧑‍🦯(community medicine)
Visit to a blind student's school🧑‍🦯🧑‍🦯(community medicine)
 

Fault tree analysis

  • 1. M. Pandey, University of Waterloo CIVE 240 – Engineering and Sustainable Development Fault Tree Analysis Table of Contents Introduction ............................................................................................................... 3 Fault Tree Analysis ................................................................................................... 3 Basic Events ............................................................................................................ 4 Advantages ............................................................................................................. 4 Limitations .............................................................................................................. 4 Notation................................................................................................................... 5 General Procedure for Fault Tree Analysis........................................................ 6 Rules of Fault Tree Construction ......................................................................... 7 Considerations...................................................................................................... 11 Fault Tree Evaluation ............................................................................................. 12 Boolean Algebra ................................................................................................... 12 The OR Gate ....................................................................................................... 12 The AND Gate.................................................................................................... 12 Qualitative Analysis ............................................................................................ 14 Minimal Cut Sets ............................................................................................... 14 Criticality............................................................................................................ 14 Quantitative Analysis.......................................................................................... 16 Common-Cause Failures..................................................................................... 16 References................................................................................................................. 18 Fault Tree Analysis – Page 1
  • 2. CIVE 240 – Engineering and Sustainable Development M. Pandey, University of Waterloo Fault Tree Analysis – Page 2
  • 3. M. Pandey, University of Waterloo CIVE 240 – Engineering and Sustainable Development Introduction there is a need to analyze all the possible failure mechanisms in complex systems (e.g. nuclear power plants) also perform probabilistic analyses for the expected rate of failures estimate probabilities of events that are modelled as logical combinations or logical outcomes of other random events two main methods: fault tree analysis event tree analysis decision trees also exist and are used in risk analysis (combines all feasible alternatives, possible outcomes and their probabilities, monetary consequences and utility evaluations) other graphical methods include reliability block diagrams functional logic diagrams Failure Modes and Effects Analysis (FMEA) Fault Tree Analysis A technique by which many events that interact to produce other events can be related using simple logical relationships. a good reference is NRC “The Fault Tree Handbook” (http://www.nrc.gov/reading-rm/doc-collections/nuregs/staff/sr0492/sr0492.pdf) also Chapter 8 and 10 in McCormick (1981) one of the principal methods of probabilistic safety (or risk) analysis (PRA) developed by Bell Telephone Laboratories in 1962 for the U.S. Air Force Minuteman system, later adopted and extensively used by Boeing Company fault tree diagrams are used most often as a system-level risk assessment technique can model the possible combinations of equipment failures, human errors, and external conditions that can lead to a specific type of accident follow a top-down structure and represent a graphical model of the pathways within a system between basic events that can lead to a foreseeable loss event (or a failure) referred to as the top event the contributory events and conditions are interconnected using standard logic symbols (AND, OR, etc.), also referred to as gates events that must coexist to cause the top event are described using the AND relationship alternate events that can individually cause the top event are described using the OR relationship Fault Tree Analysis – Page 3
  • 4. CIVE 240 – Engineering and Sustainable Development M. Pandey, University of Waterloo the occurrence of a top event may or may not lead to a serious or adverse consequence the relative likelihood of a number of potential consequences will depend on the conditions or subsequent events that follow potential consequences can be systematically identified using an event tree Basic Events An event that cannot be developed any further. all basic events are generally assumed to be statistically independent unless they are common cause failures (i.e. failures arising from a common cause or an initiating event) basic events can be either primary fault events, i.e. subsystem failure due to a basic mode such as a structural fault, failure to open or close, or to start or stop, or secondary fault events, i.e. subsystem failure due to excessive operational or environmental stress resulting in the system element to be out of tolerance Advantages allow the use of reliable information on component failure and other basic events to estimate the overall risk associated with new system designs for which no historical data exists simple to understand and easy to implement qualitative descriptions of potential problems and combinations of events causing specific problems of interest quantitative estimates of failure frequencies and likelihoods, and relative importances of various failure sequences and contributing events lists of recommendations for reducing risks quantitative evaluations of recommendation effectiveness Limitations difficult to conceive all possible scenarios leading to the top event construction of fault trees for large systems can be tedious correlations between basic events (e.g. failure of components belonging to the same batch) are difficult to model and exact solutions to correlated events do not exist subjective decisions regarding the level of detail and completeness are often necessary Fault Tree Analysis – Page 4
  • 5. M. Pandey, University of Waterloo CIVE 240 – Engineering and Sustainable Development Notation Symbol Name Description Primary Event Symbols Circle Basic Event – a basic initiating fault requiring no further development Oval Conditioning Event – specific conditions or restrictions that apply to any logic gate (used with INHIBIT gate) Diamond Undeveloped Event – an event that is not developed further because it is of insufficient consequence or because information is unavailable House External Event – an event which is normally expected to occur (not a fault event) Intermediate Event Symbols Rectangle A fault event that occurs as a result of the logical combination of other events Gate Symbols OR Gate The union operation of events, i.e. the output event occurs if (at least) one or more of the inputs occur AND Gate The intersection operation of events, i.e. the output event occurs if and only if all the inputs occur INHIBIT The output event occurs if the (single) input Gate event occurs in the presence of an enabling condition (i.e. Conditioning Event (oval) drawn to the right of the gate) Transfer Symbols Triangle-in Indicates that the tree is developed further someplace else (e.g. another page) Triangle-out Indicates that this portion of the tree is a sub- tree connected to the corresponding Triangle-In (appears at the top of the tree) Fault Tree Analysis – Page 5
  • 6. CIVE 240 – Engineering and Sustainable Development M. Pandey, University of Waterloo General Procedure for Fault Tree Analysis from the U.S. Coast Guard Risk-based Decision-making Guidelines, Vol. 3 - Risk Assessment Tools Reference, Chapter 9 – Fault Tree Analysis (FTA) (http://www.uscg.mil/hq/g-m/risk/E-Guidelines/RBDMGuide.htm) Step 1. Define the system of interest. Specify and clearly define the boundaries and initial conditions of the system for which failure information is needed. Step 2. Define the top event for the analysis. Specify the problem of interest that the analysis will address (e.g. a specific quality problem, shutdown, safety issue, etc.). Step 3. Define the treetop structure. Determine the events and conditions (i.e., intermediate events) that most directly lead to the top event. Step 4. Explore each branch in successive levels of detail. Determine the events and conditions that most directly lead to each intermediate event. Repeat the process at each successive level of the tree until the fault tree model is complete. Step 5. Solve the fault tree for the combinations of events contributing to the top event. Examine the fault tree model to identify all the possible combinations of events and conditions that can cause the top event of interest. A combination of events and conditions sufficient and necessary to cause the top event is called a minimal cut set. Step 6. Identify important dependent failure potentials and adjust the model appropriately (qualitative common cause failure analysis). Study the fault tree model and the list of minimal cut sets to identify potentially important dependencies among events. Dependencies are single occurrences that may cause multiple events or conditions to occur at the same time. Step 7. Perform quantitative analysis (if necessary). Use statistical characterizations regarding the failure and repair of specific events and conditions in the fault tree model to predict future performance for the system. Step 8. Use the results in decision making. Use results of the analysis to identify the most significant vulnerabilities in the system and to make effective recommendations for reducing the risks associated with those vulnerabilities. Fault Tree Analysis – Page 6
  • 7. M. Pandey, University of Waterloo CIVE 240 – Engineering and Sustainable Development Rules of Fault Tree Construction a fault tree should only be constructed once the functioning of the entire system is fully understood objective is to identify all the component failures, or combinations thereof that could lead to the top event (Steps 2 - 4 above) after McCormick (1981) Rule 1. State the fault event as a fault, including the description and timing of a fault condition at some particular time. Include (a) what the fault state of that system or component is, (b) when that system or component is in the fault state. Test the fault event by asking (c) is it a fault? (d) is the what-and-when portion included in the fault statement? Rule 2. There are two basic types of fault statements, state-of-system and state-of-component. To continue the tree, (a) if state-of-system fault statement, use Rule 3 (b) if state-of-component fault statement, use Rule 4 Rule 3. A state-of-system fault may use an AND, OR, or INHIBIT gate or no gate at all. To determine which gate to use, the faults must be then (a) minimum necessary and sufficient fault events, (b) immediate fault events. Rule 4. A state-of-component fault always uses an OR gate. To continue, look for the primary, secondary, and command failure fault events. Then state those fault events. (a) primary failure is failure of that component within the design envelope or environment (b) secondary failures are failures of that component due to excessive environments exceeding the design environment (c) command faults are inadvertent operation of the component because of a failure of a control element Rule 5. No gate-to-gate relationships. Put an event statement between any two gates. Rule 6. Expect no miracles. Those things that would normally occur as the result of a fault will occur, and only those things. Also, normal system operation may be expected to occur when faults occur. Fault Tree Analysis – Page 7
  • 8. CIVE 240 – Engineering and Sustainable Development M. Pandey, University of Waterloo Rule 7. In an OR gate, the input does not cause output. If any input exists, the output exists. Fault events under the gate may be a restatement of the output events. Rule 8. An AND gate defines a causal relationship. If the input events coexist, the output is produced. Rule 9. An INHIBIT gate describes a causal relationship between one fault and another, but the indicated condition must be present. The fault is the direct and sole cause of the output when that specified condition is present. Inhibit conditions may be faults or situations, which is why AND and INHIBIT gates differ. Fault Tree Analysis – Page 8
  • 9. M. Pandey, University of Waterloo CIVE 240 – Engineering and Sustainable Development Example: (McCormick, 1981) Construct a fault tree for the simple electric motor circuit shown below. Switch Fuse Power Motor Supply Wire Solution: Step 1. Define the system of interest. Need to identify Intended Functions Physical Boundaries (to avoid overlooking key elements of a system at interfaces and penalizing a system by associating other equipment with the subject of the study) Analytical Boundaries (to limit the level of analysis resolution, to explicitly exclude certain types of events and conditions, such as sabotage, from the analysis) Initial Conditions, (including equipment that is assumed to be out of service initially, which affect the combinations of additional events necessary to produce a specific system problem) For this particular problem we have, Intended Function – the motor is used for some (unknown) purpose Physical Boundaries – power supply Analytical Boundaries – include all contributors in the above diagram Initial Conditions – switch closed, motor on Step 2. Define the top event. We are interested in the event that the motor fails to operate. Therefore, the top event is defined as Motor fails to operate Step 3. Construct the fault tree, starting from the top, i.e., define the treetop structure. Identify the main contributing events, including all events and scenarios that may cause the top event. Fault Tree Analysis – Page 9
  • 10. CIVE 240 – Engineering and Sustainable Development M. Pandey, University of Waterloo Step 4. Explore each branch in successive levels of detail, following the rules of fault tree construction. Motor fails to operate 1 Defect No current in motor to motor 2 Switch Wire Fuse fails Power open failure open supply (open) failure 3 4 Fuse Switch Switch failure under Fuse failure fails opened normal due to overload open erroneously conditions (open) Fuse fails 5 open Overload in circuit 6 Wire Power failure failure (shorted) (surge) Fault Tree Construction Gate 1. One primary failure event is the failure of the motor itself (for example, due to a wiring failure within the motor or loss of lubrication to the bearings). This event is a basic event because no details of the motor are given, therefore, the event cannot be developed further. The other possibility is the event that no current is supplied to the motor. Fault Tree Analysis – Page 10
  • 11. M. Pandey, University of Waterloo CIVE 240 – Engineering and Sustainable Development Gate 2. The event “No current in motor” is the result of other events and is therefore developed further. The lack of current to the motor can result from a broken connection in any of the other four components in the circuit, including the failure of the wire or power supply (basic events), the switch being open, or failure of the fuse. Gate 3. The open switch may be due to a basic failure of the switch, or the event that the switch was opened erroneously. The erroneous opening of the switch is due to human error, which could be developed further into more basic events (i.e. operator is inexperienced, under stress, etc.). However, due to insufficient information, the event is not explored further. This purposely undeveloped event is therefore denoted with the diamond symbol. Gate 4. The fuse failure event may be caused by fuse failure under normal conditions (primary failure) or due to overload from the circuit. Gate 5. The secondary fuse failure can occur if the fuse does not open every time an overload is present in the circuit (because all conditions of an overload do not necessarily result in sufficient overcurrent to open the fuse). This is why a conditional gate, denoted by the hexagon, is used. The condition, i.e. “Fuse fails open” is placed in the connecting oval, and the conditional gate is treated similarly to an AND gate in subsequent tree analysis. Gate 6. The overload in the circuit may be caused either by a short or a power surge, both of which are primary (i.e. basic) events. Considerations construction of a fault tree is subjective need to take into account Level of Detail – the number of basic events should be defined such that the size of the tree is reasonable with respect to the scope of the analysis Probability Assignment – need to stop development at the level where probability or failure data is available Meaningfulness – the level of detail should be such that the basic and undeveloped events correspond to the design aspects being analyzed Fault Tree Analysis – Page 11
  • 12. CIVE 240 – Engineering and Sustainable Development M. Pandey, University of Waterloo Fault Tree Evaluation identify critical events and event combinations that lead to the top event calculate the probability of the top event based on the probabilities of the basic and undeveloped events in the fault tree two types of analysis qualitative quantitative based on Boolean logic Boolean Algebra fault trees describe the relationships between events using Boolean logic a fault tree can be translated into an equivalent set of Boolean equations The OR Gate Represents the union of events at the gate. For event Q with two input events A and B attached to the OR gate, the probability is obtained as P (Q ) = P (A) + P (B ) − P (A ∩ B ) (1) or P (Q ) = P (A) + P (B ) − P (A)P (B | A) (2) If A and B are mutually exclusive events then P (A ∩ B ) = 0 and P (Q ) = P (A) + P (B ) (3) If A and B are independent events then P (B | A) = P (B ) and P (Q ) = P (A) + P (B ) − P (A)P (B ) (4) If event B is completely dependent on event A then P (B | A) = 1 and P (Q ) = P (A) + P (B ) − P (A)(1) = P (B ) (5) Therefore, the approximation of P (Q ) = P (A) + P (B ) (6) is always a conservative estimate for the probability of event Q (because P (A ∩ B ) is small compared with P (A) + P (B ) for very low probability events). Event Q will occur if any (at least) one of the input events to the OR gate occur. The AND Gate Represents the intersection of events at the gate. For event Q with two input events A and B attached to the AND gate, the probability is obtained as P (Q ) = P (A)P (B | A) = P (B )P (A | B ) (7) Fault Tree Analysis – Page 12
  • 13. M. Pandey, University of Waterloo CIVE 240 – Engineering and Sustainable Development If A and B are independent events then P (B | A) = P (B ) and P (A | B ) = P (A) therefore P (Q ) = P (A)P (B ) (8) If A and B are not independent, then Q may be significantly greater than P (A)P (B ) . Event Q is caused only if every (all) input event attached to the AND gate occur. Rules of Boolean Algebra Mathematical Notation Engineering Notation Designation X ∩Y = Y ∩ X X ⋅Y = Y ⋅ X Commutative Law X ∪Y = Y ∪ X X +Y = Y + X X ∩ (Y ∩ Z ) = (X ∩ Y ) ∩ Z X ⋅ (Y ⋅ Z ) = (X ⋅Y ) ⋅ Z Associative Law X (YZ ) = (XY )Z X ∪ (Y ∪ Z ) = (X ∪ Y ) ∪ Z X + (Y + Z ) = (X +Y ) + Z X ∩ (Y ∪ Z ) = (X ∩ Y ) ∪ (X ∩ Z ) X ⋅ (Y + Z ) = X ⋅Y + X ⋅ Z Distributive Law X (Y + Z ) = XY + XZ X ∪ (Y ∩ Z ) = (X ∪Y ) ∩ (X ∪ Z ) X + (Y ⋅ Z ) = (X +Y ) ⋅ (X + Z ) X ∩X = X X ⋅X = X Idempotent Law X ∪X = X X +X = X X ∩ (X ∪ Y ) = X X ⋅ (X + Y ) = X Law of Absorption X ∪ (X ∩ Y ) = X X + (X ⋅Y ) = X X ∩X = φ X ⋅X = φ Complementation X ∪X =Ω= I X +X = Ω= I X ∩Y = X ∪Y X ⋅Y = X + Y de Morgan’s Rule X ∪Y = X ∩Y X + Y = X ⋅Y φ∩X =φ φ⋅X = φ Operations with φ and Ω φ∪X = X φ+X = X Ω∩X = X Ω⋅X = X Ω∪X = Ω Ω+X = Ω φ =Ω φ =Ω Ω=φ Ω=φ X ∪ (X ∩ Y ) = X ∪ Y X + (X ⋅Y ) = X + Y Other relationships X ∩ (X ∪ Y ) = X ∩ Y X ⋅ (X + Y ) = X ⋅Y φ is the empty or null set which is equal to zero Ω or I is the universal set which is equal to one Fault Tree Analysis – Page 13
  • 14. CIVE 240 – Engineering and Sustainable Development M. Pandey, University of Waterloo Qualitative Analysis used for identifying critical events potential system weaknesses best ways to reduce the risk associated with the top event conducted using minimal cut sets Minimal Cut Sets The smallest combination of basic events which, if they occur, will cause the top event to occur. can be seen as a specific scenario that leads to the top event cut sets are combinations (intersections) of component failures sufficient for the top event the occurrence of all events in a minimal cut set is necessary for the occurrence of the top event, i.e. if one of the failures in a cut set does not occur, then the top event will not occur (by this combination) there are a finite number of minimal cut sets for each fault tree, which are unique for the top event one-component minimal cut sets represent failures which will cause the top event to occur the minimal cut sets for a fault tree are obtained by translating the tree to its equivalent Boolean equations (assume that events are independent) using top-down or bottom-up substitution using the Distributive Law and Law of Absorption to remove redundancies Criticality the importance of each minimal cut set can be based on its relative contribution to the total probability of the top event the minimal cut sets for a fault tree can be used to identify the most critical basic events using the following criteria minimal cut sets that include a small number of events represent less redundancy and so have higher criticality events that appear on a large number of minimal cut sets are more important because they can contribute to the top event in several scenarios must also consider the relative probabilities of each of the events the importance of each event can be based on the total probability of the cut sets to which the basic event contributes (i.e. represents the total probability of failure involving the event) Fault Tree Analysis – Page 14
  • 15. M. Pandey, University of Waterloo CIVE 240 – Engineering and Sustainable Development Example: Determine all the minimal cut sets for the small motor problem. Solution: Let T denote the top event Let P denote primary events (circles) Let G denote intermediate events (rectangles) Let S denote undeveloped events (diamonds) Let C denote conditioning events (ovals) T Therefore + T = motor fails to operate P1 = defect in motor G1 P1 P2 = wire failure (open) P3 = power supply failure + P4 = switch fails open P5 = fuse failure under normal G2 P2 G3 P3 conditions (open) + + P6 = wire failure (shorted) P7 = power failure (surge) P4 S1 G4 P5 G1 = no current to motor x C1 G2 = fuse fails open G3 = switch open G5 G4 = fuse failure due to overload + G5 = overload in circuit S1 = switch opened erroneously P6 P7 C1 = fuse fails to open Writing equations for each gate of the tree T = P1 + G1 (9) G1 = P2 + P3 + G2 + G3 (10) G2 = P4 + S1 (11) G3 = G4 + P5 (12) G4 = C1 · G5 (13) G5 = P6 + P7 (14) Using the top-down approach we get by substitution T = P1 + G1 (15) = P1 + P2 + P3 + G2 + G3 (15.1) = P1 + P2 + P3 + P4 + S1 + G3 (15.2) = P1 + P2 + P3 + P4 + S1 + G4 + P5 (15.3) = P1 + P2 + P3 + P4 + S1 + (C1 · G5) + P5 (15.4) = P1 + P2 + P3 + P4 + S1 + P5 + C1 · (P6 + P7) (15.5) = P1 + P2 + P3 + P4 + S1 + P5 + (C1 · P6) + (C1 · P7) (15.6) The top event, therefore, contains 6 single component minimum cut sets and 2 double component minimum cut sets. Fault Tree Analysis – Page 15
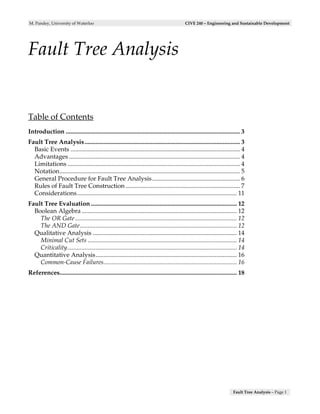
  • 16. CIVE 240 – Engineering and Sustainable Development M. Pandey, University of Waterloo Quantitative Analysis calculate the probability of occurrence of the top event, given the fault tree and the probability of occurrence of the basic events common approaches include assume all basic events are independent assume the probabilities of basic events are small (rare-event approximation) if each basic event on the fault tree occurs only once, then the tree branches emanating from any given gate in the tree are independent the probability of the top event is given by the probability of the union of the minimum cut sets results in a conservative estimate of the probability of failure Common-Cause Failures Multiple failures originating from a common cause that fails the system. the basic events may not always be independent failure events can be caused by a common environment or have factors in common (e.g. an operator has miscalibrated all sensors) common causes often arise from factors such as manufacturer, environment, energy sources, and humans the evaluation of probabilities will require conditional or joint probabilities Example: Calculate the probability of occurrence of the top event for the simple motor example. Assume the probability of occurrence of each basic event is equal to 0.01 and the probability of the event S1 “Switch opened erroneously” is equal to 0.001. Also assume that the condition C1 “Fuse fails open” has a probability of occurrence of 0.50. Solution: Using the same notation as before we are given Event Description Probability P1 Defect in motor 0.01 P2 Wire failure (open) 0.01 P3 Power supply failure 0.01 P4 Switch fails open 0.01 P5 Fuse failure under normal conditions (open) 0.01 P6 Wire failure (shorted) 0.01 P7 Power failure (surge) 0.01 S1 Switch opened erroneously 0.001 C1 Fuse fails open 0.50 Fault Tree Analysis – Page 16
  • 17. M. Pandey, University of Waterloo CIVE 240 – Engineering and Sustainable Development The probability of intermediate events can be evaluated using the fault tree. The probability of the top event is given by the union of the minimum cut sets determined before as T = P1 + P2 + P3 + P4 + S1 + P5 + (C1 · P6) + (C1 · P7) (16) = 0.01 + 0.01 + 0.01 + 0.01 + 0.001 + 0.01 + (0.50)(0.01) + (0.50)(0.01) (16.1) = 0.061 (16.2) 0.061 + 0.01 0.051 + 0.011 0.01 0.02 0.01 + + 0.01 0.001 0.01 0.01 x 0.50 0.02 + 0.01 0.01 Fault Tree Analysis – Page 17
  • 18. CIVE 240 – Engineering and Sustainable Development M. Pandey, University of Waterloo References McCormick, N.J. 1981. Reliability and Risk Analysis: Methods and Nuclear Power Applications. Academic Press, New York. United States Coast Guard. 2004. Risk-based Decision-making (RBDM) Guidelines (3rd Ed.), Vol. 3 – Risk Assessment Tools Reference, Chapter 9 – Fault Tree Analysis. (http://www.uscg.mil/hq/g-m/risk/E-Guidelines/RBDMGuide.htm) United States Nuclear Regulatory Commission (NRC). 1981. Fault Tree Handbook. NUREG-0492. Systems and Reliability Research Office of Nuclear Regulatory Research, Washington, D.C. (http://www.nrc.gov/reading-rm/doc-collections/nuregs/staff/sr0492/sr0492.pdf) Fault Tree Analysis – Page 18