1. TechnicalInformation
qPCR Array data analysis web portal
For quick and simple analysis of any qPCR data
QIAGEN’s qPCR data analysis web portal provides the capability to analyze any qPCR data. Starting with raw CT values
from any SYBR® Green or hydrolysis-probe based qPCR assay, scientists can quickly upload data, normalize, and export
biologically relevant fold-change data and multiple graphs in as little as 15 minutes.
Visit the web portal here:
http://pcrdataanalysis.sabiosciences.com/pcr/arrayanalysis.php
Seven steps to easier analysis
Benefits of using QIAGEN‘s qPCR data analysis web portal:
1. Choose experiment that was performed
„„ Reliable conversion of any qPCR CT values into fold changes
„„ Fold changes include p-value and 95% confidence intervals
„„ Automatic housekeeping gene recommendation and selection
„„ Multiple graph formats to visualize data
(Figure 1).
2. Upload the Microsoft® Excel® file
containing your PCR data with a
maximum number of 100 samples.
3. Input information into the “Analysis
„„ Suggestions for future experiments
setup” page.
4. See the “Average ΔCT”, “2^(−ΔCT)”, “Fold
Step 6
Change”, “p-value”, and “Fold Regulation”
sections for the results processed by the
software from your data.
Step 1
Step 3
Step 4
5. Create the plots and charts you need
Step 5
(Figures 2–4), including:
Step 2
Step 7
Heat map
Scatter plot and volcano plot
Clustergram
Multigroup plot
6. Click “Export data” to download a
Microsoft Excel file containing all raw
and processed data from the “Readout”
and “Analysis Results” sections.
7. On the “What’s Next” page, explore
experimental solutions for identifying
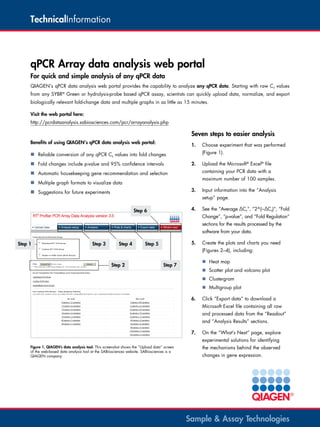
Figure 1. QIAGEN’s data analysis tool. This screenshot shows the ”Upload data” screen
of the web-based data analysis tool at the SABiosciences website. SABiosciences is a
QIAGEN company.
the mechanisms behind the observed
changes in gene expression.
Sample & Assay Technologies