1. Technical Note
Bio-Rad iCycler & iQ Real-Time PCR Systems
(for Software Version 3.1)
Instrument Setup Instructions for RT2Profiler™ PCR Arrays
Preparation
Before the Experiment (Presetting the Machine will save time for your run):
Please make sure that a pure dye calibration has been performed for SYBR Green I for your system. Please
refer to the manufacturer’s Instruction Manual for the pure dye calibration procedures if needed.
Set up a PCR Protocol template file and a Plate Setup template file on the iCycler iQ software as follows:
1) Open the iCycler iQ Optical System Software Version 3.1 on the computer that is connected to the Bio-Rad
iCycler iQ Real-time PCR Detection system.
2) Click on the Library module on the left panel. Select the View Protocol tab. Under Protocol Files, select
2StepAmp+Melt.tmo. Click Edit This Protocol on the right; this will open the Edit Protocol tab in the
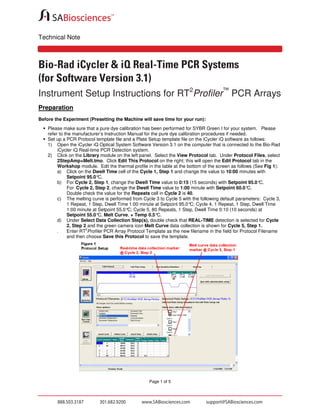
Workshop module. Edit the thermal profile in the table at the bottom of the screen as follows (See Fig 1):
a) Click on the Dwell Time cell of the Cycle 1, Step 1 and change the value to 10:00 minutes with
Setpoint 95.0°
C.
b) For Cycle 2, Step 1, change the Dwell Time value to 0:15 (15 seconds) with Setpoint 95.0°
C.
For Cycle 2, Step 2, change the Dwell Time value to 1:00 minute with Setpoint 60.0°
C.
Double check the value for the Repeats cell in Cycle 2 is 40.
c) The melting curve is performed from Cycle 3 to Cycle 5 with the following default parameters: Cycle 3,
1 Repeat, 1 Step, Dwell Time 1:00 minute at Setpoint 95.0° Cycle 4, 1 Repeat, 1 Step, Dwell Time
C;
1:00 minute at Setpoint 55.0° Cycle 5, 80 Repeats, 1 Step, Dwell Time 0:10 (10 seconds) at
C;
Setpoint 55.0° Melt Curve, + Temp 0.5°
C,
C.
d) Under Select Data Collection Step(s), double check that REAL-TIME detection is selected for Cycle
2, Step 2 and the green camera icon Melt Curve data collection is shown for Cycle 5, Step 1.
2
Enter RT Profiler PCR Array Protocol Template as the new filename in the field for Protocol Filename
and then choose Save this Protocol to save the template.
e)
Page 1 of 5
2. Technical Note
3)
To set up a template file for Plate Setup, click on the Library module on the left panel and then select the
View Plate Setup tab; click Create a New Plate Setup on the right. This will open the Edit Plate Setup
tab in the Workshop module. Choose the Whole Plate mode. In the Samples: Whole Plate Loading tab
(See Figure 2), click to select the icon for Unknown. In the diagram of the 96-well plate, click on each well
one at a time to designate the sample type as Unknown and number the well.
4)
When finished loading samples, click on Select and Load Fluorophores (See Figure 3). Select SYBR490 as the fluorophore by clicking the box next to the fluorophore in the Select or Deselect a Fluorophore
box. Assign a color for SYBR-490 by clicking on one of the crayons. With the SYBR-490 crayon
selected, load fluorophore to all wells by clicking the top left corner of the plate to select all wells at once.
2
Enter RT Profiler™ PCR Array Plate Setup Template as the new filename in the Plate Setup Filename
box and click Save this plate setup to save the file as a *.pts file.
2
Alternatively, download the PCR protocol template file (RT Profiler™ PCR Array Protocol Template2
BioRad.tmo) and plate setup template file (RT Profiler™ PCR Array Plate Template-BioRad.pts) from
SABiosciences website http://www.SABiosciences.com/home.php.
Page 2 of 5
3. Technical Note
Performing Real-Time PCR Detection
1)
2)
3)
4)
5)
If the thermocycler is off, turn on the iCycler and log onto the instrument. Allow the camera to warm up for
30 minutes, then switch on the computer connected to the thermocycler.
Ensure the reaction mix in each well of your reaction plate is free of any bubbles and positioned at the
bottom of the well. If not, centrifuge the plate at ~1000 x g for 45 seconds.
Open the thermocycler cover to expose the thermal block. Place your plate in the plate holder with the last
row (row H) facing front. Well A1 should be positioned at the top-left corner of the holder. Close the cover.
Open the iCycler iQ Optical System Software.
In the Library module, click to open the View Protocol tab. Under Protocol Files, click to highlight and
2
load the previously saved RT Profiler™ PCR Array Protocol Template file. Then click to open the View
2
Plate Setup tab; under Plate Setup Files, click to highlight and load the RT Profiler™ PCR Array Plate
Setup Template file. Click Run with Selected Protocol to initiate the run with the selected plate setup
and indicated protocol. This will lead you to the Run Prep tab in the Workshop module (See Figure 4).
Enter the reaction volume (25 µL) for the Sample volume. Select Experimental Plate under Select
Well Factor Source. When ready, click on Begin Run. A Save dialog box will open. Enter a name for the
optical data file (*.opd).
Page 3 of 5
4. Technical Note
After the PCR Run
1)
2)
3)
Select the Library module and click on the View Post-Run Data tab. Select a data file and click Analyze
Data on the right under Data Analysis Operations. The data file will open in the PCR Quantification tab
of the Data Analysis module. Select PCR Base Line Subtracted Curve Fit in the field for Select
analysis mode.
Choose SYBR-490 in the Select a Reporter box.
Follow the procedures below to calculate the threshold cycle (Ct) for each well (See Figure 5):
(We highly recommend manually setting the Baseline and Threshold Values)
a) To define the Baseline, use the linear view of the amplification plots by clicking the Normal View
button right above the graph. If the graph is already in the linear scale, the Log View button will
appear instead. With the linear plots, determine the cycle number at which the earliest amplification
can be seen. Under Threshold Cycle Calculation, select User Defined for Baseline Cycles and set
the baseline to start from cycle number 2 through two cycle values before the earliest visible
amplification.
b) To define the Threshold Value, use the Log View of the amplification plots. Select User Defined for
Threshold Position. With the log plots, place the threshold line above the background signal but
within the lower third of the linear phase of the amplification plot. Click Recalculate Threshold Cycles
to update threshold cycle values.
Page 4 of 5
5. Technical Note
4)
5)
6)
Click on the Melt Curve tab of the Data Analysis module to view the melting curves.
Click on the Reports button to obtain the customized reports of the PCR quantification data, the window for
Report Viewer will open. On the left panel under Select Report, select to view Melt and Amp Data. To
save the report, select Save to File, and enter a filename for the report to be saved in the Rich Text Files
format.
Close the Report Viewer window, and check the Open/Save Settings and select Save OPD File to save
the data file with the current analysis parameters.
Page 5 of 5