Design a blended learning environment
•Transferir como DOC, PDF•
0 gostou•592 visualizações


Recomendados
Recomendados
Mais conteúdo relacionado
Destaque
Destaque (16)
Mais de SAITO College Sdn Bhd
Mais de SAITO College Sdn Bhd (20)
Último
Último (20)
Design a blended learning environment
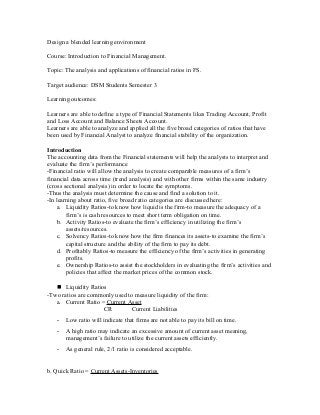
- 1. Design a blended learning environment Course: Introduction to Financial Management. Topic: The analysis and applications of financial ratios in FS. Target audience: DSM Students Semester 3 Learning outcomes: Learners are able to define a type of Financial Statements likes Trading Account, Profit and Loss Account and Balance Sheets Account. Learners are able to analyze and applied all the five broad categories of ratios that have been used by Financial Analyst to analyze financial stability of the organization. Introduction The accounting data from the Financial statements will help the analysts to interpret and evaluate the firm’s performance -Financial ratio will allow the analysis to create comparable measures of a firm’s financial data across time (trend analysis) and with other firms within the same industry (cross sectional analysis) in order to locate the symptoms. -Thus the analysis must determine the cause and find a solution to it. -In learning about ratio, five broad ratio categories are discussed here: a. Liquidity Ratios-to know how liquid is the firm-to measure the adequacy of a firm’s is cash resources to meet short term obligation on time. b. Activity Ratios-to evaluate the firm’s efficiency in utilizing the firm’s assets/resources. c. Solvency Ratios-to know how the firm finances its assets-to examine the firm’s capital structure and the ability of the firm to pay its debt. d. Profitably Ratios-to measure the efficiency of the firm’s activities in generating profits. e. Ownership Ratios-to assist the stockholders in evaluating the firm’s activities and policies that affect the market prices of the common stock. Liquidity Ratios -Two ratios are commonly used to measure liquidity of the firm: a. Current Ratio = Current Asset CR Current Liabilities - Low ratio will indicate that firms are not able to pay its bill on time. - A high ratio may indicate an excessive amount of current asset meaning, management’s failure to utilize the current assets efficiently. - As general rule, 2/1 ratio is considered acceptable. b. Quick Ratio = Current Assets-Inventories
- 2. QR Current Liabilities -inventories are excluded from current assets because inventories are the least liquid assets because inventories take longer time to be converted into cash. -as general rule 1/1ratio is considered reasonable c. Cash Ratio = Cash + Marketable Securities CR Current Liabilities -the use of current and quick ratios implicitly assumes that all the current assets will be converted to cash. -in reality, firms do not liquid their current assets to pay their current liabilities. -minimum levels of inventories and receivables are always needed to keep the operation going if not the firms are seemed to cease operation. -therefore, cash ratio helps to measure the actual cash resources of a firm. Activity Ratios -these ratios measure how efficient the firm is managing its resources. -it is also known as turnover ratios because it involve with sales and all assets of the firm a. Receivables Ratio -these ratios indicate mode of selling and effectiveness of collection: Accounts receivable turnover = Sales (ARTO) Account Receivable Average collection period = 365 acp ar turnover -accounts receivable turnover has to be compared to the firm’s sales with its uncollected bills from the customers as a result of credit sales. -high ratio indicates that the firm has more cash sales than credit sales and low ratio may indicate that the firm has more credit sales and or an increased in uncollected bills. -average collection period determines how many days on average the firm can collect its bill from customers. -more days than the agreed credit period could indicate slow collection and vice versa. b. Inventory Turnover Ratios -These ratios indicate the effectiveness of inventory management. Inventory Turnover = Cost of Goods Sold (ITO) Inventory -inventory turnover determines how many times the inventory could be turned into finished goods. -high ratios indicate the effectiveness of management in managing its inventory and vice versa. c. Assets Turnover Ratio
- 3. -it measures the effectiveness of management in utilizing all the firm’s assets which indicates the amount sales generated for every dollar invested into assets. Total Assets Turnover = Sales (TATO) Total Assets -Eg if the answer is 0.25 times, meaning that the firm is able to generate rm0.25 of sales for every rm1 invested in total assets -whether good or not, its depend on past year’s or its competitor total assets turnover. Solvency Ratios -these ratios determine the relationship between debt and equity components of the firm’s assets. -that is, it indicate how much of the firm’s assets are financed by debt and equity and as indication for future prospects financing and financial risk of the firm. -if the ratios are too high, the firm has difficulty in additional debt financing. -as general, the debt should not exceed 50% of the total sources fund. Debt Ratio = Total Debt (DR) Total Assets Debt Equity Ratio = Total Debt (DTE) Total equity Time Interest Earned = Operating Income (TIE) Interest -in term of an obligation, times interest earned provides an indication of the firm’s ability in servicing its interest payment to its lenders. -high ratio means that the firm’s paying ability is good and vice versa. Profitability Ratios -profitability is the ability of a firm to generate earning or income from the used of assets, sales or investments. -this ratio is important to: 1. Stockholders for receiving dividends increase in market price that leads to capital gain. 2. Creditors as a measure of ability and capacity of debt coverage. 3. Management as a measure of performance for the firm Gross Profit Margin = Gross Profit (GPM) Sales Operating Profit Margin = EBIT (OPM) Net Profit Margin = Net Income (NPM) Sales -high profit margin will indicate that the firm is reducing its costs or increasing its selling price or increasing its sales or vice versa. Return on Total Assets = Net Income
- 4. (ROTA) Total Asset -the ratio will indicate that the return generated for every dollar invested in total assets. Return on Total Equity = Net Income Total Equity -it measures the return to both common and prefered stockholders on every dollar that they invested in the firm Ownership Ratios -the ratio will help the shareholders to analyze the present and future investment in a firm. Earning Per Share = Net Income (EPS) No of common Shares outstanding Price Earning Ratio = Market Price Per Share (P/E Ratio) EPS -EPS is the ratio refers to an earning that might be available in a form of dividend to the common shareholders or the growth in the firm’s earnings. -P/E ratio is the ratio that measure used by the investors in making stock purchases. -If the stock has low P/E multiple then the stock is under valued and high P/E multiple it is considered as overvalued. Dividend Per Share = Dividend Payment (DPS) Number of Sales Dividend Payout Ratios = Dividend Per Share (DPR) Earnings Per Share Dividend Yield = Dividend Per Share DY Market Price Per Share -DPS is the total dividend payment per share which indicates an amount of cash to be received by a shareholder for every share held. -DPR is the percentage of the firm’s earnings being allocated to dividend payment. DY is the current return to investor as a percentage of his or her investment. Book Value Per Share (BVPS) -this ratio is equal to stockholders equity divided by number of shares outstanding. BVPS= Equity Stockholder Number of shares outstanding -the book value is a benchmark for the price of the common stock. If the market price is below the book value, then the stock is undervalued stock. Dividend Ratios -these ratios are concerned about payment or cash dividends.
- 5. -As such, low dividend declared, means unattractive to investors and high dividend payment will result inadequate funds to finance future growth. Intended LO Teaching Learning Activities Online Teaching Learning Activities (F2F/Onsit e) Assessme nt Tasks Online Assessme nt Tasks Online/F2 F 1) Learners are able to define a type of Financial Statements likes Trading Account, Profit and Loss Account and Balance Sheets Account. http://www.answers.com/topic/fina ncial-statement-analysis http://video.answers.com/financial- analysis-using-excel-part-1- 35728826 1) Learners are required to browse at the link given in order them to have the clear picture of the Financial Statements. 2) Learners also introduce to the video on the variety of financial analysis techniques. 3) Learners are advised to download financial statements from the Blue Chips Company websites eg: Telekom Berhad, TNB, Maybank and others. Lecturing base on notes using the Power point slide given on concept of Financial analysis definition, financial ratios techniques and its application s Learners are given Pop Quiz on topics Financial ratio and analysis based on the websites given. Answer for Pop Quiz will be discuss among peers. Lecturer act as moderator and facilitator. 2) Learners are able to analyze and applied all the five Based on the websites, learners are able to pick up all necessary information on the financial ratios analysis. Lecturers note are given based on the books such as Learners will be given a task on the usage of the Learners will be given tutorial base on the real
- 6. broad categories of ratios that have been used by Financial Analyst to analyze financial stability of the organizatio n. introductio n to Corporate Finance, Financial Manageme nt and other relevant financial journal. financial ratios discussed based on their download ed FS. applicatio ns of Financial Statement s
- 7. broad categories of ratios that have been used by Financial Analyst to analyze financial stability of the organizatio n. introductio n to Corporate Finance, Financial Manageme nt and other relevant financial journal. financial ratios discussed based on their download ed FS. applicatio ns of Financial Statement s