
Recomendados
Mais conteúdo relacionado
Mais procurados
Mais procurados (20)
Semelhante a Lesson4 effectsoil&gas20110311
Semelhante a Lesson4 effectsoil&gas20110311 (20)
Mais de Edie Barbour
Mais de Edie Barbour (12)
Lesson4 effectsoil&gas20110311
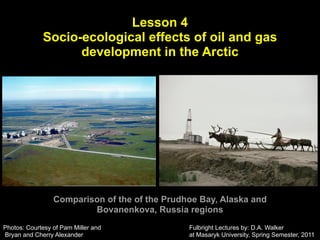
- 1. Lesson 4 Socio-ecological effects of oil and gas development in the Arctic Comparison of the of the Prudhoe Bay, Alaska and Bovanenkova, Russia regions Photos: Courtesy of Pam Miller and Fulbright Lectures by: D.A. Walker Bryan and Cherry Alexander at Masaryk University, Spring Semester, 2011
- 2. Overview of lecture • Expected changes in anthropogenic footprint in the Arctic (UNEP GLOBIO, 2004). • Review of the National Research Council (NRC) report of the cumulative effects of oil and gas development on the Alaska Arctic Slope. • Methodology for GIS analysis of historical geobotanical changes in the Prudhoe Bay field, Walker et al. 1986, 1987. • Socio-ecological effects of gas development on the Yamal Peninsula, Russia: Forbes et al. 2010; Walker et al. 2011.
- 3. The Arctic has received a lot of press lately due to climate change and retreating sea ice. Projected increases in winter Sep 2010 sea-ice extent compared to temperatures for about 2090 1979-2000 mean (NSIDC 2011). (ACIA 2004).
- 4. •A related issue for many living in the Arctic is the pressure to develop the natural resources of the Arctic. The cumulative impacts of issues related to natural resource development are viewed by the Nenets people of the Yamal Peninsula in Russia as a greater threat to their livelihood than climate change. GLOBIO, Vital Arctic Graphics: http://www.grida.no/publications/vg/arctic/
- 5. Present and projected (2032) impacted areas in the Arctic (UNEP 2004) • Some estimates (UNEP, 2001) project that perhaps as much as 80 percent of the Arctic land area will become impacted by development by 2050 if current trends continue.
- 6. Projected development in the Mackenzie River corridor, Canada • Example of the types of change that are imminent in many gas basins of the Arctic.
- 7. Protected areas in the Arctic • Compared to other biomes the Arctic is relatively well protected. • Areas of primary concern are the coastal areas. Only 7% of the coasts are currently impacted, • Only 1% are protected. These could be highly threatened by increased tanker traffic, industrial development, and new fisheries.
- 8. Alaska North Slope region • 230,000 km2 about = Romania or about 3 x Czech Republic. • Population in 2001 = 7,555. • Naval Petroleum Reserve 4 (now NPR-A) explored in the 1960s with only minor finds of oil and gas. • ANWR set aside as wilderness except for 1002 Area. • Currently producing about 7 billion bbl of oil (7% of the annual domestic U.S. consumption in 2001), mostly on State of Alaska land.
- 9. Discovery of oil at Prudhoe Bay • 1967: Discovery of Prudhoe Bay field. Alaska and Polar Regions Collections, Elmer E. Rasmuson Library, University of Alaska Fairbanks.
- 10. Wildcat oil rig exploring for new oil fields Very similar to the oil rig I worked on in 1969. Alaska and Polar Regions Collections, Elmer E. Rasmuson Library, University of Alaska Fairbanks.
- 11. All equipment was initially flown in or towed by tractors over snow and ice roads. In 1968 there was virtually no roads on the North Slope of Alaska. Alaska and Polar Regions Collections, C-130 Hercules at Prudhoe Bay Elmer E. Rasmuson Library, University of Alaska Fairbanks.
- 12. North Slope oil and gas production units, roads and pipelines in 2001. • 1969: Discovery of Kuparuk, West Sak & Milne Point fields. • 1971: Alaska Native Claims Settlement Act. • 1974: Dalton Highway • 1977: Trans-Alaska Pipeline. • 1970s-1980s: Rapid expansion of exploration and development.
- 13. Trans-Alaska pipeline • 1287 km. • Oil takes 12 days to travel from Prudhoe Bay to Valdez. • Aboveground pipeline mode in areas of ice-rich permafrost. • Passive refrigeration fins and ammonia cool the permafrost in winter.
- 14. Construction of Trans-Alaska • 1974-1977. • Buried under rivers and areas with non-ice rich permafrost
- 15. First required construction of Dalton Highway. • 667 km from Livengood to Prudhoe Bay. • Constructed in one year! 1974.
- 16. Main resource for Alaska NRC, 2003, Cumulative environmental effects of oil and gas activities on Alaska's North Slope: Washington, DC, The National Academic Press, p. 304.
- 17. Main resource for Yamal Forbes, B.C., Stammler, F., Kumpula, T., Meschtyb, N., Pajunen, A., and Kaarlejärvi, E., 2009, High resilience in the Yamal- Nenets social-ecological system, west Siberian Arctic, Russia: Proceedings of the National Academy of Sciences, v. 106, p. doi: 10.1073/iti5209106, 22041-22048. And other papers resulting from the ENSINOR project
- 18. Statement of task for the NRC report
- 19. Definition of cumulative effects Cumulative impacts are the result of incremental impacts of the actions that when added to other past, present, and reasonably foreseeable future actions result in individually minor but collectively significant actions taking place over a period of time. Council on Environmental Quality 1978 Generally, the cumulative effects cannot be predicted by simply adding the effects of all known impacts. Approach used here expands the definition to include the simultaneous and interactive effects of developing many gas and oil fields and other ongoing social and ecological factors such as population growth and climate change.
- 20. Some types of cumulative effects Space crowding—high density of effects on a single environmental medium, such as a concentration of drilling pads in a small region so that the areas affected by individual pads overlap. Compounding effects—synergistic effects attributable to multiple sources or interaction of natural and anthropogenic effects, such as the Exxon Valdez oil spill and El Niño events. Thresholds—effects that become qualitatively different once some threshold of disturbance is reached, such as when eutrophication exhausts the oxygen in a lake, converting it to a different type of lake. Nibbling—progressive loss of habitat resulting from a sequence of activities, each of which has fairly innocuous consequences, but the consequences on the environment accumulate.
- 21. Documenting history of exploration 1969: • 1968: Discovery of Prudhoe Bay field • 1969: Discovery of Kuparuk, West Sak & Milne Point fields. • 1970-80s: Exploration and expansion mainly in areas around Prudhoe Bay. • 1990s: Expansion into NPR-A and south of the Prudhoe Bay. • 2000s: Rapid expansion of leases in the Arctic Foothills, mainly gas exploration.
- 22. And potential future impacts: Strip mining of coal and/ or development of coal-bed methane deposits.
- 23. Schematic of oil field operations
- 24. Complex of roads, pipelines, production facilities, contractor service centers, but no permanent population Total area affected is about 2,600 km2 (about the size of Rhode Island or Luxumborg).
- 25. Complete aerial image history of development • The area presents a unique opportunity to examine the conversion from a remote wilderness in 1968 to an sprawling industrial complex in 2011. • The entire history is contained in aerial photographs and remote sensing images spanning the period 1949 to the present. NASA CIR aerial photo.
- 26. Aeromap Inc. GIS study: documenting changes in infrastructure area, length of roads and number of facilities NRC 2003
- 27. Growth of Prudhoe Bay infrastructure (1968-2001) 1968 1973
- 28. Growth of Prudhoe Bay infrastructure (1968-2001) 1983 2001
- 29. Growth of Prudhoe Bay infrastructure, 1968-2001 Length of Roads Areas of gravel placement Area of direct disturbances* * Observable at 1:24,000 scale Na#onal Research Council 2003
- 30. Direct impacts (infrastructure) of North Slope oil development in 2001 Gravel roads (km) 400 Pipelines (km) 450 Powerlines (km) 219 Produc<on pads (count) 115 Airstrips (count) 4 Culverts (count) 1395 Bridges (count) 17 Gravel area (km2) 37.5 Gravel mines 25.7 Off‐shore gravel 0.6 Other impacted areas 7.1 Total directly impacted area: 70.2 km2
- 31. Documenting changes to natural ecosystems
- 32. Ten largest oil spills on North Slope Public perception is that this is a big problem, but study documented relatively few spills, none covering large areas.
- 33. Indirect landscape impacts (i.e., those that were not planned) Integrated geobotanical and historical disturbance mapping
- 34. Key papers describing the approach and results of the cumulative impacts analysis at Prudhoe Bay Walker, D.A., Webber, P.J., Walker, M.D., Lederer, N.D., Meehan, R.H., and Nordstrand, E.A., 1986, Use of geobotanical maps and automated mapping techniques to examine cumulative impacts in the Prudhoe Bay Oilfield, Alaska: Environmental Conservation, v. 13, p. 149-160. Walker, D.A., Webber, P.J., Binnian, E.F., Everett, K.R., Lederer, N.D., Nordstrand, E.A., and Walker, M.D., 1987, Cumulative Impacts of Oil Fields on Northern Alaskan Landscapes: Science, v. 238, p. 757-761.
- 35. Road-related impacts • Thermokarst • Gravel spray from road. • Road dust.
- 36. Road- related impacts • Roadside flooding, mainly in drained thaw-lake basins related to lack of culvert problems.
- 37. Areas of detailed mapping at Prudhoe Bay
- 38. Flow chart of IGHDM methods
- 39. Geobotanical codes
- 41. Historical changes to impoundments
- 42. Comparison of direct and indirect impacts within Map 22 Solid lines: Direct impacts Dashed lines: Indirect impacts.
- 43. Hectares of impacted tundra in each vegetation type compared to natural vegetation distribution • Flooding focuses in Natural distribution aquatic sedge marsh (Type 3), often eliminating microhabitats used by shorebirds and waterfowl for nest sites. Flooded distribution • Gravel placement selects for moist sedge, dwarf- shrub, moss tundra (Type 41), a preferred habitat for for some species of shorebirds and relatively uncommon. Gravel placement distribution Wet to dry vegetation types
- 44. New tool for assessing cumulative effects: High- resolution satellite imagery Quickbird image of Prudhoe Bay development. Thermokarst in Nuiqsut village.
- 45. New planned road to access Nuiqsut and NPR-A / Foothills Oil&Gas The State of Alaska is working with the oil industry and NSB to define a staged construction road project that would accelerate: • Oil and gas exploration and production in NPR-A • Open exploration on foothills leases now largely inaccessible. • A new NPR-A staging area near Nuiqsut – The project would also provide Nuiqsut access to Dalton Highway for fuel and freight transport.
- 46. Winter seismic operations • Methods of seismic exploration changed dramatically in the 1990s when 2-dimensional seismic (linear lines of data) was replaced by 3-D seismic (volumetric pictures of the stratigraphy). • 3-D seismic requires much denser networks of seismic lines spaced a few hundred meters apart. Courtesy of Janet Jorgenson
- 47. Aerial views of seismic trails 2-D Seismic trails winter 2001: Photographed summer 2001. Camp move trails 1985: Photographed 1995. 15% of trails made in 1984 were still visible in 1995. Courtesy of Janet Jorgenson
- 48. Ground views of seismic Courtesy of Janet Jorgenson
- 49. Percent of trails in disturbance categories vs. years since disturbance SOURCES: Data from Felix et al. 1992; Emers et al. 1995; FWS, unpublished, 2002.
- 50. Hypothetical cumulative line miles of seismic trails in the 4 disturbance levels 1990-2001
- 51. Opening and closing dates for seismic operations, North Slope Regulations require the tundra to be sufficiently froze to support heavy seismic equipment and to be sufficiently snow covered to avoid damage. Season for seimic exploration has become progressively shorter. Possibly due to a combination of changing climate and/or changes in monitoring methods.
- 52. Documenting effects on wildlife Post-calving caribou, Arctic Coastal Plain. Photo: Ken Whitten
- 53. North Slope caribou herds
- 54. Relative post-calving herd sizes PCH, WAH, CAH and TLH (1976-2001) • Most North Slope caribou herds (except for the Porcupine herd) grew during the period of Prudhoe Bay development.
- 55. Roads and pipelines in the Prudhoe Bay region Main area of intensive Prudhoe Bay development
- 56. Locations of radio collared caribou during the study
- 57. Collar data show few caribou utilizing the Prudhoe Bay area after 1980. Main area of Prudhoe Bay development • By 1978, caribou use of the main Prudhoe Bay area had declined by 78% and lateral movements had declined by 90%.
- 58. Birthing rates of CAH caribou related to insect activity • East area is outside the oilfield. • West area is within the oil field. • Effect of the oilfield on parturition rates is greatest in years of high insect activity. oil-field development, by delaying or deflecting.
- 59. Major conclusions from the caribou portion of the NRC report • Current technology will probably • Unless future requirements for continue to evolve, as discussed infrastructure can be greatly elsewhere in this report, but reduced, exploitation of oil and adverse effects on caribou are likely to increase with both the density of gas reserves within the calving infrastructure development and the and summer ranges of the CAH, area over which it is spread. TLH, and PCH will likely have similar consequences. • Radio-collared female caribou west of the Sagavanirktok River shifted their calving concentration area from developed areas nearer the coast to undeveloped areas inland. No such shift has occurred for caribou calving east of the Sagavanirktok River where there is no development.
- 60. Documenting social effects of oil development: Shift in lifestyles from exclusively subsistence hunting to providing services and government zPhotos (from left): David Policansky, Ken Stenek, Larry Moulton.
- 61. Seasonal subsistence cycle at Barrow and Anaktuvuk Pass
- 62. Effects of development on employment Major oil and gas resources in the Arc3c Employments in thousands
- 63. Effects of oil on North Slope Borough, Alaska per capita income Per capita income 1999: NSB (average): $20,540. Arctic Village (outside NSB): $10,761.
- 64. Growth of North Slope population (1939-1998) • North Slope population increased 6x between 1939 and 1998. • Barrow increased nearly 13x, probably due to Naval Research Lab in the 1950-1973 • It about doubled during the period 1973-1998.
- 65. North Slope Borough employment by sector
- 66. Growth in total aggregate personal income, 1970-1999 • About a 17x increase in aggregate personal income.
- 67. Per capitata income (1999)
- 68. Trend in Alaska oil production, 1975-2009 • Peak oil was in 1988. • Current production is similar to that in the early phases of the Prudhoe Bay field despite greatly expanded infrastructure.
- 69. Arctic Demographics • Boom in the Arctic has shifted from Alaska to Canada and West Siberia, Russia. From Hamilton 2009, h:p://carseyins#tute.unh.edu/alaska‐indicators‐ northern.html
- 70. Size of Permanent Fund Dividends • All Alaska residents, including children, receive an annual dividend from the Alaska State government.
- 71. Size of Permanent Fund Dividends • The size of the dividend is dependent on revenues on state taxes of the oil!
- 72. Major conclusions regarding social dimension on the North Slope • Major changes occurred to North Slope life style and incomes as a result of oil development. • The current standard of living for North Slope residents will be impossible to maintain unless significant external sources of local revenue are found.
- 73. Effects of Climate Change: Impacts of changes in sea ice: Percentage changes in coastal sea ice and land temperatures (1982-2008) Sea ice cover and Summer Warmth Sea ice within 50-km of coast: -25% for Arctic as a whole: <-44% in E. Siberia to Chukchi seas; some increases in Bering region and other scattered areas. Summer land temperatures (SWI): +24% Arctic as a whole; +30% in North America, +16% Eurasia. Largest increases in Canadian High Arctic and Greenland (>70%). Bha: et al. 2010 submi:ed. Earth Interac+ons.
- 74. Importance of multi-year ice • Much of indigenous use of Arctic Ocean resources is dependent on thick multi-year sea ice. • This has been declining steadily over the period of March 2010 sea‐ice extent the record.
- 75. Polynyas: Winter- long areas of open water with high subsistence value. Polynyas near Devon and Cornwallis islands (26 May 2002): White is ice, snow and clouds. Black is open water. • In Arctic Canada: Sea-ice provides access polynyas. • Many traditional village sites are located near polynyas. Murray and Hannah 2010. Tidal Mixing, Polynyas, and Human Se:lement in the Canadian Arc#c Archipelago. From: Murray and Hannah 2010. Tidal Mixing, State of the Arc#c Conference, Miami, Fl Polynyas, and Human Settlement in the Canadian Arctic Archipelago. State of the Arctic Conference, Miami, Fl.
- 76. Ecological hot spots: Prehistoric settlements Ilulissat, Greenland, 2009 Pre‐Dorset (Paleoeskimo), ca.4500‐2300 BP Dorset (Paleoeskimo), ca. 2300‐1000 BP Polynyas in Canadian Archipelago. From: Murray and Hannah 2010. Tidal Mixing, Polynyas, and Human Settlement in the Canadian Arctic Archipelago. State of the Arctic Conference, Thule (Ancestral Inuit), Miami, Fl. ca. 800‐200 BP
- 77. Mel#ng ice like this has forced hunters in Qaanaaq, Greenland to change centuries‐ Siku-Inuit-Hila (Sea Ice- old hun#ng routes. Photo Lene Kielsen Holm, courtesy ICC‐Greenland People-Weather) Project Started by: Canadian scientist Shari Gearheard Barrow whaling crew return to Funding: US National Science the sea ice edge Foundation. in the their umiaq (seal skin boat). Objective: To document the changing relationship of Inuit to the sea ice. Do it by setting up monitoring stations manned by locals and allowing Inuit hunters to travel to each others communities and see how ice was changing across the Arctic Siku ‐ Inuit ‐ first-hand. Hila hunters Joe Leavi: and Joelie Recruited hunters in three Sanguya talk on sea ice northern communities: Clyde edge near River, Canada; Barrow, Alaska; Barrow, and Qaanaaq, Greenland. In total, Alaska. 21 hunters and scientists were Photos: involved in the project. courtesy Shari Gearheard
- 78. Effects of the 2007 sea-ice minimum
- 79. Immediate and cumulative effects of 2007 sea-ice minimum on coastal communities in Alaska Feedbacks from changing environmental conditions and global processes: – Greater distance traveled – Higher cost of fuel – Lower success of harvest – Higher cost of purchased goods – Needs for wage labour – Out migration to cities – Impacts on health Courtesy of Maribeth Murray Butchering seals on the ice at Shishmaref, Alaska. Photo: K. Stenek
- 80. Cumulative effects of resource development, reindeer herding, and climate change on the Yamal Peninsula, Photo: Bryan and Cherry Alexander
- 81. The Yamal: Typical of the sorts of changes that are likely to become much more common in tundra areas of Russia and the circumpolar region within the next decade. • Currently, large undeveloped areas with no roads, but… • large-scale gas and oil potential, • extraordinarily sensitive permafrost environment • traditional pasturelands for the nomadic Yamal Nenets people, • rapid changes in climate. Goal: Develop tools using detailed ground observations, remote sensing and modeling to better predict the cumulative effects of resource development, climate change, reindeer herding, and the role of terrain factors in affecting changes in tundra regions.
- 82. Finnish ENSINOR project • Environmental and Social Impacts of Industrialization in Northern Russia (ENSINOR). • Funded by Finnish Government because Finland is almost totally dependent of Russia for gas. • Case study in three intensive research areas. Oil in NAO and gas in YNAO. • Studied changes in social-ecological systems, including herding. • 20-30+ time slice. • Local and scientific knowledge (geography,
- 83. Yamal: Center of future gas production in Russia Courtesy of A. Gubarkov
- 84. Bovanenkova is one of 18 large gas fields on the Gas Yamal that are planned for deposits development. in Courtesy of A. Gubarkov
- 85. Huge potential gas reserves Courtesy of A. Gubarkov
- 86. Yamal is currently at the stage of development that Prudhoe Bay was in 1974 before construction of the Dalton Highway. • Development has been delayed since the 1980s by several factors including settlement of Nenets land claims. • Currently no road or train access. • Both should be in place in summer 2011.
- 87. Existing and proposed gas lines and transportation corridors Existing gas fields and pipelines in Proposed pipeline and the Yamalo-Nenets Autonomous transportation corridors on Yamal Okrug Peninsula Courtesy of A. Gubarkov
- 88. Yambourg Gas Field, Tazovsky Peninsula • Discovered in 1981 and rapidly developed with winter road access.
- 89. Terrain factors that make the Yamal region so sensitive to disturbance Sandy nutrient poor soils: Extreme ground-ice conditions: – Highly susceptible to wind erosion. – Extreme ice-rich permafrost makes the region – Poor plant production, low plant very susceptible to thermal erosion and diversity, slow recovery. landslides. T. Kumpula: Yamal LCLUC Workshop, Moscow, 28-30 Jan 2008.
- 90. The Nenets people and their reindeer Florian Stammler: Yamal LCLUC Workshop, Moscow, 28-30 Jan 2008; Central photo: D.A. Walker.
- 91. Effects of reindeer herding Overgrazing Trampling Grassification Wind erosion . Photos: Bruce Forbes.
- 92. Working with sociologists: Combining remote sensing and traditional knowledge Florian Stammler interviewing members of Nenets brigade using remote sensing products to learn about their land-use patterns. Photo: Bruce Forbes
- 93. Effects of resource extraction:Use of remote sensing and GIS to inventory direct and indirect effects of the Bovanenkovo Gas Field. T. Kumpula: Yamal LCLUC Workshop, Moscow, 28-30 Jan 2008.
- 94. Detectability of impacts with different sensors • Quickbird best available sensor for most gas field impacts. • Better than ground surveys for detecting off-road vehicle trails. T. Kumpula: Yamal LCLUC Workshop, Moscow, 28-30 Jan 2008.
- 95. GIS and remote sensing approach to catalog impacts GIS database collection • Visual interpretation of impacts • Develop digital elevation model from 1:100,000 maps • Digitize boundaries – Roads 448 km2 – Pipeline network – Off-road vehicle trails – Infrastructure – Quarries Extent of Bovanenkovo Gas Field Direct (planned) impacts: Infrastructure 2.1 km2 Quarries 4.3 km2 Roads 2.9 km2 (79km) TOTAL 9.3 km2 Indirect impacts with changed vegetation (mainly shrubs to graminoids): Off-road vehicle tracks 24 km2 (250 km) TOTAL DETECTIBLY CHANGED AREA 33.3 km2 Total extent of the gas field (perimeter) T. Kumpula: Yamal LCLUC Workshop, Moscow,2 28-30 Jan 2008. including currently enclosed unimpacted areas 448 km
- 96. Analysis of impacts of resource extraction to pasturelands Brigade migration corridors VIII and IV
- 97. Impacts of Bovanenkovo gas field to summer pasture of Brigades 4 and 8 • Brigade 4: 225 km2 out of total 1019 km2 summer pasture • Brigade 8: 200 km2 out of total 796 km2 summer pasture Timo Kumpula: Yamal LCLUC Workshop, Moscow, 28-30 Jan 2008.
- 98. Comparison of Bovanenkova and North Slope development** Area (length), km2 (km) Bovanenkova North Slope Direct impacts: Roads 2.9 (79) 12.0 (954) Airstrips 0 1.1 Gravel pads 2.1 23.5 Quarries 4.3 25.8 Off‐shore gravel placement 0 0.6 Total direct impacts: 9.3 62.4 Other affected area: 24 7.1 Total extent of field(s) perimeter including currently enclosed unimpacted areas. 448 2600 **Data: North Slope (NRC, 2003), Bovanenkova (Kumpula 2011)
- 99. General conclusions from the ENSINOR project 1. The patterns and processes of changes in sea ice, land use and land cover relevant to human dimensions are variable across the Arctic. 2. In North America, sea ice reduction has profound impacts on some aspects of human access to marine mammals, yet polynyas and ecological ‘hot spots’ remain remarkably consistent across millennia. 3. In the circumpolar North, sustained retreat of sea ice has profound implications for air temps and vegetation cover in tundra regions. 4. Increases in deciduous shrubs are pronounced for the western portion of the Russian Arctic and clearly linked to observed trend in NDVI.
- 100. General conclusions from the ENSINOR projec (cont.) 6. The Yamal-Nenets social ecological system has successfully reorganized in response to recent shocks: Anthropogenic fragmentation of a large proportion of the environment, socioeconomic upheaval, and pronounced warming in summer and winter. 7. Institutional constraints and cultural factors and drivers were clearly as important as the documented ecological changes, so even the highest resolution satellite imagery only gets us so far in documenting change. 8. Particularly crucial to success is the unfettered movement of people and animals in space and time. Future institutional arrangements must specifically target mutual coexistence and make use of latest data.
- 101. The larger value of an analysis of cumulative effects on the Yamal Peninsula will be in the lessons learned and the applications of those lessons to other areas of potential development.
- 102. Effects of climate change: Analysis of sea-ice, land surface temperature and NDVI trends Is the trend in sea-ice affecting Arctic vegetation ? More about this in the next Lecture! Since 1980, perennial sea ice extent in the Arctic has declined at the rate of 10.1% per decade. 2007! Comiso et al.: 2008, Geophysical Research Letters, 35: L01703.
- 103. 2007-2010 Expedition to Yamal Peninsula Region, Russia Data collected: Data reports Soils Plant Cover NDVI & LAI Ground temperatures Active layer Plant Biomass http://www.geobotany.uaf.edu/yamal/ documents/yamal_2007_dr080211
- 104. Biomass along the Yamal transect n n,s n,s s s n = no reindeer s = sand Climate trend: Epstein et al: 2000-2300 g m-2 at Nadym to about 1000-1300 g m-2 at Vaskiny Dachi. NASALCLUC meeting 2008. Effect of sandy soils: • Sandy soils have 250-350 g m-2 less biomass than comparable clayey sites • Much more lichen biomass and less mosses and graminoids. Effect of reindeer: • Ungrazed sandy areas near Nadym – over 1000 g m-2 • Less than 250 g m-2 in sandy areas where reindeer grazing has occurred annually.
- 105. Modeled productivity of PFTs on the Yamal • ArcVeg model (Epstein et al. 2002) • Examines succession of biomass for seven Arctic plant functional types. • Five climate scenarios. • Warming vs. non-warming treatments. • Three grazing intensities. • Next steps will incorporate soil type and disturbance regimes (dust and complete removal of vegetation), relate to NDVI and develop regional extrapolations. Yu and Epstein: 2008, NASA LCLUC conference.
- 106. BIOME4/LPJ model Using the terrain, soil, and vegetation data to improve BIOME4 global vegetation change model. Kaplan, J.: Yamal LCLUC Workshop, Moscow, 28-30 Jan 2008.
- 107. Cumulative effects in the Yamal Resource development: • Indirect (unplanned) impacts are greater than the direct (planned) impacts. • Roads and pipelines: serious barriers to migration corridors. • Effects will increase as new field are developed. Landscape factors and terrain sensitivity: • High potential for extensive landscape effects due to unstable sandy soils, and extremely ice-rich permafrost near the surface. Reindeer herding: • Land withdrawals by industry, increasing Nenets population, and larger reindeer herds are all increasing pressure on the rangelands. • Herders view: Threats from industrial development much greater than threats from climate change. • They generally view the gas development positively because of increased economic opportunities. Climate change: • Satellite data suggest that there has been only modest summer land-surface warming and only slight greening changes across the Yamal during the past 24 years. (Trend is much stronger in other parts of the Arctic, e.g. Beaufort Sea.) • Kara-Yamal: negative sea ice, positive summer warmth and positive NDVI are correlated with positive phases of the North Atlantic Oscillation and Arctic Oscillation.
- 108. Recent publications • Goetz, S.J., Epstein, H.E., Alcaraz, J.D., Beck, P.S.A., Bhatt, U.S., Bunn, A., Comiso, J.C., Jia, G.J., Kaplan, J.O., Lilschke, H., Lloyd, A., Walker, D.A., and Yu, Q., 2011, Recent changes in Arctic vegetation: Satellite observations and simulation model predictions, in Gutman, G., and Reissell, A., eds., Eurasian Arctic Land Cover and Land Use in a Changing Climate, Volume VI: New York, Springer, p. 9-36. • Walker, D.A., Forbes, B.C., Leibman, M.O., Epstein, H.E., Bhatt, U.S., Comiso, J.C., Drozdov, D.S., Gubarkov, A.A., Jia, G.J., Karlejaärvi, E., Kaplan, J.O., Khumutov, V., Kofinas, G.P., Kumpula, T., Kuss, P., Moskalenko, N.G., Raynolds, M.K., Romanovsky, V.E., Stammler, F., and Yu, Q., 2011, Cumulative effects of rapid land-cover and land-use changes on the Yamal Peninsula, Russia in Gutman, G., and Reissel, A., eds., Eurasian Arctic Land Cover and Land Use in a Changing Climate, Volume VI: New York, Springer, p. 206-236. • Walker, D.A., Leibman, M.O., Epstein, H.E., Forbes, B.C., Bhatt, U.S., Raynolds, M.K., Comiso, J., Gubarkov, A.A., Khomutov, A.V., Jia, G.J., Kaarlejaärvi, E., Kaplan, J.O., Kumpula, T., Kuss, H.P., Matyshak, G., Moskalenko, N.G., Orechov, P., Romanovsky, V.E., Ukraientseva, N.K., and Yu, Q., 2009, Spatial and temporal patterns of greenness on the Yamal Peninsula, Russia: interactions of ecological and social factors affecting the Arctic normalized difference vegetation index: Environmental Research Letters, v. 4, p. 16.
- 109. The Future Synthesis of Yamal and North Slope cumulative effects studies. Update the Prudhoe Bay studies to the present. Develop predictive change models – Based on field data from both areas, – Apply to new areas of development. National Research Council 2003
- 110. Collaborators D.A. Walker, U.S. Bhatt, V.E. Romanovsky, G.P. Kofinas, M.K. Raynolds J.P. Kuss: University of Alaska, Fairbanks, AK, USA, H.E. Epstein, Q. Yu, G.J. Jia, J.O. Kaplan, G.V. Frost: Department of Environmental Sciences, University of Virginia, USA, B.C. Forbes, F. Stammler, T. Kumpula, E. Karlejäarvi: Arctic Centre, Rovaneimi, Finland, M. Leibman, N. Moskalenko, A. Gubarkov, A. Khomutov, G. Matyshak D. , Drozdov: Earth, Cryosphere Institute, and Moscow State Univesity, Moscow, Russia, J.C. Comiso, J. Pinzon, J.C. Tucker: NASA Goddard, USA. Funding: NASA Land Cover Land Use Change Initiative, Grant No. NNG6GE00A NSF Grant No. ARC-0531180, part of the Synthesis of Arctic System Science initiative. Finnish participation came from the Russia in Flux program of the Academy of Finland (Decision #208147).
Notas do Editor
- \n
- \n
- Quotes from the UNEP The 3rd IPCC report estimates that warming in the Arctic will occur at twice the global average in a range of 1.4 to 5.8&#xBA; C over the next century. The recently released report, the Arctic Climate Impact Assessment (ACIA, 2004), confirms these numbers and concludes that the average temperature in the Arctic has already increased at twice the global average over the past 50 years. Temperature is projected to increase by 5-7&#xBA; C over the next 100 years. Already the vast pack ice, so crucial to Arctic peoples&#xA0;for wildlife, travel and hunting, is diminishing- though with great annual variations.\n\nClimate change scenario for the end of the century. Increased transport in the Arctic of people and goods will become accelerated due to decreased extent of ice. This will not only increase the amount of oil transport and accelerate coastal development, it will also open up new regions for fisheries and shipping. As a result, fragmentation of the Arctic environment will increase, which may threaten marine life and increase the probability of the introduction of invasive species through, for example, the dumping of ballast water from other regions as well as oil spills.Along with increased shipping and access to tourism, coastal communities face increasing exposure to storms and overall coastal erosion.Furthermore, vast areas with permafrost will melt, resulting in erosion, infrastructure problems and substantial increases in atmospheric&#xA0;concentrations of methane&#xA0;previously stored in the permafrost- thereby further accelerating climate change. Vast unpolluted and unexploited marine areas and coastal shores will not remain isolated and inaccessible much longer. \n\nA lot of research effort is going into the vast web of climate-related issues that are expected to impact the Arctic.\n
- Figure 16. Industrial development in the Arctic. The Arctic has been opened up for increased exploration of petroleum, gas and mining activities. The Barents Sea, the Mackenzie Valley in Canada and the Alaskan North Slope, are the areas of chief interest at the moment. Notice that the shipping routes in Northern Canada are not open today because of ice. The Northern Sea Route north of Russia is partly open today.\n
- Figure 20. Cumulative impacts of development in the Arctic.Overview of the pressure on biodiversity, including reindeer and caribou, from infrastructure development. Note that most of this development is less than 100 years old, with little impact in the Arctic. (Source, http://www.globio.info/).\n\nFigure 21. Scenarios of development. Extent of human impacts on biodiversity&#xA0;resulting from&#xA0;piecemeal development of infrastructure by 2032 with continued development rates under a market forces favourable scenario (UNEP, 2001; 2003; Nellemann et al. 2003). Notice that this model-generated scenario currently underestimates the rapid exploration and development activity taking place on the North Slope of Alaska and in the Mackenzie Valley region in Canada (see separate maps). Some estimates (UNEP, 2001) project that perhaps as much as 80 percent of the Arctic land area will become impacted by development by 2050 if current trends continue.\n
- Figure 19. Existing and planned development in the Mackenzie Valley, Northwest Territories, Canada. (Courtesy of Cizek and Montgomery, 2004; www.carc.org).\n
- Figure 24. Protected areas of the Arctic as recognized by the IUCN in the World Protected Areas Database at UNEP-WCMC, 2005. Some areas, like the Dehcho territory in Canada have been placed under interim protection. Information from Russia may be incomplete. Note the lack of marine protected areas, despite their ecological significance and importance to indigenous peoples.The Arctic appears to hold the world&#x2019;s last remanining undeveloped coastal ecosystems &#x2013; but less than 1 percent of the marine coastal areas are currently protected. Only 7% of the Arctic coastlines were impacted by development in 2002 and only 0.8% had severe impacts, apart from coastal fisheries. Hence, the Arctic now appears to hold the world&#x2019;s last remaining undeveloped coastal ecosystems &#x2013; but less than 1 percent of the marine coastal areas are currently protected. Indeed, while large land area in some regions have been set aside, the marine component &#x2013; so critical to arctic food chains and coastal ecosystems &#x2013; remains vastly unprotected. These ecosystems also represent those at the highest risk as access increases for industrial trawlers, fisheries and industrial exploration of minerals and petroleum along the coasts, and as new infrastructure and the receding sea ice open up new areas for exploitation. \n
- \n
- \n
- \n
- \n
- \n
- \n
- \n
- \n
- \n
- \n
- \n
- \n
- \n
- \n
- \n
- \n
- \n
- \n
- \n
- \n
- \n
- To get some idea of the economic impact of the oil and gas to the Native communities in Northern Alaska. I\nIt is by far the largest municipality in the U.S., 230,056 square km, larger than 39 states.\nPopulation: 7,555 in 1998, lowest population density of any municipality or county (0.033 persons per square km).\nPrior to the discovery of oil, villages on the North Slope were remote and undeveloped.\nDiscovery of oil on the North Slope rapidly led to native land agreement, the Alaska Native Claims settlement Act (1971), formation of North Slope Borough and Arctic Slope Regional Corporation (1972), and greatly accelerated movement into mainstream economy (compare per capitata income of North Slope villages to Arctic Village, which is outside that Borough). \nNSB taxes oil infrastructure.\n
- \n
- \n
- \n
- \n
- \n
- \n
- \n
- \n
- \n
- \n
- \n
- \n
- \n
- \n
- \n
- \n
- \n
- \n
- \n
- \n
- \n
- \n
- \n
- \n
- \n
- \n
- \n
- \n
- \n
- \n
- \n
- \n
- We can expect that development in the Arctic, development flowing from environmental change, will also impact demography. As offshore resources are developed communities can expect to see an increase in infrastructure, wage labor, and diversification of labor. Such processes tend to lead to an increase community size and demographic diversity as there is a net in-migration process &#x2013; at least temporarily. The impact of development extends beyond changing land use, to food systems and local carrying capacity as well a fluctuating opportunities for income. Industrial development of one sort or another, is a pan-arctic yet opportunities for understanding feedbacks at the local, regional and pan-arctic scales, in the context of changing environment are certainly underexploited. \n\nNote that both the North Slope of Alaska and the Yamal Peninsula are in areas of major oil and gas deposits. The North Slope is well along in the production phase, whereas the the Yamal is still in the exploration and development phase but will be soon be linked by pipelines to the existing pipelines and infrastructure just south of the Yamal Peninsula.\n
- To get some idea of the economic impact of the oil and gas to the Native communities in Northern Alaska. I\nNSB is by far the largest municipality or county in the U.S., 230,056 square km, larger than 39 states.\nPopulation (1998): 7,555, lowest population density of any municipality or county (0.033 persons per square km).\nOil development on North Slope rapidly led to Alaska Native Claims settlement Act (1971), formation of North Slope Borough and Arctic Slope Regional Corporation (1972), and greatly accelerated movement into mainstream economy (compare per capitata income of North Slope villages to Arctic Village, which is outside that Borough). \nNSB mainly taxes oil infrastructure (property taxes).\nThis has had major impact on the standard of living of villages within the NSB, but little effect on villages outside the NSB.\n
- \n
- \n
- \n
- \n
- \n
- The composition of Arctic communities is changing. Migration flows can respond quickly to changing conditions, including opportunities elsewhere. On average, most places experienced net out-migration over this period. Under some conditions, net out-migration offsets natural increase, resulting in population stability or decline. Otherwise, population shows a tendency to increase. Many places grew by 30 percent or more, without net in-migration, from 1990 to 2006. Environmental change, coupled with connectivity to the global system, influences community demography and viability in a number of different ways and is variable from year to year. \n\nPresently, the North Slope is experiencing net population decrease associated with the declining oil field activity in this region; whereas, the Yamal region is experiencing a strong net increase largely due to the increased gas development activity.\n\n\n
- \n
- \n
- \n
- \n
- \n
- \n
- Anthropological, biological, and geographical fieldwork in the circum-arctic during the first half of the 20th century established baseline information on indigenous land use and occupancy at local and regional scales. Land use patterns were tied to the distribution of ecosystem services, to local and regional weather patterns, and to seasonal timing of key events &#x2013; this was true for hunting and gathering populations, nomadic herders, agricultural groups, and for commercial whalers, sealers, fishermen and other resource based enterprises, although the emphasis in research was on indigenous communities and subsistence. To take Alaska as an example, historic Alaska Native land use patterns are reconstructed primarily from archaeological and ethnographic accounts. There has been, until recently, a general assumption that even with changing technology and acculturation, historic patterns of subsistence and land use persisted until the fairly recently when climate change and globalization began to have influence on these. Beginning in 1978 ADF&G conducted a series of subsistence studies in 180 communities in Alaska. Recent synthesis of this ADF&G subsistence survey data, along with wildlife distributions, and ethnographically described patterns indicates that subsistence practices and land use have changed significantly over the past 60+years, at least in interior Alaska. Changes include shifts in the types and proportions of species hunted, changes in hunting areas, and in some case expansion of land use for hunting purposes along transportation corridors, in others restriction of hunting territories. Change varies across communities in relation to imposed hunting regulations, access to population centers, and length of contact with the larger global system (from Patterson 2009), and, more recently with changes in seasonal onset of key events, and the price of fuel.\n
- \n
- We can take the summer of 2007 as an example &#x2013; that summer saw witness to the greatest known loss of perennial pack ice over the arctic ocean. Ice loss was also great in 2008 - the second lowest year on record. Accelerated summer ice loss is predicted by many arctic climate models but the extent of loss in 2007 caught many by surprise; created a flurry of media coverage and highlighted the significant role of the arctic in global climate change, in geopolitical maneuvering, oil and gas and mineral exploration and in science. Because it is such a well recognized and thoroughly documented moment in the history of environmental research in the Arctic the summer of 2007 provides a jumping off point for considering the human response to arctic change both in the immediate sense and with respect to cumulative impacts on land use, food security and human health.\n
- Ice conditions in 2007 made it difficult for people to engage in subsistence hunting of marine species. In the immediate terms, the ice was unsafe, and wind conditions were unfavorable. Hunting was delayed in some communities and the distance to the hunt was substantially increased. In addition, because of the lack of ice with which to preserve meat on the return trip to communities, spoilage was high. However, 2007 isn&#x2019;t the only poor ice year in recent times. Poor ice conditions combined with unfavourable winds over multiple seasons increase community dependence on imported food. Imported food is extremely expensive to begin with but in 2007 fuel prices were among the highest in history. People faced a double jeopardy &#x2013; fuel for hunting was expensive and people had to travel long distances to engage in hunting activities. Hunting was not that successful and the need for purchased food increased, however, because of the fuel situation imported food costs had also increased thus there was a need for increased income, for both purchase of food and for heating oil. Opportunities for wage labor in small rural communities are limited and the need for increased income resulted in a flow of people out of the rural communities to the urban centers with several consequences. First, the quality of people&#x2019;s diet declines as reliance on store bought food increases. This is well documented across the arctic, leading to what some have called the nutrition transition with significant negative health and cultural impacts. In addition, out migration to urban centers acts to increases the vulnerability of both rural and urban communities because rural communities lose young people and social networks are disrupted, and urban communities struggle with absorbing the inflow of people.\n
- Good morning, My name is Skip Walker. I am part of a LCLUC/NEESPI project that is investigating the Cumulative effects of resource development, reindeer herding, and climate change on the Yamal Peninsula, Russia.\n
- \nThe Yamal is typical of the sorts of changes that are likely to become much more common in tundra areas of Russia and the circumpolar region within the next decade.\n\nCurrently, large areas of wilderness with no roads or development, but&#x2026;\nlarge-scale gas and oil potential, \nextraordinarily sensitive permafrost environment\ntraditional pasturelands for the nomadic Yamal Nenets people, \nrapid changes in climate.\n\nThe goal of this project was to determine the cumulative effects of resource development, reindeer herding, climate change, and role of terrain factors on the Yamal Peninsula\n
- \n
- The Yamal is the center of much of Russia&#x2019;s future gas production.\nRussia&#x2019;s current gas production is about 600 billion m3 of gas/yr, 20% of current world consumption.\nBy 2030 Yamal gas production is predicted to be about 250 billion m3/yr.\n
- \n
- \n
- \n
- Right now all the gas is still in place because there are no pipelines from this remote region.\nA major railroad and highway is being built to the oil field, and plans call for 4 large undersea pipelines to transport the gas to the Russia and Europe.\nThe main impacts so far have been concentrated at Bovenkova, but plans call for a network of pipelines and roads to connect to the other gas and oil fields scattered across the Yamal.\n
- \n
- This development is taking place on an extraordinarily sensitive landscape:\nTwo factors that make it so sensitive are:\n1. Sandy nutrient poor soils that are highly susceptible to wind erosion, and create poor plant production, low plant diversity, slow recovery.\n2, Extreme massive ground ice conditions which are very susceptible to landslides, such as those that occurred in the unusually wet year of 1989.\n\nThe extent of these impacts have gained the attention of Timo Kumpula who is now quantifying the effects of these factors using remote sensing.\n
- In the midst of of the \n\nThe Nenets people and their reindeer themselves have a significant impact. The Nenets people have privitized their herding activities, and both their own population and their herds have increased markedly over the past 80 years. The nomadic portion of the people population has recently stabililzed at about 5000.\n\nBut the private reindeer herds have increased 3x since 1981 to about 156,000 animals.\n
- There are numerous effects of all these animals, including \nOvergrazing and\nTrampling of the vegetation\nTransformation of previous sedge and shrub-dominated tundra vegetation into grasslands\nWind erosion of the some of he trampled areas.\n\nSome of these effects are be quantified using remote sensing tools by Timo Kumpula\n
- Bruce Forbes and Florian Stammler are also working with remotely-sensed images and the Nenets in the field to determine the effects of resource extraction and changing vegetation due to climate change on their herding activities.\n
- The examination of effects of the gas field are being conducted by Timo Kumpula at the Arctic Centre in Findland.\n
- He first of all identified what kinds of impacts can be detected with each of the available remote-sensing sesors.\n\nHe has determined that for these purposes, Quickbird imagery is the best easily available tool.\n\nFor some purposes, such as detecting off-road vehicle trails, it is better that ground surveys.\n
- He then used Quickbird to quantify the extent of the major direct and indirect impacts within the Bovanenkova Field.\nThe direct impacts were those are planned impacts such such as roads, gravel pads, and quarries. Indirect impacts are those that are not planned such as off-road vehicle trails, and the impacts of road dust, and areas of flooding.\n\nHe found that the indirect impacts were about 2.5 times greater than the direct impacts, and that the total area of influence of the gas field to such things as reindeer herding was about 40 times greater than direct impacts, which are the numbers that are usually reported by industry.\n
- Timo Kumpula is examining how the Bovanenkova field has impacted summer pasturelands along the corridors of the summer migration. \n\nThe herders and animals are divided into Brigades, and each of these migrates along well-defined corridors to their summer pasturelands. \n\nTwo of these, Brigades VIII and IV are heavily impacted by the presence of the Bovanenkova Gas Field.\n
- A large portion of the summer pastureland land of both of these brigades is no longer available to them.\n\nIn general the Nenets see the changes going on due to both resource extraction and climate change. \nThey recognize the threat of resource extraction to be a much greater threat than that of climate change. \nBut there are also positive aspects of the resource development. \n\nIn general the herders view the gas field activity positively because the influx of gas field workers provide a market for their reindeer that did not previously exist.\n
- \n
- \n
- \n
- \n
- We are also examining the effects of climate change on the vegetation of the Yamal.\n\nWe are particularly interested in how the sudden and dramatic changes in extent of sea ice is affecting the vegetation.\n
- The results from the expedition were summarized in a data report that is available on line.\n
- Knowledge of this history is particularly important to interpreting the biomass data that were collected during the 2007 expedition. We saw three clear trends in the data:\n1. Climate trend:\n2000-2300 g m-2 at Nadym to about 1000-1300 g m-2 at Vaskiny Dachi.\n\n2. Effect of sandy soils: \nSandy soils have 250-350 g m-2 less biomass than comparable clayey sites\nMuch more lichen biomass and less mosses and graminoids. \n\n3. Effect of reindeer:\nUngrazed sandy areas near Nadym &#x2013; over 1000 g m-2 \nLess than 250 g m-2 in sandy areas where reindeer grazing has occurred annually\n
- All of these factors and data sets are being used in a model of vegetation productivity being developed by Howie Epstein and Qin Yu at the University of Virginia. \n
- \n
- \n
- \n
- The study has just finished the second year. In the last year of the project we intend to focus on the cumulative impacts of all the factors discussed here.\n\nWe hope to eventually expand the generalilty of the results by comparing the Yamal situtation with the most extensive analysis analysis of the oil and gas development which was conducted in the Prudhoe Bay oil field of northern Alaska by the US National Research Council. \n
- \n